Near-by Futures, Continuous Futures and ETFs .... December Crude Shows Signs of a Reversal .... Brent Crude is Holding up Better .... Upside Targets for Light Crude and Bren .... Energy Breadth Still Bullish Overall .... XLE Extends Choppy Uptrend .... XES Surges toward Range Resistance .... Symbols for Futures Contracts .... //// ....
Today's commentary will dissect the energy sector. I will first look at the medium-term charts for Light Crude and Brent crude, and then look at long-term charts for a price target. Once I have an outlook for oil, I will turn to the energy sector by looking at the sector SPDR, the equal-weight sector ETF and three breadth indicators. These will help me establish a trend bias for the sector has a whole. I will end with medium-term charts for the Energy SPDR (XLE) and Oil & Gas Equip & Services SPDR (XES).
Near-by Futures, Continuous Futures and ETFs
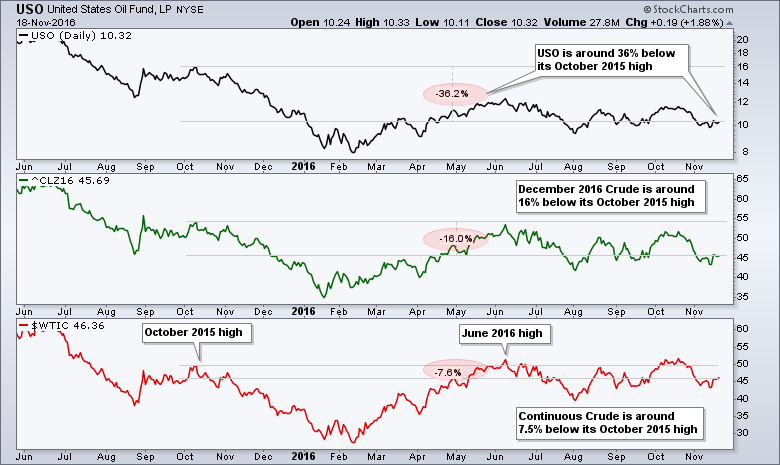
Before looking at the price chart, note that I am using December Crude Futures (^CLZ16) for analysis. Chartists have a choice of the USO Oil Fund (USO), the Continuous Crude Futures ($WTIC) or the near-by month Crude Futures (^CLZ16) for analysis. My preference is the near-by month because it represents the purest picture for supply-demand dynamics. The Continuous Futures is a patch-work of futures contracts, while ETF is a based on a basket of futures contracts spread over a few months. It is fine to trade USO, but I prefer to use the near-by futures contract for analysis and trading decisions. Note that the futures contracts at StockCharts are updated at the end of the day (EOD) so this is not for intraday trading. The chart below shows all three for reference with the Percentage Change Tool extending from the October 2015 high to the current close. Notice how the performance from October-2015 to now differs for all three. Also notice the difference between October 2015 highs and the June 2016 highs.
December Crude Shows Signs of a Reversal
The next chart focuses on December Crude over the last six months. Crude broke a wedge trend line and moved below its September low, but this support break did not hold as crude quickly reversed. Notice the two black candlesticks, the spinning top and the long white candlestick (blue oval). These four candlesticks capture the essence of a morning doji star reversal. Crude stalled after the long white candlestick, but closed strong on Friday and a follow through breakout would be bullish.
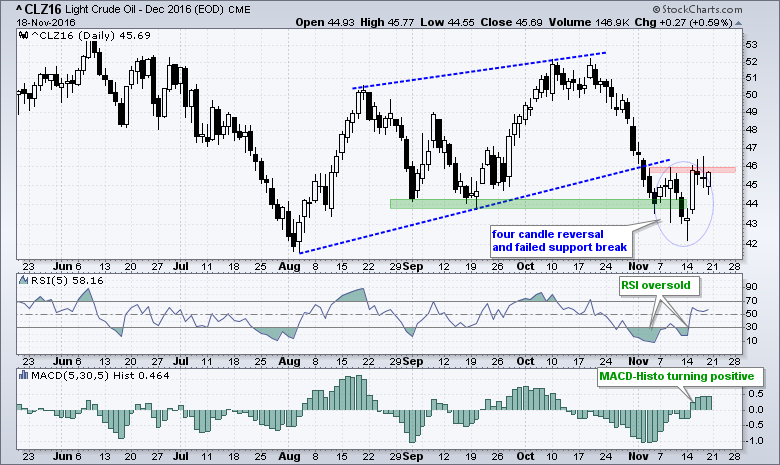
The indicator windows show RSI(5) becoming oversold twice and the MACD Histogram turning positive four days ago. This means short-term momentum is turning up and supportive of a reversal.
Brent Crude is Holding up Better
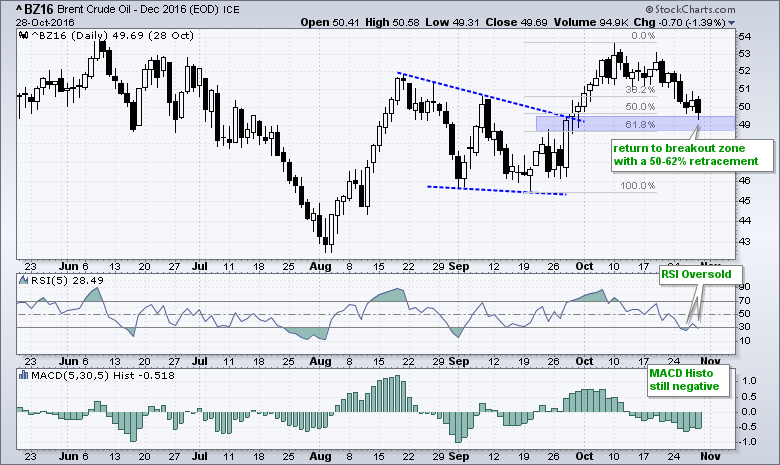
December Brent Crude (^BZ16) is even stronger than December Light Crude. Brent is the benchmark price for oil across the pond (Atlantic). Right away we can see that Brent is holding up much better than Light Sweet Crude, which is the US benchmark. Brent is well above its September low and trading in a potential reversal zone. Notice that the pullback returned to the breakout zone and retraced 50-62% of the prior advance. This is typical for a pullback within a bigger uptrend and I am watching for a possible short-term reversal here. A break above 51 would provide the first clue. A bullish momentum signal would trigger if the MACD Histogram turns positive.
Upside Targets for Light Crude and Brent
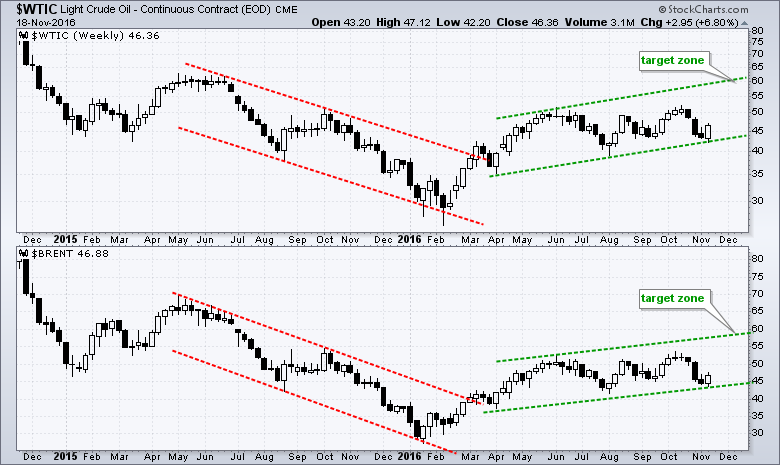
I use the Light Crude Continuous Futures ($WTIC) and the Brent Crude Continuous Futures ($BRENT) on long-term charts to determine the overall trend. Personally, I would not mark support or resistance levels on this chart and instead defer to the near-by futures contract. Based on the general trends and the analysis above, $WTIC and $BRENT could be in rising channels with an upside target around $60.
Energy Breadth Still Bullish Overall
Now that we have an outlook on oil (bullish), lets turn to energy-related stocks and start with the energy sector. The chart below shows the Energy SPDR (XLE), EW Energy ETF (RYE) and three breadth indicators. The ETFs are shown as the 5-day EMAs and 200-day EMAs. First, note that both 5-day EMAs are above their 200-day EMAs and have been since mid April. The uptrend may not be steep, but it is clearly up.
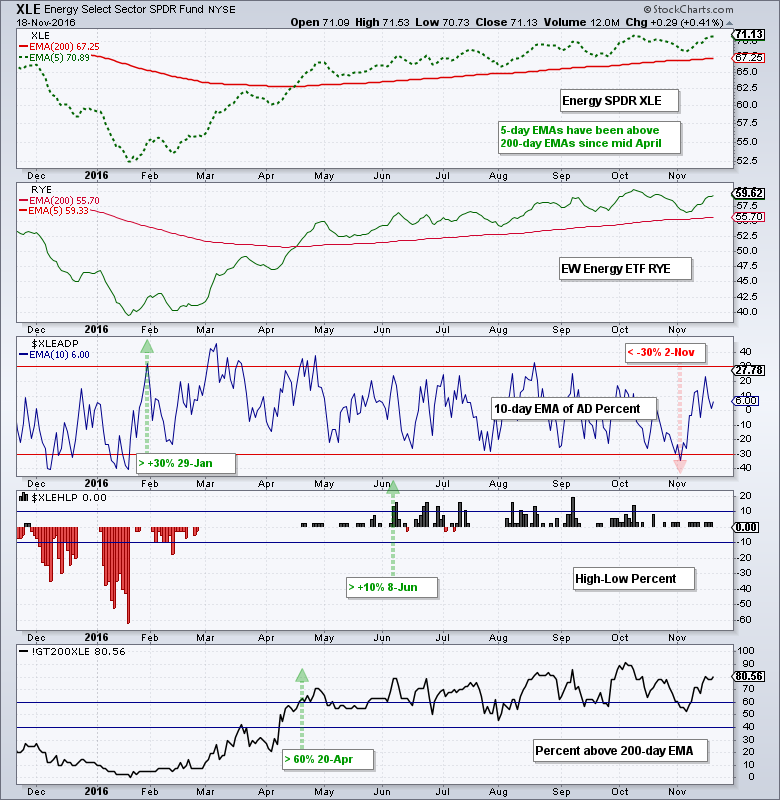
Breadth is bullish when at least two of the three indicators are on bull signals. The 10-day EMA of AD Percent moved below -30% in early November to trigger a bearish signal, but the other two remain on bullish signals. Energy High-Low% ($XLEHLP) exceeded +10% in early June to turn bullish and the Energy %Above 200-day EMA (!GT200XLE) exceeded 60% in mid April to turn bullish. These two remain bullish until High-Low Percent moves below -10% and %Above 200-day moves below 40%.
XLE Extends Choppy Uptrend
XLE remains in a clear rising channel with a string of higher highs and higher lows since May. Chartists can mark support with the last reaction low at 67 (early November). A close below this level would call for a re-evaluation of the overall uptrend.
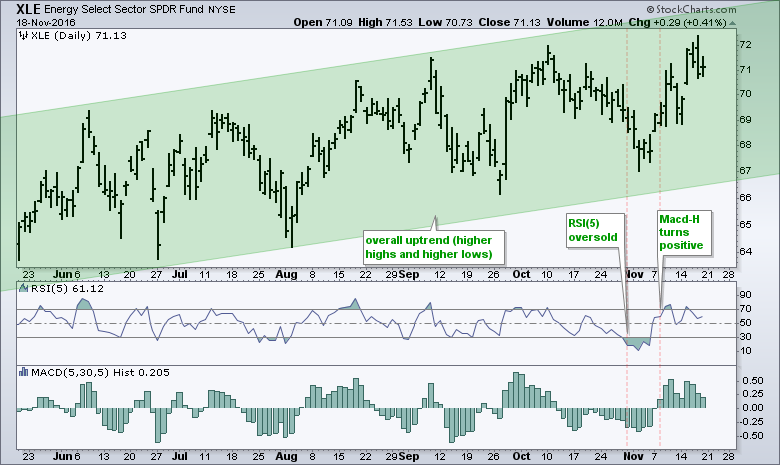
The indicator windows show RSI(5) to identify short-term oversold conditions within an uptrend and the MACD Histogram (5,30,5) to identify subsequent upturns in momentum. I am still working on testing this strategy, but I would guess that the MACD (12,26,9) does not add much value to the system. Why? Because the entry levels will be later since prices have already turned up. RSI was short-term oversold on 31-Oct and the MACD Histogram turned up on 8-Nov. The red lines show these two dates so chartists can compare the signals. Don't look at just one or two signals. Look at ten or more. Sometimes the MACD Histogram helps, and sometimes it doesn't.
XES Surges toward Range Resistance
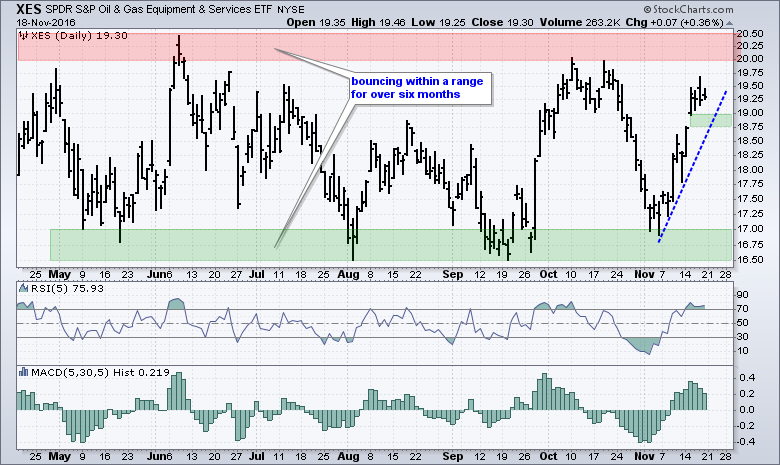
The next chart shows the Oil & Gas Equip & Services SPDR (XES) bouncing within a range over the last seven months. The surges off range support were strong, but each one failed to result in a breakout. XES became oversold in late October, firmed in early November and surged on 9-Nov. The swing here is clearly up and I would mark upswing support at 18.75 (gap and trend line).
Symbols for Futures Contracts
StockCharts users can find the symbols for futures contracts by searching the symbol catalog for the caret (^). All futures contracts begin with a caret.
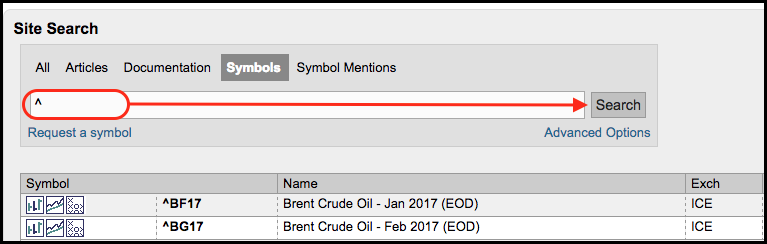
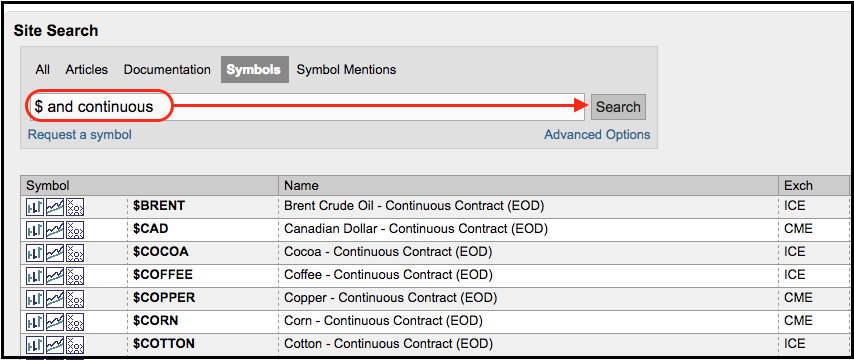
StockCharts users can find the continuous contract symbols by searching for "$ and continuous" (without quotation marks).

******************************************************
Measuring Risk On-Risk Off - Using charts to quantify stock, economic and credit risk.
PPO Trading Strategy - How to use 3 PPOs to develop a trend-reversion trading strategy.
Long-term Trend Indicators - Using the PPO, EMA Slope and CCI to determine the trend.
ETF Master ChartPack - 300+ ETFs organized in a Master ChartList and in individual groups.
Follow me on Twitter @arthurhill - Keep up with my 140 character commentaries.
****************************************
Thanks for tuning in and have a good day!
--Arthur Hill CMT
Plan your Trade and Trade your Plan
*****************************************


