 ----- Webinar Video ----- Art's Charts ChartList -----
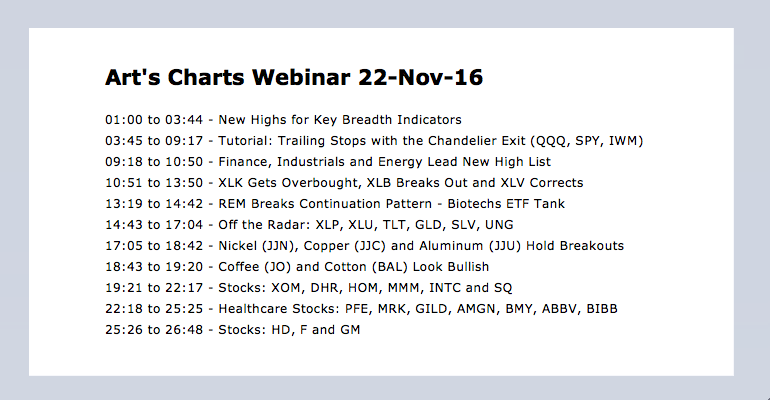
New Highs for Key Breadth Indicators .... Trailing with the Chandelier Exit .... QQQ Joins the Overbought Ranks .... Finance, Industrials and Energy .... Lead New High List .... XLK Becomes Overbought .... XLB Breaks out of Pennant .... XLV Corrects after Island Reversal .... REM Breaks Continuation Pattern .... //// ....
New Highs for Key Breadth Indicators
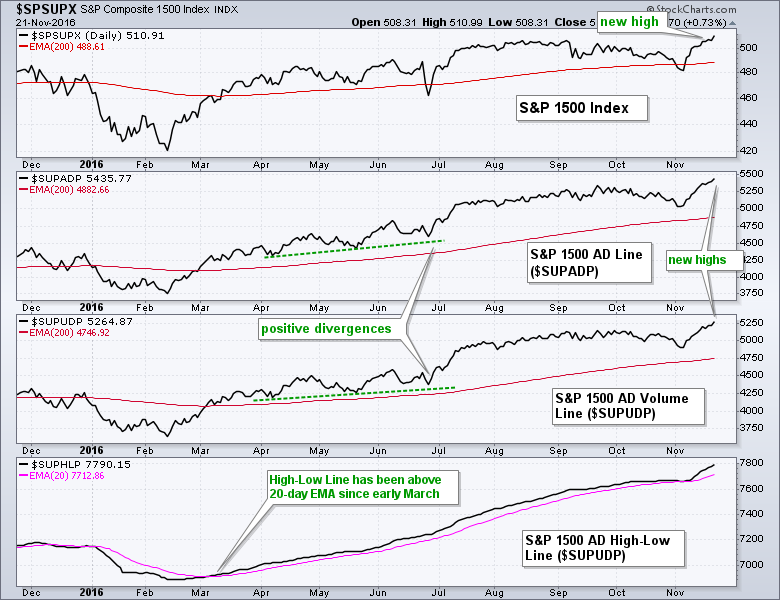
In addition to my "go to" breadth indicators for the broader market, I also look at the AD Line, AD Volume Line and High-Low Line for the S&P 1500. The S&P 1500 is the perfect index for broad market breadth indicators because it includes the S&P 500, S&P MidCap 400 and S&P Small-Cap 600. All sectors are representative with around 570 stocks from the Nasdaq and 930 stocks from the NYSE. This index is a great representative for the stock market as a whole. And guess what? The AD Line, AD Volume Line and High-Low Line hit new highs this week. Actually, they all hit new highs last week and affirmed with new highs again this week. Throw in new all-time highs in the S&P 500, Russell 2000 and Nasdaq, and we clearly are clearly in a bull market environment. This means the path of least resistance is UP. Pullbacks and short-term oversold conditions are viewed as opportunities, not hazards. I am looking for bullish patterns and setups, and ignoring bearish patterns and setups.
Trailing with the Chandelier Exit
SPY broke out of its channel and exceeded the late October high. Medium-term, this was a fresh breakout that ended the falling channel correction. Long-term, this breakout signaled a continuation of the bigger uptrend. There is nothing bearish on this chart.
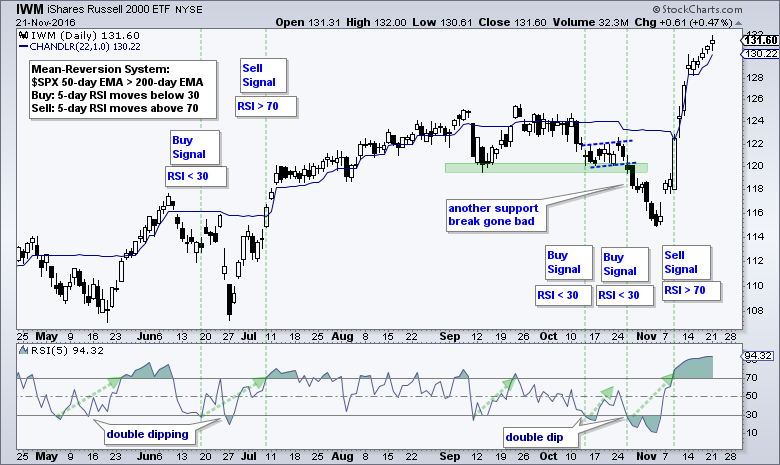
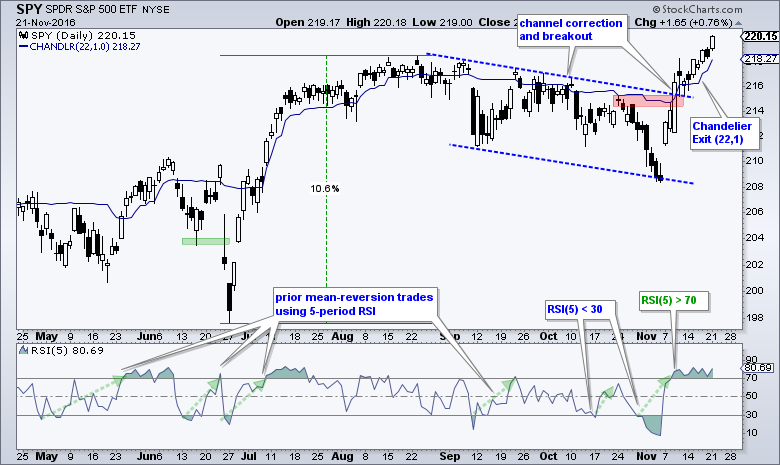 The mean-reversion strategy buys when RSI(5) moves below 30 and sells when RSI(5) moves above 70, which occurred on November 9th. In the November 10th commentary, I noted that traders wishing to capitalize on further gains could use the Chandelier Exit (22,2) as a trailing stop. With SPY and IWM extending even further and reaching 22-day highs, chartists can consider tightening this stop-loss by setting the Chandelier Exit to (22,1). This means the stop-loss would be 1 ATR value (22-period ATR) below the 22-day high, which is now yesterday's high. The chart below shows IWM with the same exit. I take my signals based on closing prices and use the next open for the actual trade. A close below the Chandelier Exit would trigger a stop-loss that would then be executed on the next open. Note that I will have a tutorial on the Chandelier Exit in today's webinar (22-November at 1PM ET).
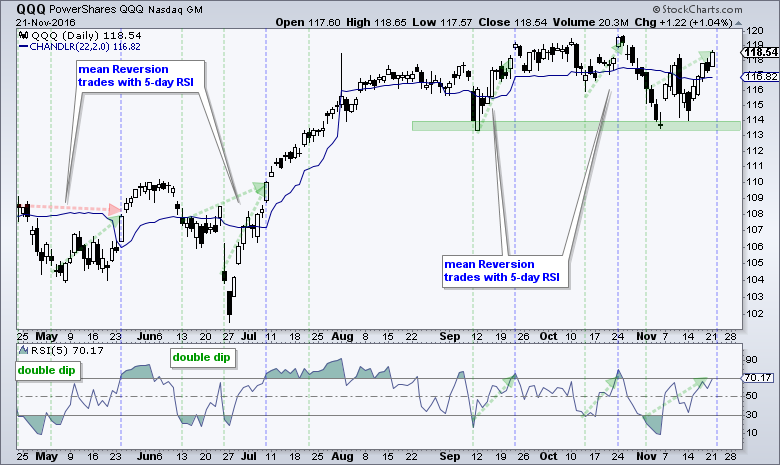
QQQ Joins the Overbought Ranks
RSI(5) moved above 70 for QQQ on Monday and this triggers a stop-loss or the setting of a trailing stop-loss. We cannot use Chandelier (22,1) for QQQ because the 22-day high is in late October and above the high for the current move (yesterday's high). Chartists looking for a trailing stop would have to use the Chandelier (22,2) and then tighten it to (22,1) if QQQ hits 120 on this move.
Finance, Industrials and Energy Lead New High List
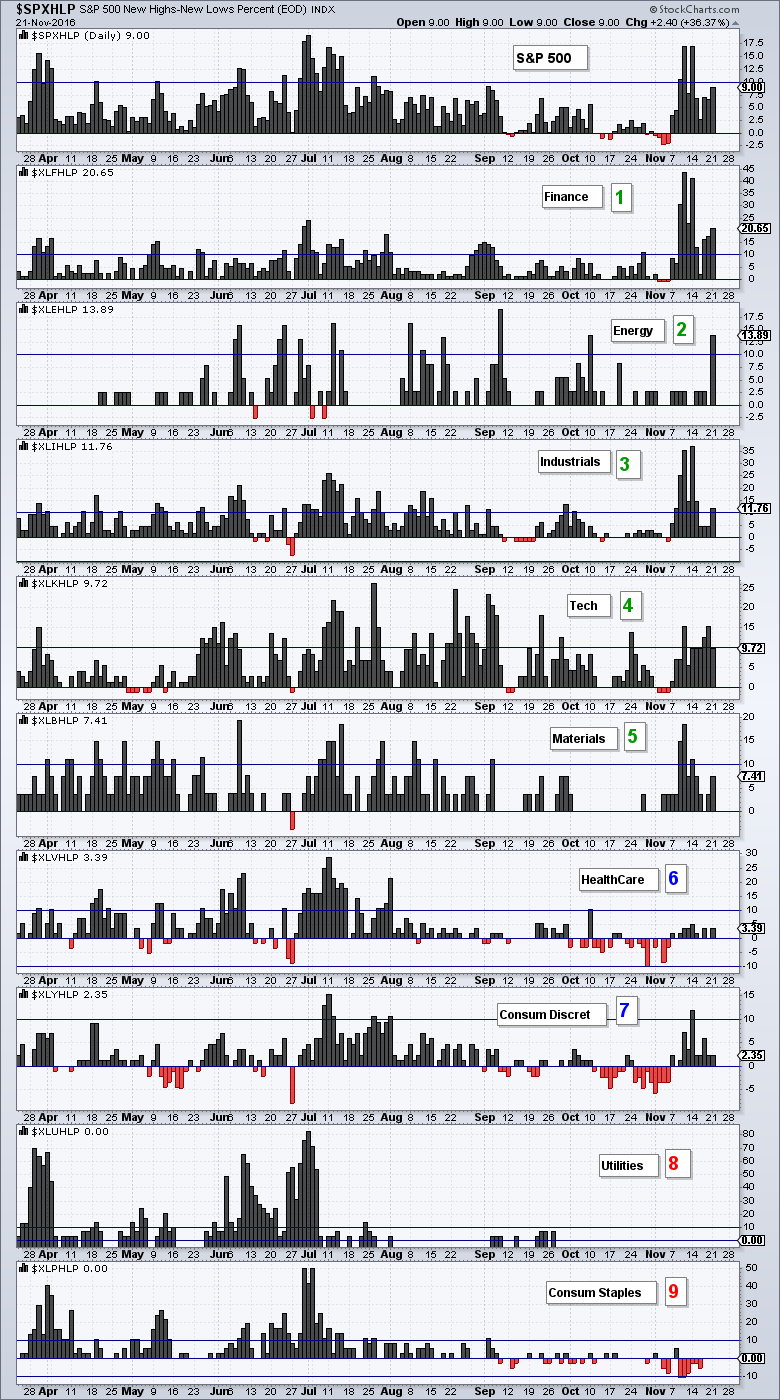
The next chart shows High-Low Percent for the S&P 500 and the nine sectors. High-Low Percent equals new highs less new lows divided by total issues. It is net new highs as a percentage of the total stocks in each group. The table is ranked by yesterday's High-Low Percent value. Finance, energy and industrials were the leaders yesterday. Notice that Energy High-Low% ($XLEHLP) surged to +13.89%. Tech and materials are also strong, which is why they have green numbers. Healthcare and consumer discretionary are not as strong and have blue numbers. Consumer staples and utilities are weak and have red numbers. Elsewhere, note that technology, industrials and energy are leading the %Above 200-day EMA category. More than 85% of the stocks in these three sectors are above their 200-day EMA.
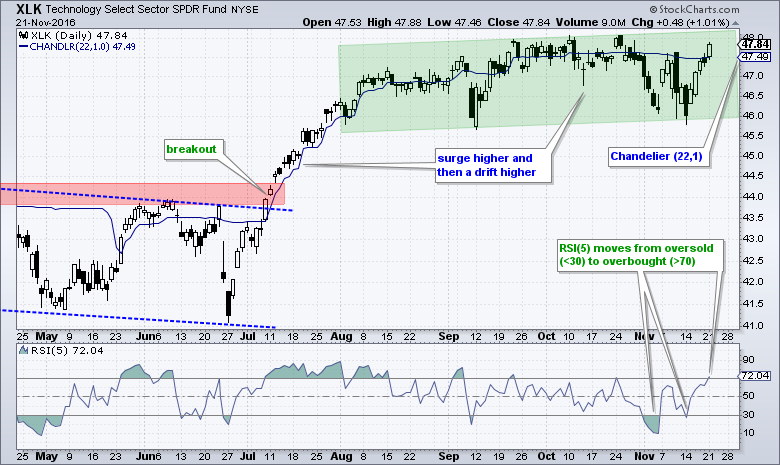
XLK Becomes Overbought
RSI(5) triggered two entry setups in the Technology SPDR (XLK) by moving below 30 twice. RSI moved above 70 on Monday to trigger an exit. Chartists wishing to trail a stop-loss now can use Chandelier (22,1).
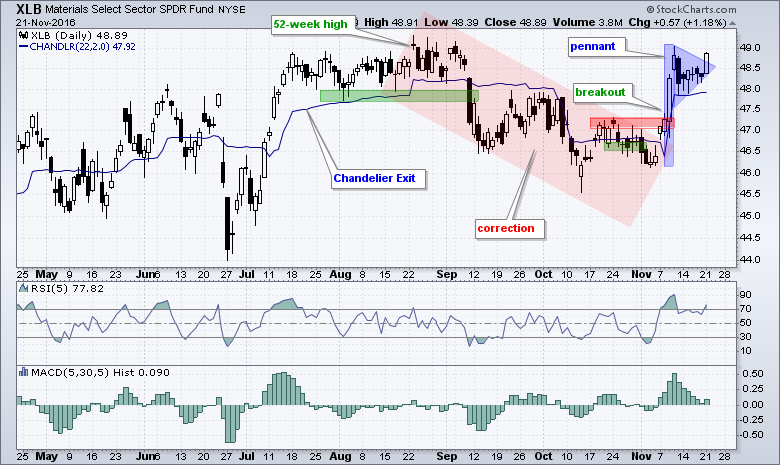
XLB Breaks out of Pennant
The Materials SPDR (XLB) surged on Monday and broke pennant resistance. The Chandelier (22,2) marks a potential stop-loss on a close below 47.92. Note that the settings for the Chandelier Exit are subjective and this means the choice is yours! Try different settings and see what works for your trading style or plan.
XLV Corrects after Island Reversal
As noted before, I don't use volume or volume-based very often for ETFs and the broad market indexes. The exception is that I sometimes use volume to identify capitulation and a buying thrust. The HealthCare SPDR (XLV) fell with five days of high volume and bottomed on November 3rd with the highest downside volume since June 24th. Note that XLV bottomed on June 27th with another big day of downside volume. Sharp declines on high volume suggest capitulation that can lead to a reversal. XLV was a falling knife in late June and early November, but the knife bounced both times and high volume selling pressure led to a "V" reversal.
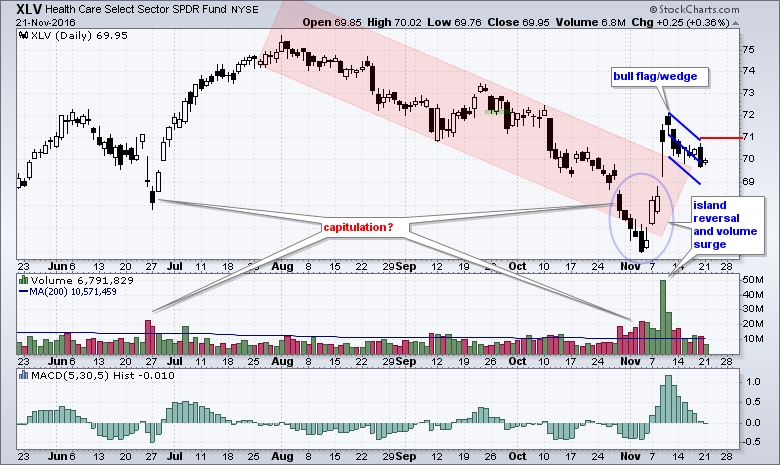 XLV formed an island reversal from late October to mid November and broke out of its pseudo channel (red). The ETF is at an interesting juncture because it pulled back with a falling flag/wedge. Note that I am using a Raff Regression Channel to define this pullback. A breakout at 71 would reverse the fall and signal a continuation higher. The indicator window shows the MACD Histogram (5,30,5) in negative territory and it would not take much to turn it positive again. I will cover XBI, IBB and several stocks from the healthcare sector in today's webinar (22-November at 1PM ET).
REM Breaks Continuation Pattern
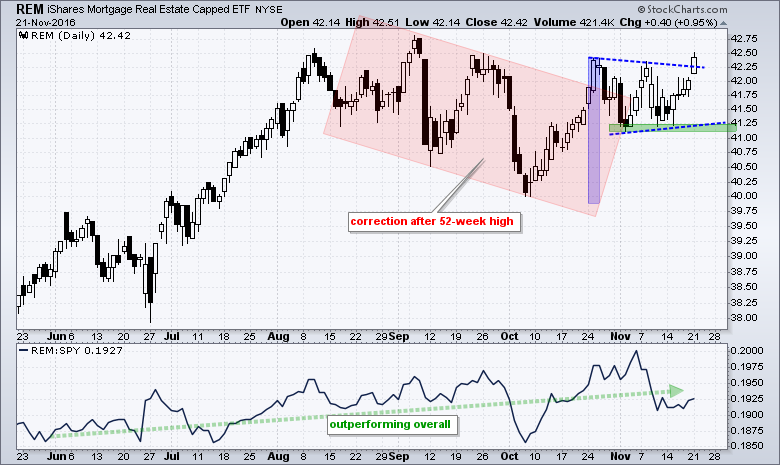
The Mortgage REIT ETF (REM) is not acting like a typical REIT because it is breaking out and re-asserting its uptrend. The ETF raced to 52-week highs in July-August and then corrected in September-October. REM broke out of the correction with a surge in late October and then formed a triangle, which is a continuation pattern. The ETF then broke triangle resistance with a surge above 42.25 on Monday.
 ******************************************************
Measuring Risk On-Risk Off - Using charts to quantify stock, economic and credit risk.
PPO Trading Strategy - How to use 3 PPOs to develop a trend-reversion trading strategy.
Long-term Trend Indicators - Using the PPO, EMA Slope and CCI to determine the trend.
ETF Master ChartPack - 300+ ETFs organized in a Master ChartList and in individual groups.
Follow me on Twitter @arthurhill - Keep up with my 140 character commentaries.
****************************************
Thanks for tuning in and have a good day!
--Arthur Hill CMT
Plan your Trade and Trade your Plan
*****************************************


