Small-caps, Finance and Industrials Lead (sector PerfChart) .... The Overbought Progression (IWM, SPY, QQQ) .... Biotechs Recover to Keep Pullback Patterns in Play (XBI, IBB, XLV) .... Six of Nine Sectors with Active Golden Crosses .... New High Parade Shows Broad Strength (sector and industry group ETFs) .... ChartList Update (CHKP, INVN, RHT, SQ, AMGN, BMY, GILD, MRK, PFE) .... //// ....
Small-caps, Finance and Industrials Lead
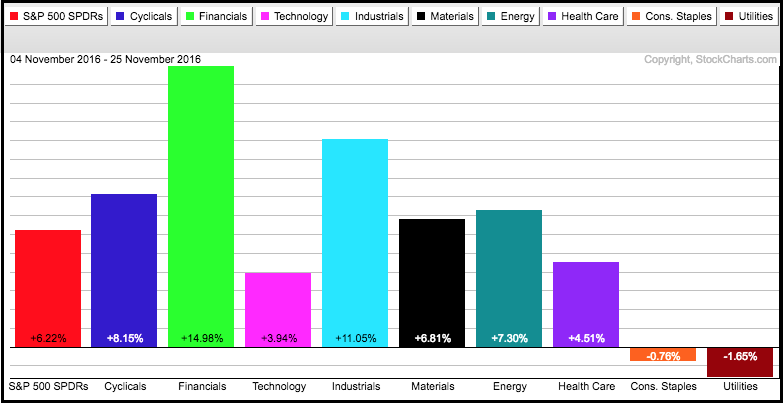
Stocks surged the last three weeks with the S&P 500 gaining around 6% and the Russell 2000 gaining around 15%. Small-caps are whipping up on large-caps. Seven of the nine sector SPDRs advanced with the Finance SPDR (XLF) and Industrials SPDR (XLI) leading the charge (up ~15% and 11%, respectively). The Utilities SPDR (XLU) and the Consumer Staples SPDR (XLP) are the only two sectors showing losses since the surge began (November 7th). Small-cap leadership and broad sector strength is bullish long-term, but the market is short-term overbought and ripe for some sort of rest.
The Overbought Progression
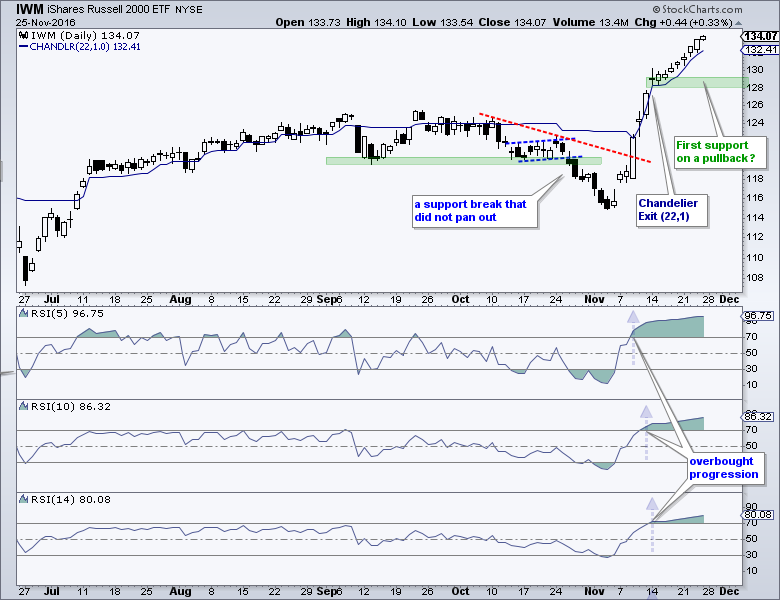
Lots of traders and investors are looking for a pullback. However, the pullback crowd has been waiting since mid November because the major index ETFs became overbought two weeks ago. The chart below shows the Russell 2000 iShares (IWM) with 5-day, 10-day and 14-day RSI to illustrate the overbought progression. 5-day RSI became overbought first with a move above 70 on 9-Nov, 10-day RSI followed with a move above 70 on 11-Nov and 14-day RSI became overbought on 14-Nov. The ETF is up 3.7% since 14-day RSI became "overbought" and remains "overbought". Clearly, overbought is not as clear-cut as it seems.
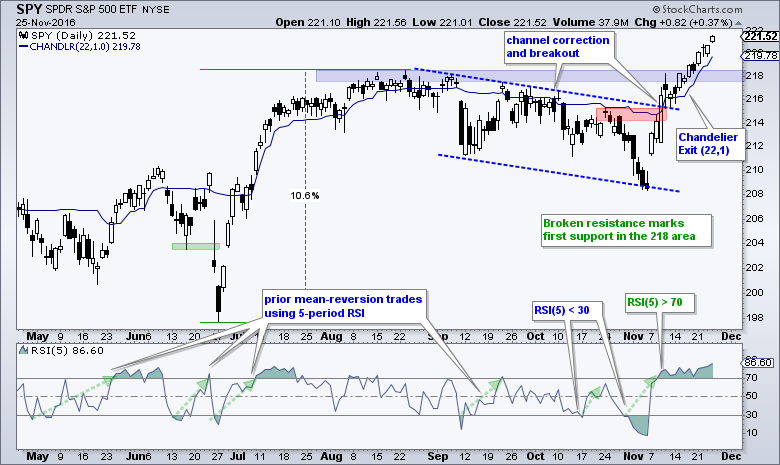
Identifying overbought conditions is the easy part. It is much harder to time a pullback, especially when the bigger trend is up and a buying binge is underway. At this point I am not interested in bearish setups, bearish signals or trying to make money on a pullback. Instead, I would simply trail stop-losses on short-term positions using a Chandelier Exit and hold existing long-term positions. A pullback, when and if it does occur, will provide the next bullish setup or signal. Whatever you do, make sure to plan your trade first and then trade your plan! Here is a recent article on finding pullbacks and upturns within a bigger uptrend. The chart below shows SPY with first support marked in the 218 area.
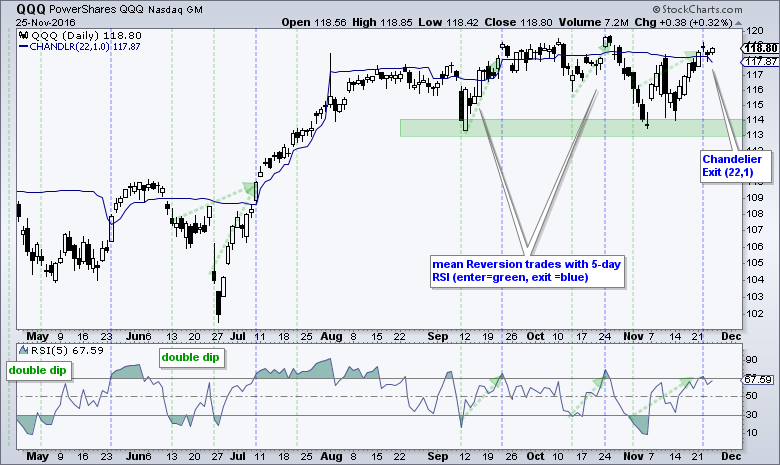
QQQ continues to underperform IWM and SPY, but the overall trend remains up. The ETF surged from late June to mid August and then moved into a trading range. Some may see a top forming, but it is not a top as long as the 113-114 support zone holds. Keep in mind that the ETF hit a 52-week high in late October and is still very close to this high. For short-term positions, I tightened the Chandelier Exit by changing the parameters from (22,2) to (22,1).
These charts and others are included in Art's Chart ChartList.
Biotechs Recover to Keep Pullback Patterns in Play
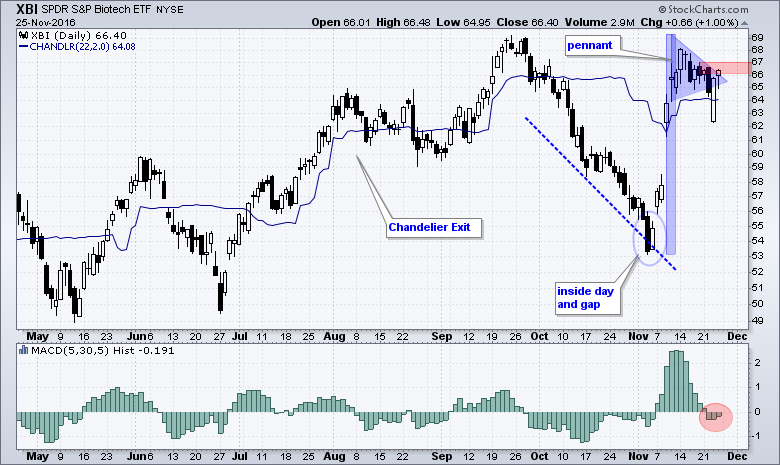
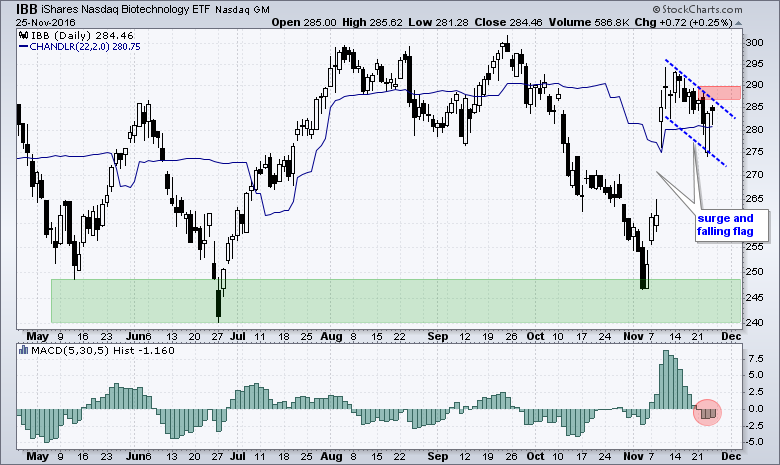
I featured the biotech ETFs on Tuesday and they obliged with a sharp decline that day and a big gap down on Wednesday morning. Despite a weak open on Wednesday, both closed strong and edged higher on Friday (shortened day). The chart below shows the Biotech SPDR (XBI) with the original pennant formation and the MACD Histogram. Even though the pennant does not fit, I still think price action reflects a surge and a pullback. The pullback remains in force because the MACD Histogram is still negative. A price break above 67 and a histogram move above zero would be short-term bullish. This would suggest that the pullback is ending and the prior surge is set to continue. Chartists could then use the Chandelier Exit to set a trailing stop. The second chart shows the Biotech iShares (IBB) with a newly drawn flag and resistance marked at 290.
Six of Nine Sectors with Active Golden Crosses
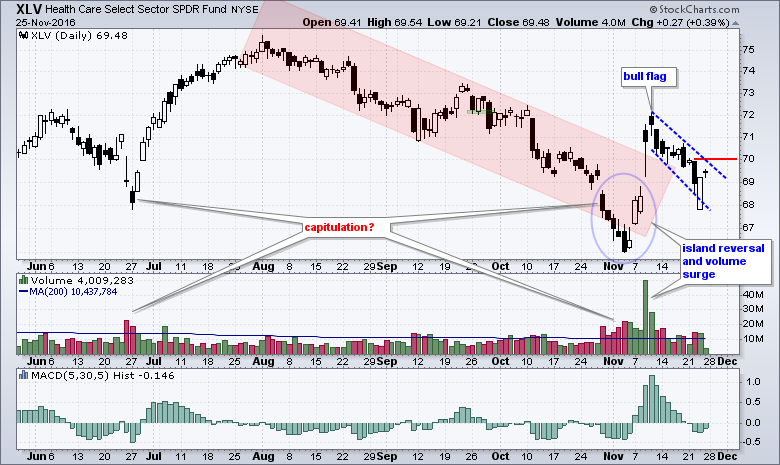
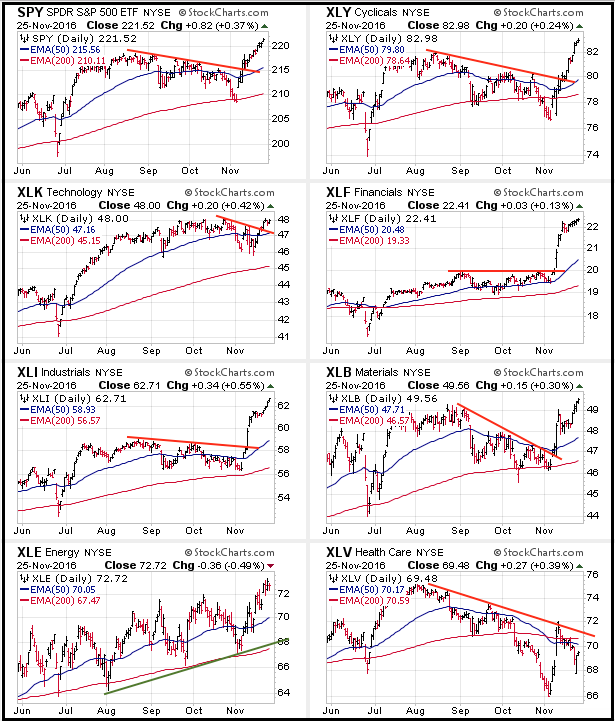
The next chart shows CandleGlance charts for SPY and seven sector SPDRs (sans XLP and XLU). The 50-day EMA is above the 200-day EMA for SPY and six of these sectors, which means they have active golden crosses. Also notice that these are six month charts and these golden crosses have been active for over six months. The HealthCare SPDR (XLV) is the only sector with its 50-day EMA below its 200-day EMA (on this chart). The 50-day EMA, however, is still close to the 200-day EMA and it would not take much to trigger a bullish moving average crossover.
New High Parade Reflects Broad Strength
The table below shows the sector ETFs that hit new highs last week. There are nine sector SPDRs (not counting XLRE), nine equal-weight sector ETFs and none small-caps sector ETFs. All told, 19 of the 27 sector ETFs hit new 52-week highs last week. This means that 70% of the sector ETFs hit new highs.
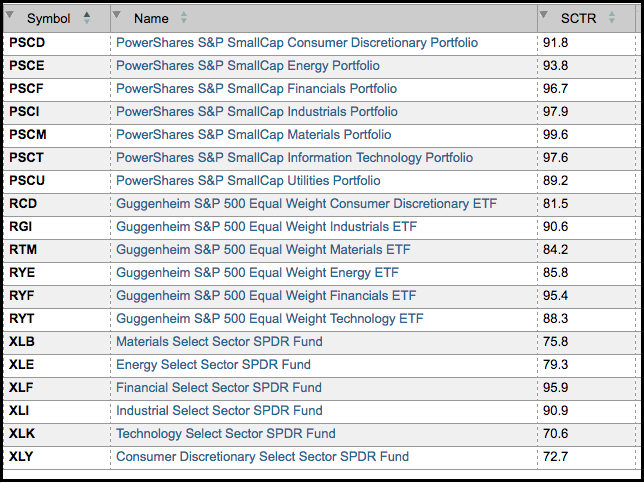
The next list shows four broad-based index ETFs hitting new highs and a list of industry group ETFs hitting new highs. I grouped these by their sector and we can see that the finance sector is well represented with five industry group ETFs hitting new highs. Again, this list is broad-based and supports the bull market environment.
- S&P 500 SPDR (SPY)
- S&P MidCap SPDR (MDY)
- S&P SmallCap iShares (IJR)
- Russell 2000 iShares (IWM)
- Broker-Dealer iShares (IAI)
- Bank SPDR (KBE)
- Insurance SPDR (KIE)
- Regional Bank SPDR (KRE)
- Mortgage REIT ETF (REM)
- Transport iShares (IYT)
- Airline ETF (JETS)
- Aerospace & Defense ETF (PPA)
- Retail SPDR (XRT)
- Semiconductor SPDR (XSD)
- Cloud Computing ETF (SKYY)
- Copper Miners ETF (COPX)
- Steel ETF (SLX) Metals & Mining SPDR (XME)
- Oil & Gas E&P SPDR (XOP)

******************************************************
Spotting Pullbacks and Upturns within an Uptrend using RSI and MACD Histogram.
Defining Bull and Bear Market Environments with Breadth Indicators (plus video).
Backtesting Different Moving Average Pairs with SPY, QQQ and IWM.
ETF Master ChartPack - 300+ ETFs organized in a Master ChartList and in individual groups.
Follow me on Twitter @arthurhill - Keep up with my 140 character commentaries.
****************************************
Thanks for tuning in and have a good day!
--Arthur Hill CMT
Plan your Trade and Trade your Plan
*****************************************


