Another Seven Day Decline .... Channel Defines Correction in SPY .... Revisiting the Mean-Reversion Strategy .... Is Mean-Reversion Broken? .... Strike Two for the S&P 500 .... Benchmark Lows to Find Chart Leaders and Laggards .... Revisiting the ETF Scan .... //// ....
The S&P 500 closed down seven days in a row and this is the longest losing streak since November 2011 when the S&P 500 fell around 8% on seven days. Note that the index then bottomed on the seventh day and advanced over 20%. This is just one data point so I am not insinuating that the market will bottom now. However, I will note that the market is short-term oversold and the long-term trend is still up. Yes, the market was short-term oversold three days ago and became even more oversold. Even so, I still view this as a short-term issue and have yet to see enough selling pressure to affect my long-term indicators.
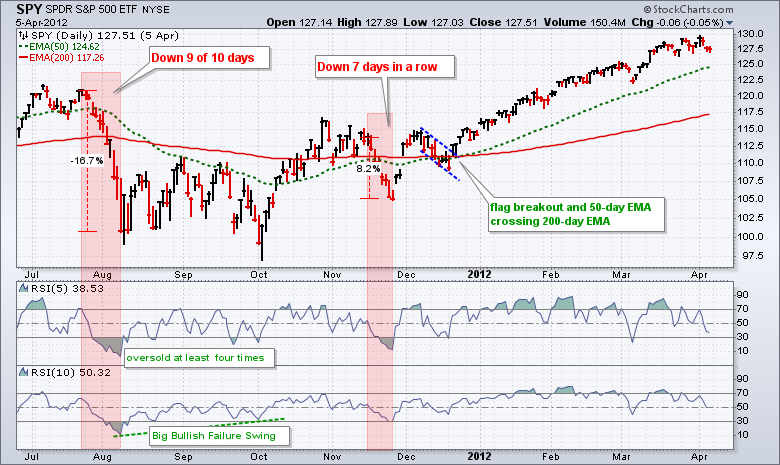
The chart above shows SPY from July 2011 until March 2012. The first red area marks the European sovereign debt crisis when SPY was down 9 of 10 days and fell over 15%. The second red area marks the prior 7 day decline when SPY fell around 8%. One of the better signals I have ever seen occurred in December 2012 when SPY broke flag resistance and the 50-day EMA crossed above the 200-day EMA. The indicator windows show 5 and 10 day RSI. Notice how 5-day RSI becomes oversold a lot more often than 10-day RSI. Chartists using 5-day RSI will get more signals, while chartists using 10-day RSI will do more waiting. And finally, there was a BIG bullish failure swing from August to October as 10-day RSI held above 30 when SPY moved below its August low. The subsequent move above 50 confirmed this setup.
Channel Defines Correction in SPY
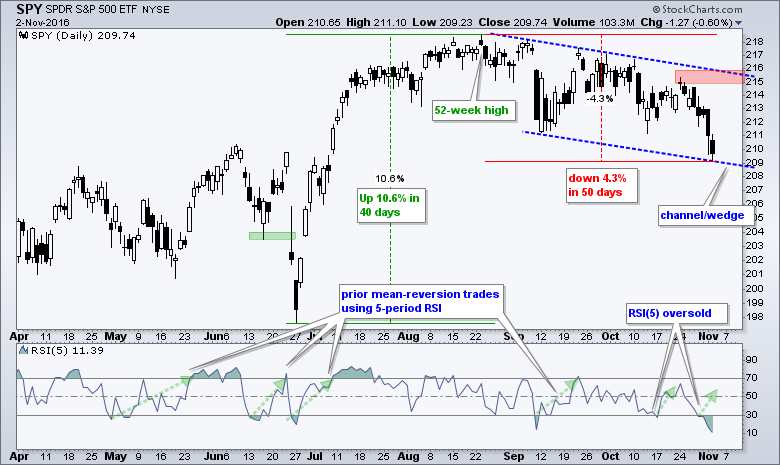
SPY broke below its September low, but this decline is still not much more than a pullback. SPY hit a new high with a 10.6% advance in 40 days and then fell around 4% the last 50 days. I thought the stock market took the stairs up and the elevator down, but this is clearly not always the case. From a broad market perspective, this decline ~4% seems a lot worse that it actually is. A lower high and lower low formed during this decline and I am now drawing a falling channel. A break above 216 is needed to reverse this 50-day slide.
Revisiting the Mean-Reversion Strategy
Now let's review the mean-reversion trade for SPY. It is a long-only short-term system that only trades when the 50-day EMA is above the 200-day EMA. The system buys when RSI moves below 30 and sells when RSI moves above 70. The system is profitable with a high percentage of winning trades, but there are losing trades and losing streaks. I never know which trade will turn into a winner and which will result in a loss.
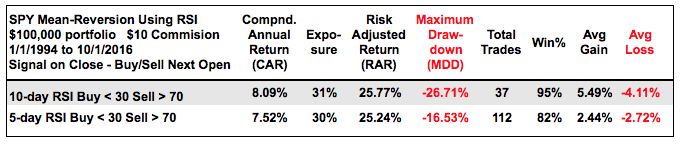
The table above summarizes the results from 1/1/1994 to 10/1/2016. First notice that the system was exposed to the market just 30% of the time. It is clearly not a full-time fully-invested system. Second, notice that there were 37 total trades for 10-day RSI and 111 total trades for 5-day RSI. 5-day RSI trades have a much shorter timeframe and smaller gains/losses. Third, notice that the drawdown for 5-day RSI is much lower. Theses results are based taking every trade during the timeframe and sticking with the system. There will be ups and downs, but hopefully the ups will continue to outpace the downs. There are no guarantees.
Is Mean-Reversion Broken?
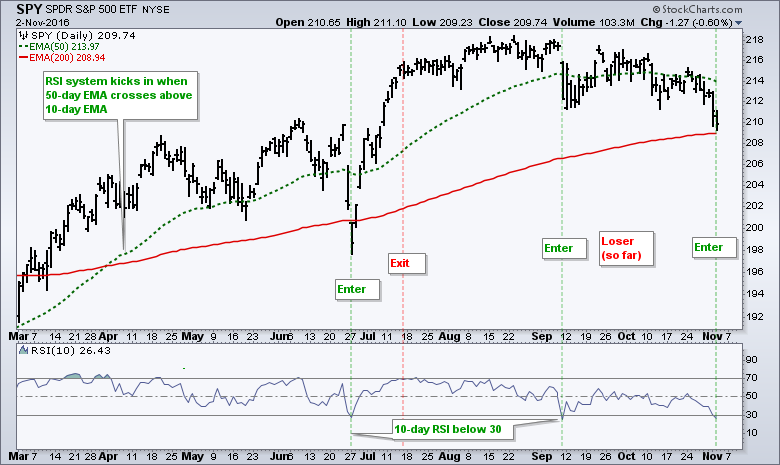
The last two trades for 5-day RSI are losing right now and the current trade for 10-day RSI is losing. A couple losers do not mean the system is broken. Truth is, I never know which trades will turn into winners and which will result in losses. All I know is that the system will stop trading when the 50-day EMA crosses below the 200-day EMA and that has yet to happen. The chart below shows SPY with 10-day RSI. There was a great trade with the Brexit low in late June. RSI triggered another signal in early September, but has yet to cross above 70 for an exit. It has since moved back below 30 for another signal. Thus, the early September trade is still open, but in the loss column. The current signal activated today and will remain until RSI moves above 70 for an exit.
Strike Two for the S&P 500
The S&P 500 closed below its 200-day EMA for the first time since Brexit and this marks strike two for the bulls. Notice that the bulls also had two strikes in late June when the index broke the May low and closed below the 200-day EMA. This two strike count led to one of the best mean-reversion trades of the year. This is not a prediction, but I am saying that we should not count da bulls out just yet because the fat moving average has yet to sing. Strike three would be the 50-day EMA moving below the 200-day EMA. Note that the S&P MidCap 400 and S&P Small-Cap 600 are below their 200-day EMAs as well, but their 50-day EMAs remain above their 200-day EMAs. The red areas mark the first resistance levels to watch.
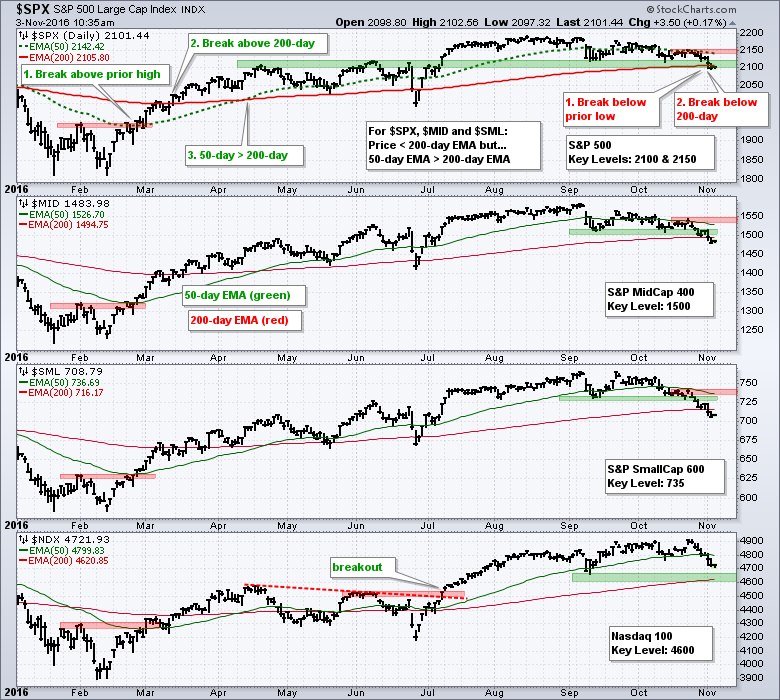
Benchmark Lows to Find Chart Leaders and Laggards
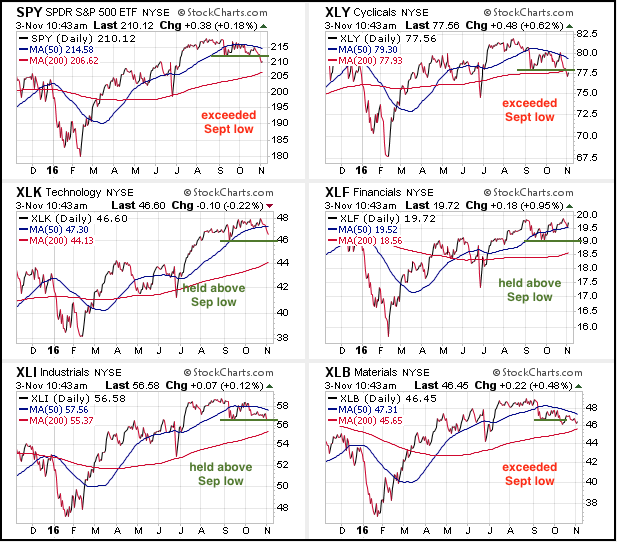
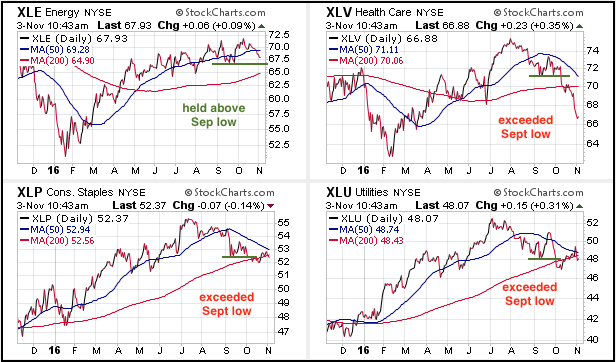
The September lows marked a benchmark low that we can use to compare charts. These are key lows or troughs that are present on almost all charts. Indexes, ETFs and stocks that held above this low show relative "chart" strength. Indexes, ETFs and stocks exceeded this low show relative "chart" weakness. Four sector SPDRs did not break their September lows (XLK, XLE, XLF and XLI). Note that XLI is right at this low. These four sectors account for around 60% of the S&P 500. Five sector SPDRs exceeded this low (XLY, XLB, XLV, XLP, XLU). Even though five is greater than four, these four sectors account for around 40% of the S&P 500. Thus, 60% of the sector weightings held this benchmark low and these four are keeping the market afloat.
Here is a list of industry group ETFs and their relationship with the September low. The first group exceeded their September low and show relative "chart" weakness. The second group held above their September low and show relative "chart" strength.
Exceeded Sept low: ITB, XRT, HACK, IYR, GDX, FCG, XOP, XBI, IBB, IYZ
Held above September low: SKYY, FDN, IGN, XSD, IGV, KBE, IAI, VFH, KIE, KRE, XME, KOL, XES
Revisiting the ETF Scan
There was some confusion with the ETF scan for trend, momentum and relative performance so I am reposting it. You can read more about this scan and my ETF ChartPack here. The first line of the scan refers to one of MY ChartLists that has around 300 ETFs. This scan will not work the same for your because MY ChartList number 251 is not the same as YOUR ChartList number 251. There is a work around. Instead, you can just select the ETF universe as the group and use a minimum volume level to weed out ETFs with low liquidity. Here is the scan code:
[group is ETFNOUI] // symbol universe is ETF (NO inverse or leverage)
AND [SMA(250,volume) > 200000 ] // average volume minimum
AND [Weekly EMA(10,close) > Weekly EMA(40,close)] // long-term uptrend
AND [Weekly ROC(26) > 5] // six month ROC is above 5%
AND [SCTR > 70] // SCTR is above 70 (top 30%)
******************************************************
Measuring Risk On-Risk Off - Using charts to quantify stock, economic and credit risk.
PPO Trading Strategy - How to use 3 PPOs to develop a trend-reversion trading strategy.
Long-term Trend Indicators - Using the PPO, EMA Slope and CCI to determine the trend.
ETF Master ChartPack - 300+ ETFs organized in a Master ChartList and in individual groups.
Follow me on Twitter @arthurhill - Keep up with my 140 character commentaries.
****************************************
Thanks for tuning in and have a good day!
--Arthur Hill CMT
Plan your Trade and Trade your Plan
*****************************************


