SystemTrader .... Why Focus on the S&P 500? .... Moving Averages Love Whipsaws .... Adding a Smooth Operator .... Backtesting Moving Average Performance .... Scaling into Positions with Moving Averages .... Backing testing an Array of EMAs .... Conclusions.... //// ....
Why Focus on the S&P 500?
The S&P 500 is the most widely followed benchmark for US stocks and it represents around 80% of the total investable universe of US equities. There are lots of other indexes, but nothing compares to the S&P 500. We can point to small-caps (Russell 2000) and large-cap techs (Nasdaq 100) as better risk proxies, but major market signals belong to the S&P 500 because it IS the market. The Russell 2000 represents just 10% of the entire US equity market and the Nasdaq 100 is not a broad enough index to be considered representative of the stock market as whole. The S&P 500 covers all sectors and includes 118 stocks from the Nasdaq and 382 stocks from NYSE. A major market signal is a shift from a bull market to a bear market. Today I will look at some different moving average pairs and see if they can shed light on the bull/bear debate.
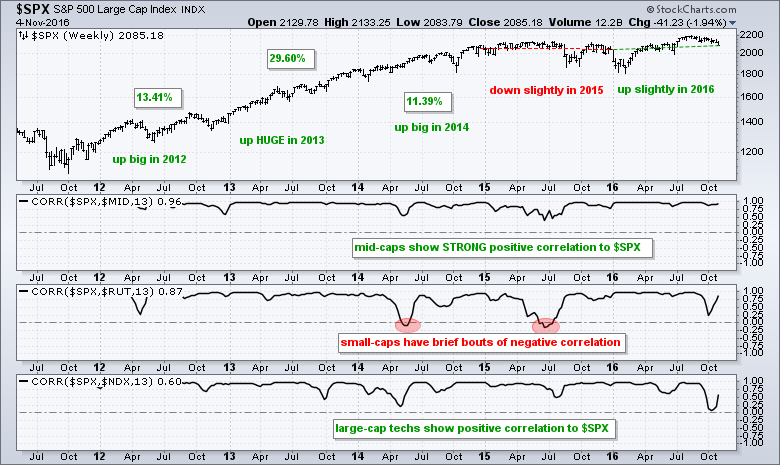
The chart above shows weekly bars for the S&P 500 since 2011. Even though the index is pretty much flat over the last two years, notice that the index was up big in 2012, up HUGE in 2013 and up big in 2014. A year or two of consolidation is not that abnormal. Despite two years of flat trading, the average return over the last five years is still over 10%. The indicator windows show the Correlation Coefficients with the S&P MidCap 400, Russell 2000 and Nasdaq 100. Mid-caps have the strongest positive correlation to the S&P 500. The stronger the positive correlation, the more these two move in the same direction. Small-caps are positively correlated for the most part, but there are occasional bouts of negative correlation (red ovals). These bouts did not Large-cap techs show a pretty strong positive correlation.
Moving Averages Love Whipsaws
I wrote about SPY moving below its 200-day EMA on Thursday and would like to expand on moving averages as analysis tools. First, I do not view moving averages as support or resistance levels. They are simply yardsticks we can use to help identify the trend. It is +1 for the bulls when above the moving average and +1 for the bears when below. Second, price can move above or below a moving average several times and whipsaws are commonplace. I would, therefore, suggest using a short moving average to smooth closing prices and reduce whipsaws.
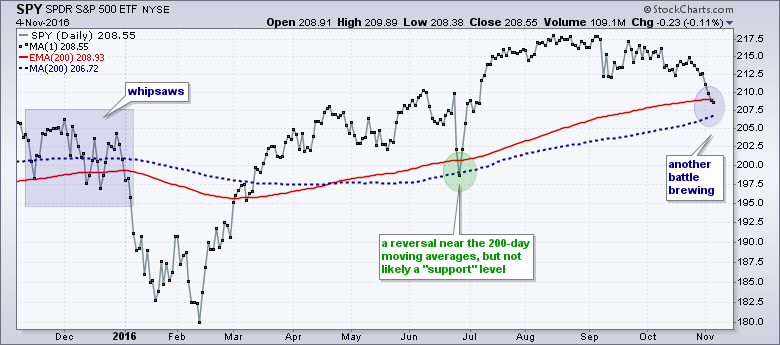
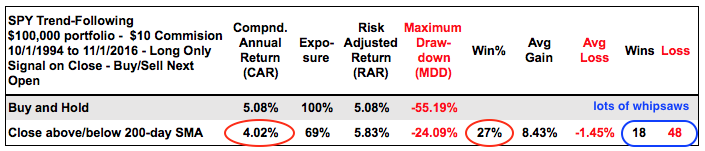
The chart above shows SPY with the 200-day exponential moving average (EMA) in red and 200-day simple moving average (SMA) in red. Which one is better? I will show some test results further down, but I would give a very slight edge to exponential moving averages. Over the past year, SPY has crossed these moving averages around 10 times. There were lots of signals and quite a few whipsaws, especially in late 2015. The table below shows performance for SPY using a cross above/below the 200-day SMA from October 1999 until October 2016. The Compound Annual Return was just 4.02% and the winning percentage was just 27%. This means a cross of the 200-day generated a losing trade 73% of the time. Take these crosses with a grain of salt. The Performance Metrics used in this table are explained in this article.
Adding a Smooth Operator
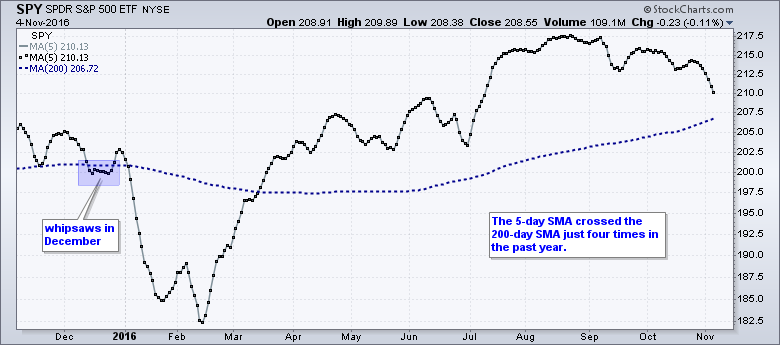
Chartists can greatly reduce whipsaws and false signals by smoothing closing prices with a 5-day SMA. We can never fully eliminate whipsaws, but we can make our life easier by reducing them. The chart below shows the 5-day SMA with a gray line and black dots. The 200-day SMA is solid blue. There were whipsaws in December, but the 5-day SMA crossed the 200-day SMA just four times in the past year. In addition, the 5-day SMA remains well above the 200-day SMA right now.
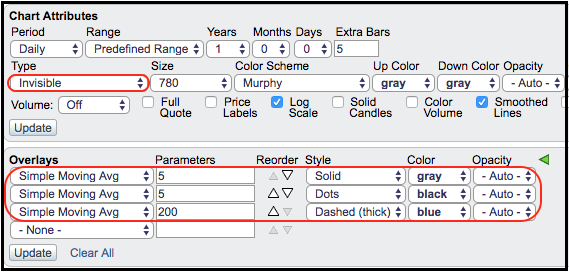
Like this ChartStyle? Members can click on this chart to open it in your SharpCharts workbench. You can then see the settings below the chart and save it to a ChartList. The image below shows the settings. Basically, I choose invisible for the price plot and adding the 5-day SMA twice. The first plot is a solid gray line and the second shows black dots.
Backtesting Moving Average Performance
The two most popular moving average periods are 50 days and 200 days. I would also venture a guess that simple moving averages are used more than exponential moving averages. Taken together, the S&P 500 is the most widely followed index, and the 50-day and 200-day SMAs are the most widely used moving averages. It seems that the S&P 500 with these two moving averages is important just because so many pundits follow this combination. It kind of becomes a self-fulfilling prophecy. Let's look at some backtest result to see just how well this moving average pair works.
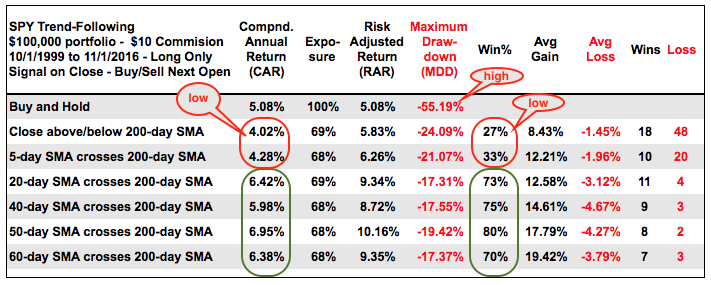
The table above shows backtest results using an array of moving average pairs. I even optimized for the best SMA pair and the 50/200 pair finished in the top 15% (out of a total of 300 moving average pairs). Since I know you are wondering, the 30-day/290-day SMA cross had the highest Compound Annual Return (7.97%). The table below shows the slower 200-day SMA with five different faster moving averages for reference. The returns were low when using the close and 5-day SMA for signals (~4%) , but improved dramatically with more smoothing. Returns ranged from 6% to 7% when using smoothing with 20-day, 40-day, 50-day and 60-day moving averages. Also notice that the Win% increased when using 20 days or longer for the faster moving average. And finally, notice that the classic 50-day/200-day SMA cross produced a Risk-adjusted Return of 10.16%, which was the highest of the group.
Scaling into Positions with Moving Averages
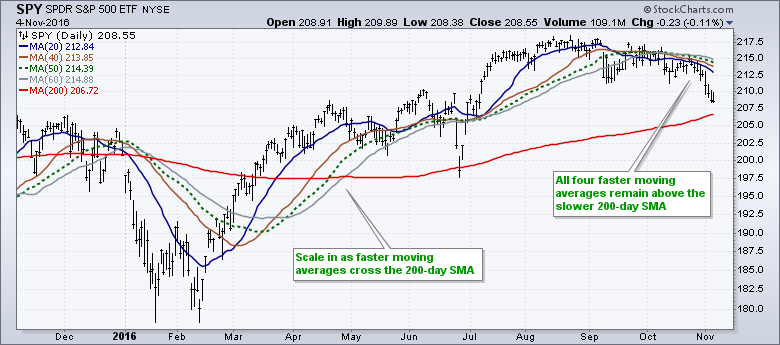
The chart below shows SPY with the four faster moving averages and the 200-day SMA. Investors could consider scaling into and out of positions as these moving averages are crossed. For example, buy a quarter of a position when the 20-day SMA crosses above the 200-day SMA and a quarter when the 40-day crosses and so on. Before leaving this chart, notice that all four moving averages are well above the 200-day SMA right now.
Backing testing an Array of EMAs
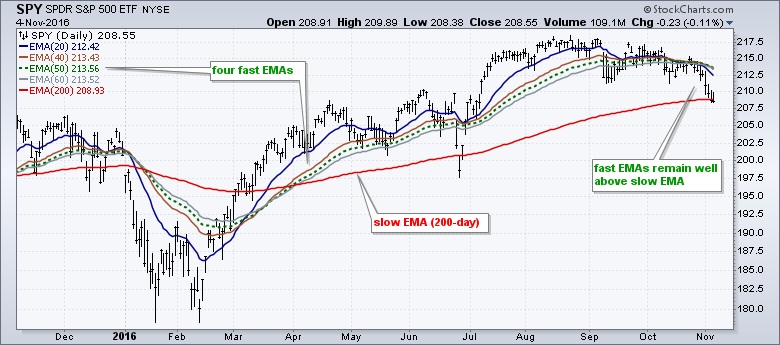
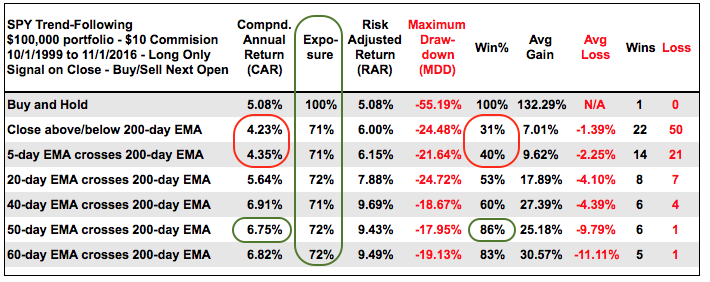
The next table shows backtest results using the 200-day EMA as the slow moving average and the same periods for the fast EMA. The results are not that much different. The returns are quite low when using the closing price and the 5-day EMA for signals, and the Win% is well below 50%. The returns exceed 6% when using the 40-day, 50-day and 60-day EMAs for signals. Notice that the Win% jumps above 80% for the 50-day and 60-day EMAs. Overall, I give a very slight edge to the 50-day/200-day cross because it has the highest Win%, the lowest drawdown and the second highest Risk-adjusted Return (9.43%).
Conclusions
Smoothing may increase lag, but it can reduce whipsaws and improve performance. This means it is better to be a little more of a tortoise than a hare when it comes to judging the long-term trend or broad market environment. The 200-day moving average is the staple for the slow moving average and chartists should use at least 20 days for the faster moving average. This much smoothing gives bull markets enough room to correct. The 50-day and 200-day moving averages may be the most overused, but this pair still performs well when it comes to the S&P 500. Note that this does not mean the 50-day and 200-day moving averages will perform good for other indexes, ETFs or stocks.
 ******************************************************
Related SystemTrader Articles
- Key Performance Metrics - Quantifying the Golden Cross for the S&P 500
- Testing the Golden Cross with $NDX and $RUT - Do Short Positions Add Value?
- Testing Two Short-Term Moving Average Systems - Do Trend Filters Add Value?
- Difference between SMAs and EMAs - %Above 200-day EMA to Measure Breadth
- ETF Master ChartPack - 300+ ETFs organized in Logical ChartLists.
- Follow me on Twitter @arthurhill - Keep up with my 140 character commentaries.
****************************************
Thanks for tuning in and have a good day!
--Arthur Hill CMT
Plan your Trade and Trade your Plan
*****************************************


