Finance, Tech and Industrials Show Chart Leadership .... Copper and Aluminum Go for Big Breakouts .... Using RSI Ranges to Define the Trend .... Gold Indicators are Bullish, but Price Breakdown Looms .... Rising 10-yr Yield is Negative to Gold .... Intermediate Trend Dominates 7-10 YR T-Bond ETF .... No Webinar this Week .... //// ....
Finance, Tech and Industrials Show Chart Leadership
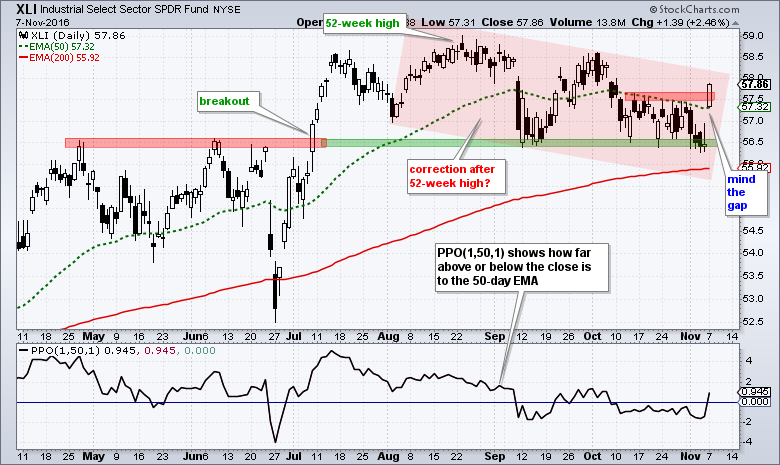
Chartists can measure relative "chart" strength for a group of ETFs or stocks by comparing price to a moving average using the PPO. Using the sector SPDRs as an example, note that five of the nine are above their 50-day EMAs and eight of the nine are above their 200-day EMAs. The HealthCare SPDR (XLV) is the only sector SPDR below its 200-day EMA and this means XLV has the weakest chart of the nine sector SPDRs. I did a little ranking to find out which sectors were the furthest above their 50-day EMA. Chartists can measure this by comparing the values for the Percentage Price Oscillator (1,50,1). Note that the Finance SPDR (XLF), Industrials SPDR (XLI) and Technology SPDR (XLK) have the highest PPOs. Using this measure, these are the strongest on the price chart. The chart below shows XLI ultimately holding support in the 56.5 area with a big gap and break above the mid October high. This is the first sign that the correction since August is ending and the bigger uptrend is resuming. The indicator window shows the PPO(1,50,1) at .945%, which means the close is around 1% above the 50-day EMA.
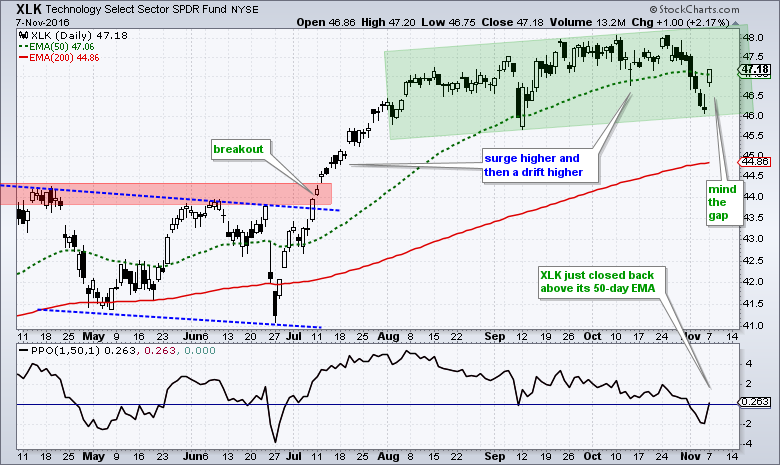
The next chart shows XLK gapping up and closing back above its 50-day EMA. As with XLI and a number of other ETFs, chartists should watch these gaps closely because these gaps are bullish as long as they hold. Failure to hold and a close below last week's lows would fill these gaps and argue for a re-assessment.
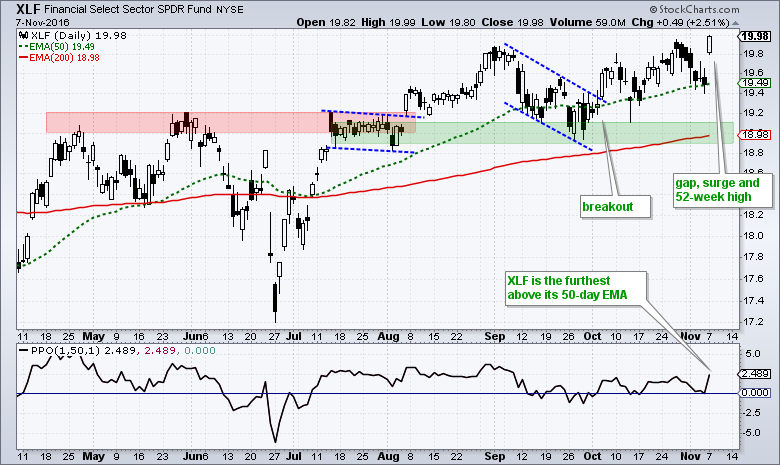
The next chart shows XLF gapping up and hitting a 52-week high on Monday. XLF is the only one of the nine sector SPDRs to hit a new high and it is the furthest above its 50-day EMA. XLF is in a clear uptrend and showing relative strength. These three sectors, XLI, XLF and XLK, account for around 45% of the S&P 500.
Copper and Aluminum Go for Big Breakouts
The Copper ETN (JJC) and the Aluminum ETN (JJU) are not the most liquid ETNs, but we can still use their price charts for analysis. Note that metals ETFs, such as the Gold SPDR (GLD) and Silver ETF (SLV), track the underlying commodity quite well on a long-term basis. Many energy ETNs, such as the Natural Gas ETN (UNG) and USO Oil Fund (USO), are NOT good trackers for the underlying asset on a long-term basis and should not be used for long-term analysis.
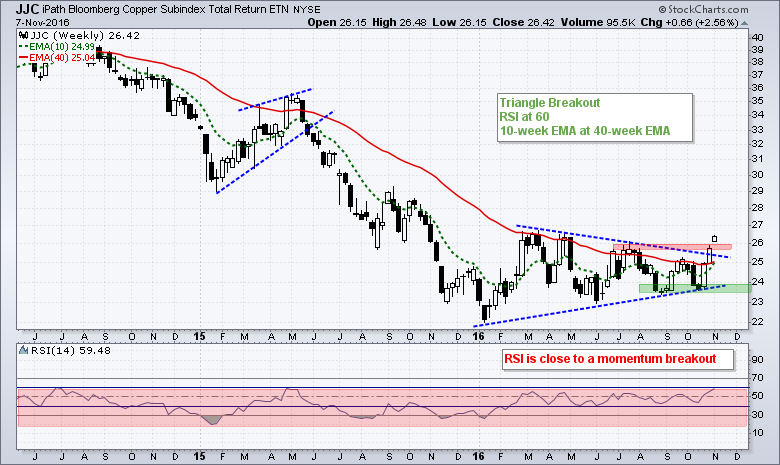
The charts below show JJC and JJU basing over the last nine to twelve months and breaking out with surges over the last two weeks. Note that both are up over 8% since mid October. The first chart shows JJC forming a big triangle from January to October and breaking out with the early November surge.
Using RSI Ranges to Define the Trend
The indicator window on the chart above shows 14-period RSI nearing 60 for the first time since April 2015. Chartists can use RSI breakouts and ranges to help identify the trend on this weekly chart. A move above 60 would trigger a momentum breakout and put RSI at its highest level in years. I would then consider RSI bullish as long as it stays in the 40 to 80 range. A subsequent break below 40 would signal a momentum breakdown and RSI would then be considered bearish as long as it remains in the 20 to 60 range. Chartists can use this RSI concept with other trend indicators for a "weight of the evidence" approach to trend identification. JJC broke triangle resistance and this is +1 for an uptrend. The next bullish steps would be the 10-week EMA crossing above the 40-week EMA and RSI crosses above 60.
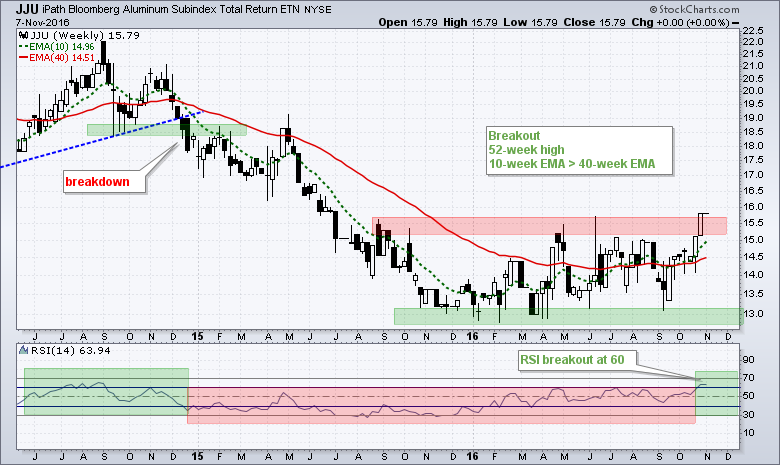
The next chart shows the Aluminum ETN moving sideways from August 2015 until October 2016. This long consolidation amounts to one big base with lots of support in the 13 area. I view this as a base because JJU is breaking out of its range and hitting a new high. Also notice that the 10-week EMA is above the 40-week EMA and RSI broke above 60. All three trend indications on this chart are bullish.
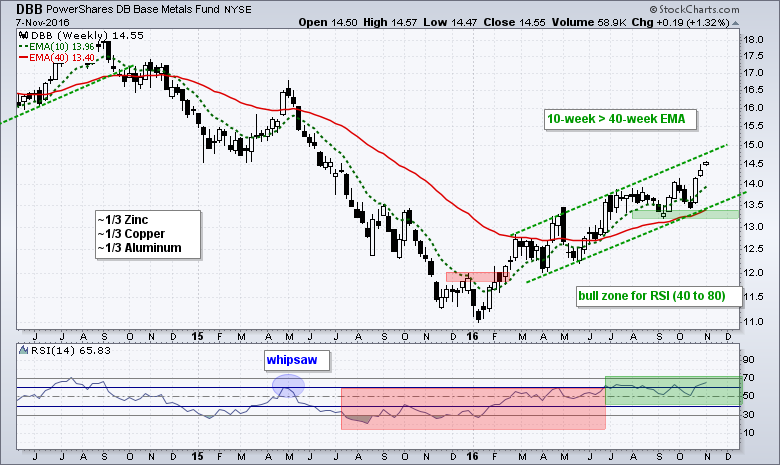
The next chart shows the Base Metals ETF (DBB) moving higher since January. Even though copper and aluminum were flat most of the year, DBB moved higher because zinc is up over 50%. Each metal accounts for around one third (~33%) of the DBB weighting, but zinc accounts for almost all of the gains this year. The Base Metals ETF could move even higher with a little help from copper and aluminum.
Gold Indicators are Bullish, but Breakdown Looms
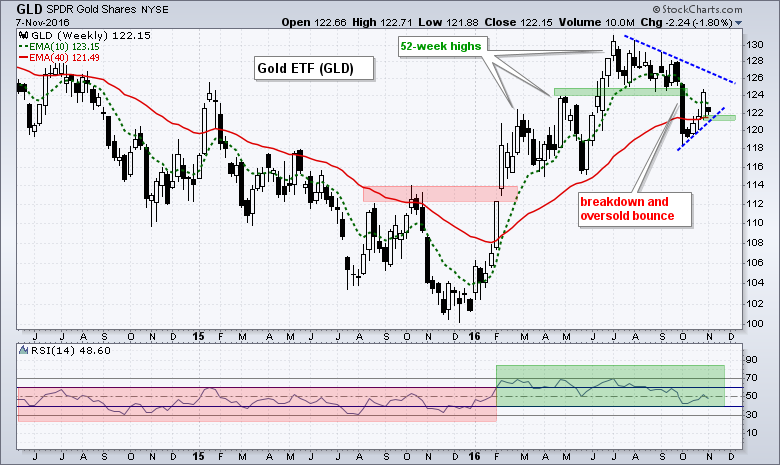
The long-term trend indicators remain net bullish for gold. The 10-week EMA is above the 40-week EMA and RSI remains in the bull zone (40 to 80). Despite these bullish indicators, I see a breakdown on the price chart and an oversold bounce the last few weeks. If this is indeed just an oversold bounce, a break below 121 would reverse this bounce and signal a continuation of the prior decline. Such a move would likely lead to a bigger trend reversal in gold.
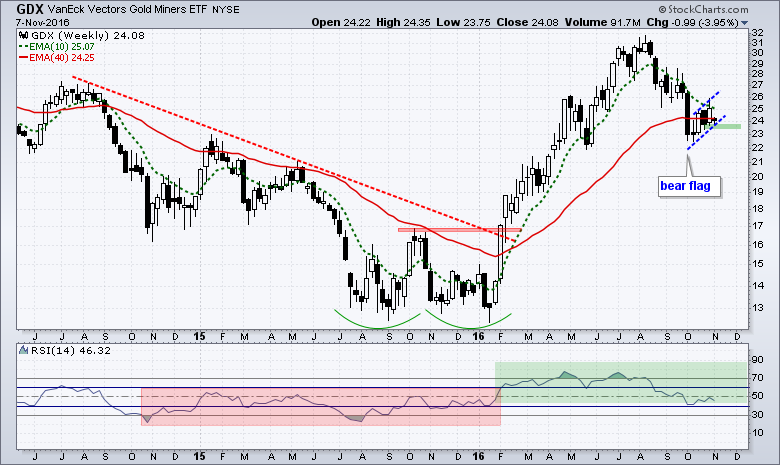
The Gold Miners ETF (GDX) is at a moment-of-truth after a 20% decline from its summer highs. The 10-week EMA remains above the 40-week EMA and RSI remains in its bull zone, but it would not take much more downside to turn these two indicators bearish. On the price chart, notice that a bear flag may be taking shape and a move below 23.5 would confirm this pattern.
Rising 10-yr Yield is Negative to Gold
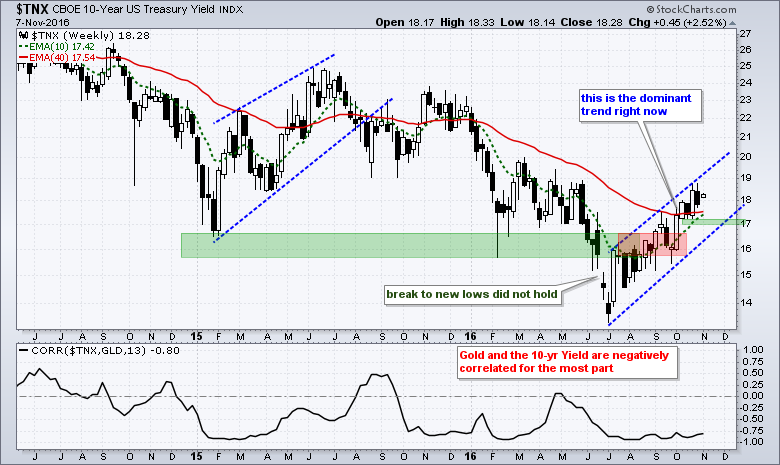
Gold is negatively correlated to the 10-yr T-Yield ($TNX) and the intermediate trend is up for the 10-yr Yield. A negative correlation means gold typically moves opposite the 10-yr yield and this means the uptrend in $TNX is negative for bullion. Notice that the 10-yr yield broke to new lows in June, but this breakdown did not hold as $TNX surged back above 17 (1.7%) in September. The trend since summer is clearly up and I think this is the dominant trend right now. I will mark support at 17 and re-evaluate if the 10-yr yield closes below this level.
Intermediate Trend Dominates 7-10 YR T-Bond ETF
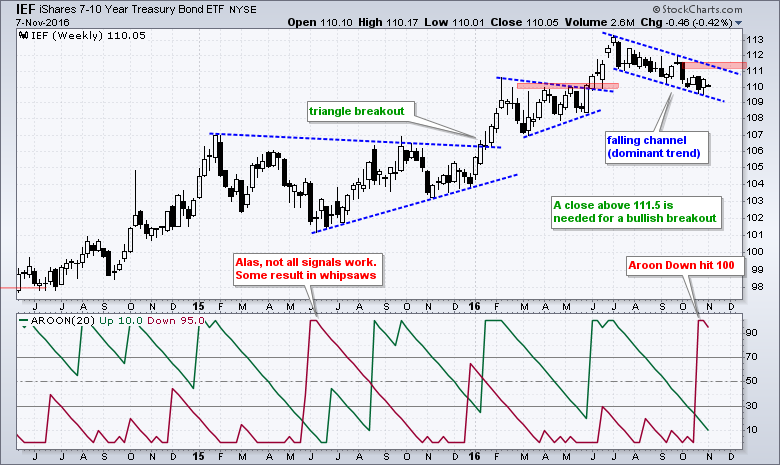
The next chart shows the 7-10 YR T-Bond ETF (IEF) in a downtrend since June and this is the dominant trend on this chart (IMHO - in my humble opinion). Even though one could argue that the long-term trend is up and this is just a correction within that uptrend, I will stick with this immediate downtrend and expect more weakness as long as 111.50 holds. In the indicator window, notice that Aroon Down moved above Aroon Up and Aroon Down hit 100 for the first time since October.
No Webinar this Week
Programming Note: I am traveling on Tuesday and will not be able to do a webinar. This travel involves a trip to Amsterdam to meet with Julius de Kempenaer of Relative Rotation Graph (RRG) and see a Market Technicians Association presentation from Katie Stockton CMT. I will take notes and report back some of the findings.
******************************************************
Measuring Risk On-Risk Off - Using charts to quantify stock, economic and credit risk.
PPO Trading Strategy - How to use 3 PPOs to develop a trend-reversion trading strategy.
Long-term Trend Indicators - Using the PPO, EMA Slope and CCI to determine the trend.
ETF Master ChartPack - 300+ ETFs organized in a Master ChartList and in individual groups.
Follow me on Twitter @arthurhill - Keep up with my 140 character commentaries.
****************************************
Thanks for tuning in and have a good day!
--Arthur Hill CMT
Plan your Trade and Trade your Plan
*****************************************


