----- Webinar Video ----- Art's Charts ChartList -----
Staples and Utilities Bounce During Pullback .... Marking First Support for SPY and IWM .... QQQ Nears September-October Highs .... Charting the Fab Five: AAPL, GOOGL, MSFT, FB and AMZN .... Oil Turns Volatile ahead of OPEC Meeting (USO, XLE, XES) .... //// ....
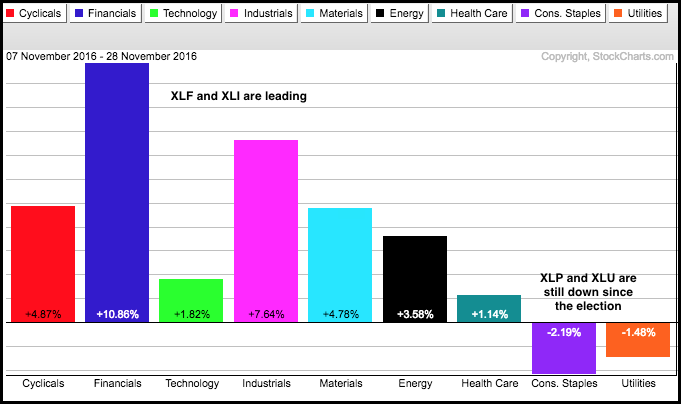
Staples and Utilities Bounce During Pullback
We finally got a pullback in the stock market with small-caps leading the way lower. This can be expected because small-caps led the way higher and these stocks typically have higher betas than large-caps. Seven of the nine sector SPDRs were down with the Energy SPDR (XLE) and Finance SPDR (XLF) leading the pullback. The Consumer Staples SPDR (XLP) and the Utilities SPDR (XLU) were the lone gainers. Even though XLP and XLU bucked the selling pressure, notice that these two sectors are still down over the last three weeks and did not partake in the post-election rally. Also notice that XLF was up the most and has the most room to correct.
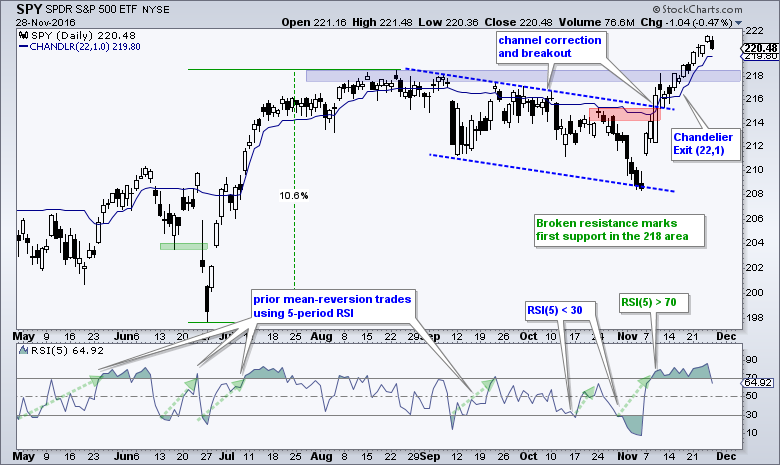
Marking First Support for SPY and IWM
As noted on Monday, predicting a pullback within a bigger uptrend is difficult at best. It is probably better to look for short-term oversold situations and support levels that may give way to a bounce and a continuation of the bigger uptrend. The first chart shows SPY with broken resistance turning first support in the 218 area. RSI(5) is still well above 30 and not even close to becoming oversold.
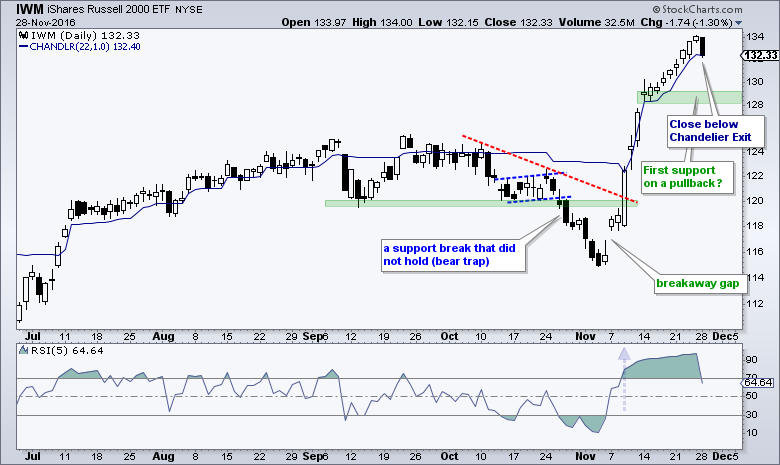
IWM closed below the Chandelier Exit (22,1) to trigger a trailing stop-loss. This, however, is not a bearish signal. Now I will simply wait for the next bullish setup. First support is marked in the 128-129 area and RSI(5) remains well above 30.
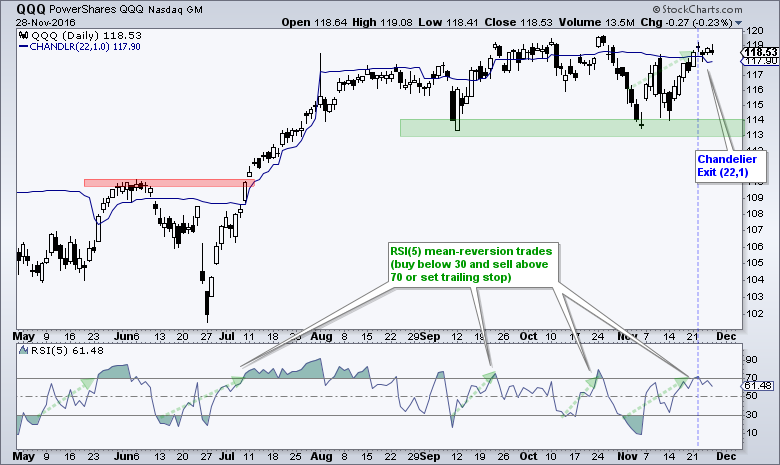
QQQ Nears September-October Highs
QQQ stalled near its September-October highs the last four days, but I am hesitant to call this "resistance" because we are in a bull market environment and bigger trend is up for QQQ. After all, the ETF broke out in mid July and hit a new high on October 24th. I do not mark resistance when the trend is up because I expect resistance levels to be broken. This is how higher highs or rising peaks form. Support levels are more important because they hold the real key to the uptrend. A break below 113 would forge a lower low and call for a reassessment of the overall uptrend.
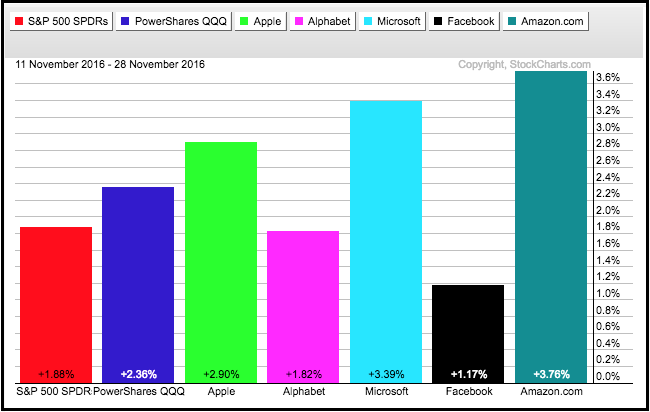
Charting the Fab Five: AAPL, GOOGL, MSFT, FB and AMZN
QQQ is, of course, dependent on the performance of its top stocks (aka, the Fab Five: FB, AMZN, AAPL, GOOGL and MSFT). These five stocks account for around 39% of the ETF with AAPL, GOOGL and MSFT weighing over 8% each. I featured these stocks two weeks ago (15-Nov) as they became short-term oversold within bigger uptrends. All five bounced over the last two weeks and I will now follow up to mark levels that warrant a re-evaluation of the bullish stance.
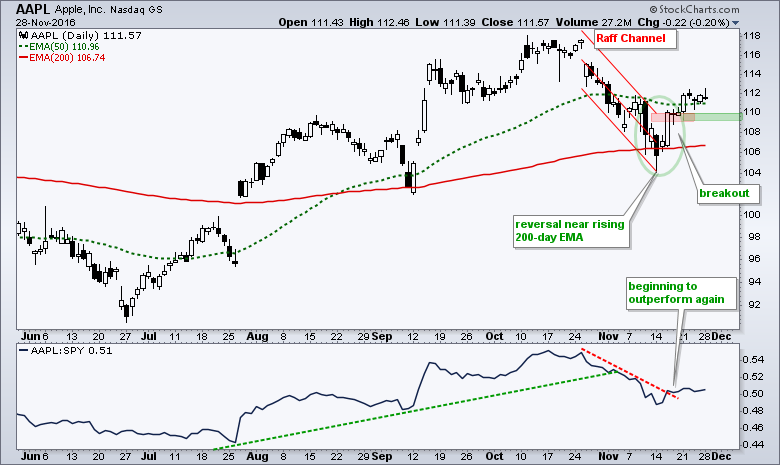
The first chart shows AAPL reversing near the rising 200-day EMA in mid November and breaking out above 110. The long-term trend is up and this breakout is clearly bullish as long as it holds. I would re-evaluate on a close below 109. The indicator window shows the price relative turning up and then stalling.
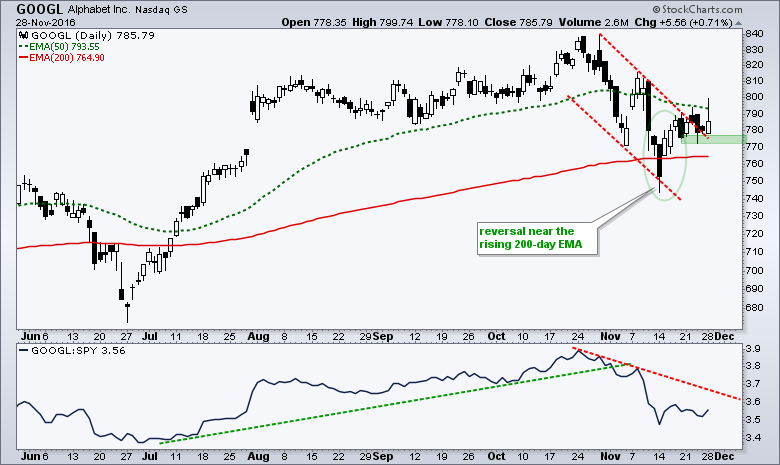
GOOGL also reversed near the rising 200-day and broke the channel trend line last week. Despite this reversal and breakout, the stock is struggling a bit and I am marking support at 770. A close below this level would call for a re-evaluation.
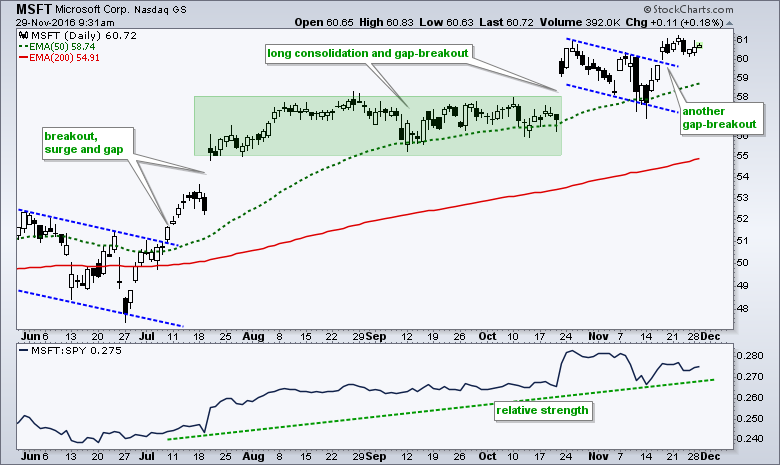
MSFT is the strongest of the five because it hit a 52-week high four days ago. The overall trend is clearly up with the most recent breakout occurring at 60. The price relative (MSFT:SPY ratio) is also in a clear uptrend.
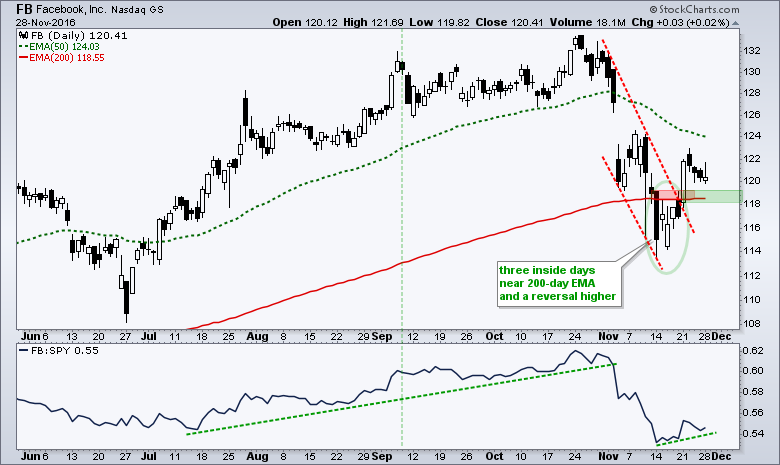
FB formed three inside days near the 200-day EMA and reversed with a surge above 119. I view this breakout as bullish as long as 118 holds.
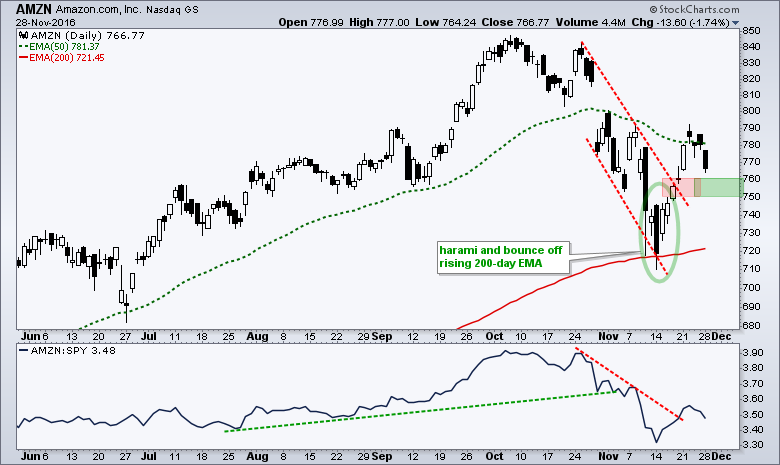
AMZN formed a harami near the rising 200-day EMA and surged above the channel trend line a few days later. The breakout zone appears to be around 750-760 and this is where I will mark my first re-evaluation level. A close below 750 would negate this breakout.
Oil Turns Volatile ahead of OPEC Meeting
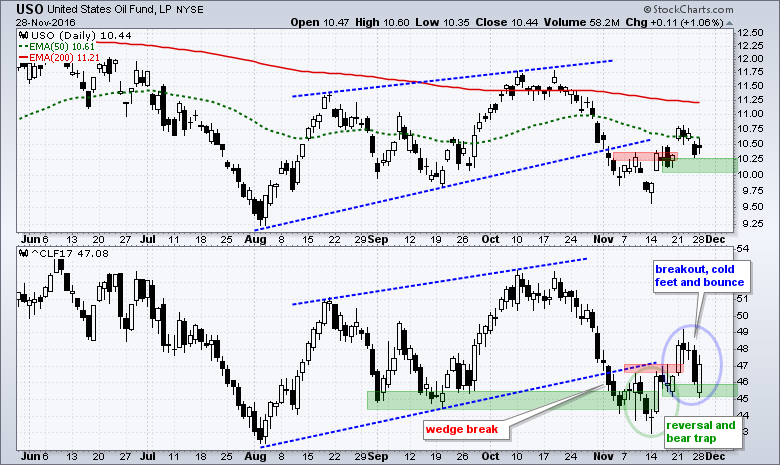
Energy stocks and oil are looking vulnerable after a negative reaction to the upcoming OPEC meeting. Yes, the meeting has yet to take place and the markets are already moving in anticipation. I do not want to speculate on the outcome of Wednesday's meeting, but will take a look at the charts for oil, XLE and XES. First, note that volatility will be high the next few days as rumors swirl ahead of the final communiqué. Second, note that I am moving to the January 2017 Crude Futures Contract (^CLF17) for analysis. In the bottom window, crude broke the wedge trend line and exceeded the September lows with a breakdown in early November, but quickly recovered with a reversal and surge above 47 (green circle). Crude fell back sharply on Friday as the market go cold feet on OPEC and then firmed on Monday. Crude futures are down sharply this morning and a close below 45 would be bearish on this chart.
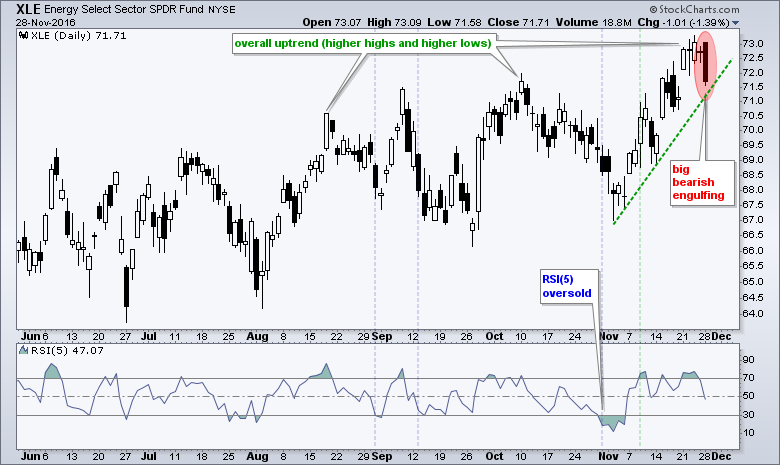
The Energy SPDR (XLE) remains in an uptrend overall, but formed a big bearish engulfing on Monday. This bearish pattern formed after a 52-week high just three days ago. Further weakness below 71.5 would reverse the upswing and call for a correction within the bigger uptrend. I would then watch RSI(5) for an oversold reading that could provide the next bullish setup.
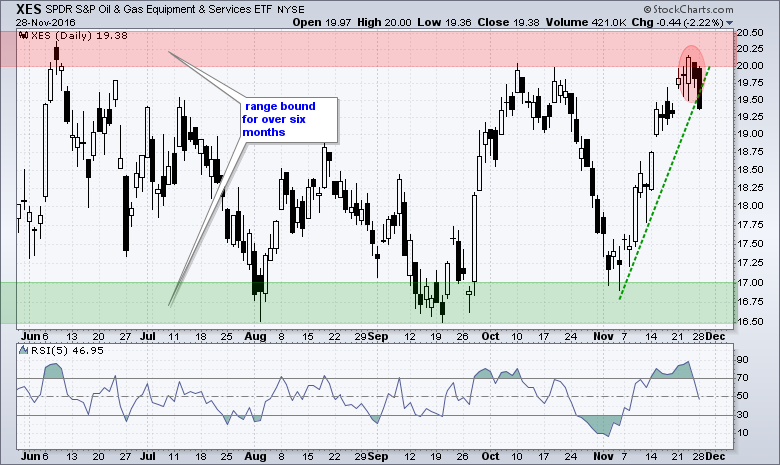
The Oil & Gas Equip & Services SPDR (XES) formed a harami near resistance on Thursday-Friday and moved sharply lower on Monday. The decline broke the upswing line and started to fill last week's gap.
******************************************************
Spotting Pullbacks and Upturns within an Uptrend using RSI and MACD Histogram.
Defining Bull and Bear Market Environments with Breadth Indicators (plus video).
Backtesting Different Moving Average Pairs with SPY, QQQ and IWM.
ETF Master ChartPack - 300+ ETFs organized in a Master ChartList and in individual groups.
Follow me on Twitter @arthurhill - Keep up with my 140 character commentaries.
****************************************
Thanks for tuning in and have a good day!
--Arthur Hill CMT
Plan your Trade and Trade your Plan
*****************************************


