SPY is the Last One Standing .... XLF Defies Overbought Readings .... Materials Follows thru on Pennant Breakout .... Bigger Uptrend Overpowers Short-term Dip in XLE .... Adjusting RSI for Trend Identification .... Healthcare Remains Under Pressure .... //// ....
SPY is the Last One Standing
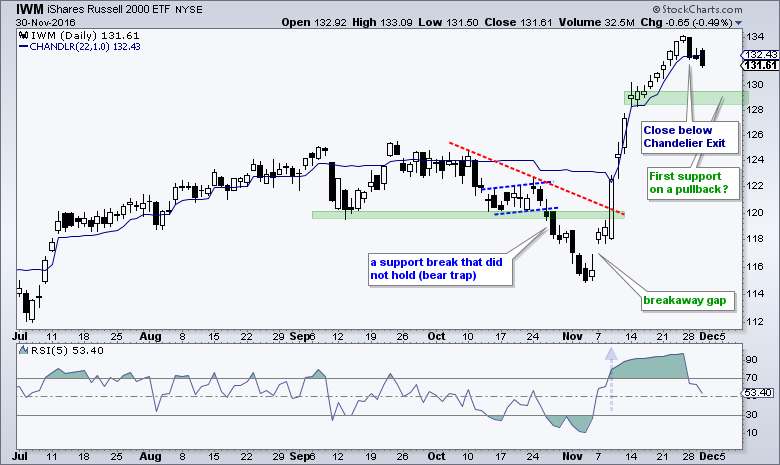
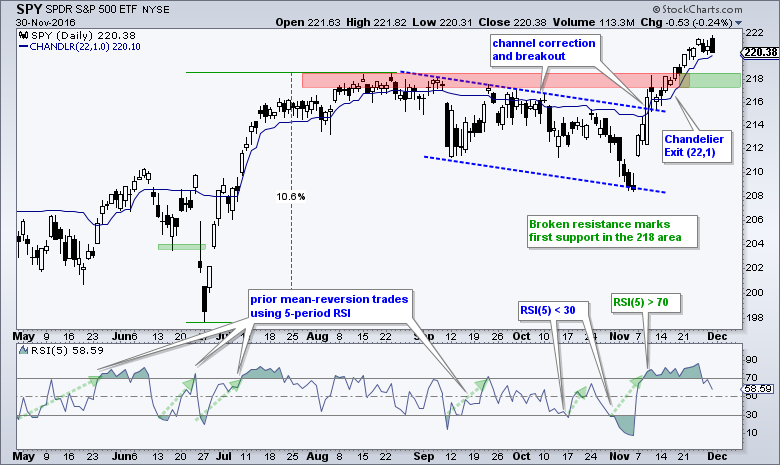
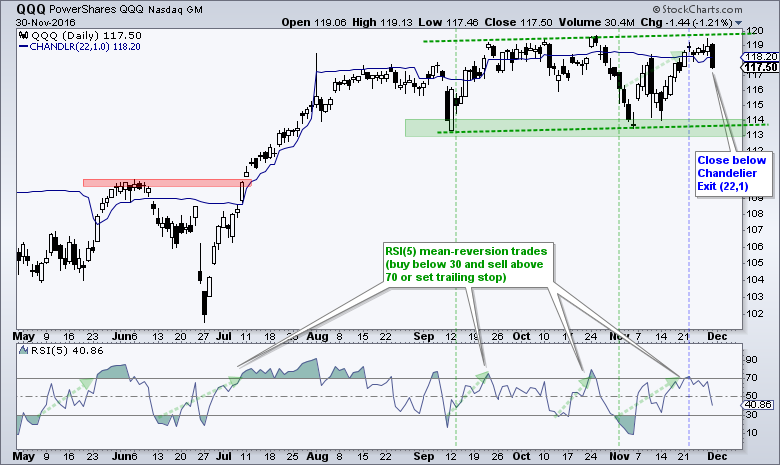
Modest selling pressure over the last three days triggered Chandelier Exits in IWM and QQQ. IWM triggered with a decline on Monday and QQQ closed below its Chandelier Exit on Wednesday. SPY is the only one of the major index ETFs that has yet to trigger a Chandelier Exit, which is used as a stop-loss on short-term positions. This is not a bearish signal because I think a pullback will set up the next opportunity. Why? Because the bigger trends are up and we are in a bull market. I will be looking for RSI(5) to dip below 30 for the next mean-reversion setup in QQQ and IWM. I have also marked potential support levels for SPY and IWM.
XLF Defies Overbought Readings
The Finance SPDR (XLF), Energy SPDR (XLE) and Materials SPDR (XLB) led the market higher on Wednesday. XLF became "overbought" three weeks ago and then went on to new highs last week and this week. Chartists should expect momentum indicators to become overbought in an uptrend because overbought is just a sign of strong buying pressure, especially when RSI(14) exceeds 70. The chart below shows RSI(5) becoming overbought on 7-Nov, and RSI(10) and RSI(14) following with overbought readings on 9-Nov. The latter two remained overbought as the short-term surge extended. Notice that RSI(14) becomes overbought/oversold significantly less often than RSI(5). This is why I use RSI(5) to look for short-term oversold readings when the bigger trend is up. It is much more sensitive and more likely to generate signals.
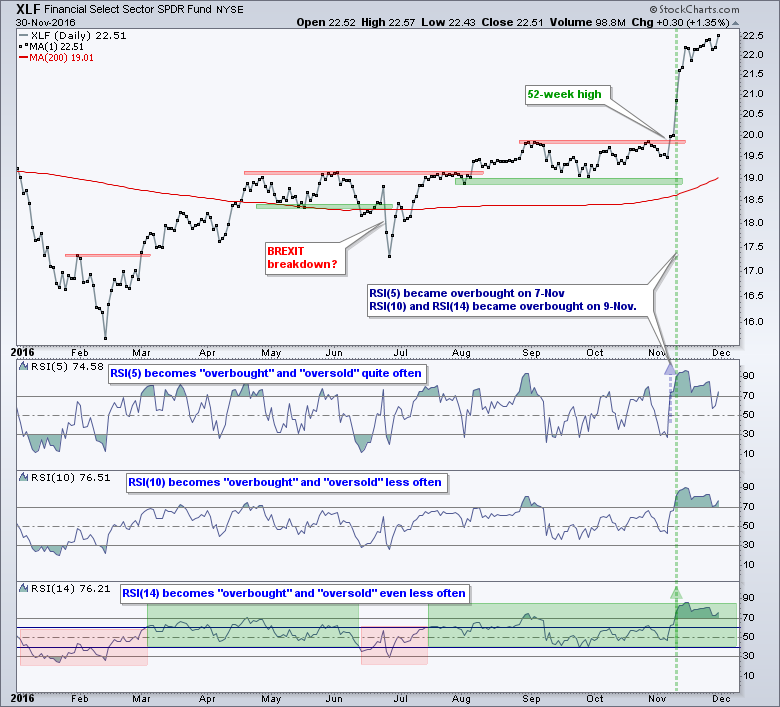
I am more likely to use RSI(14) to define the overall trend by using bull and bear ranges. This is not an exact science, but I tend to use 40 to 80 as the bull range and 20 to 60 as the bear range. A move above 60 shows strong upside momentum and this is bullish as long as RSI holds above 40. A move below 40 shows strong downside momentum and this is bearish as long as RSI holds below 60. Four different bull/bear periods are highlighted on the chart in green and red. This is not a "stand alone" trend indicator and should be used with other analysis techniques.
Materials Follows thru on Pennant Breakout
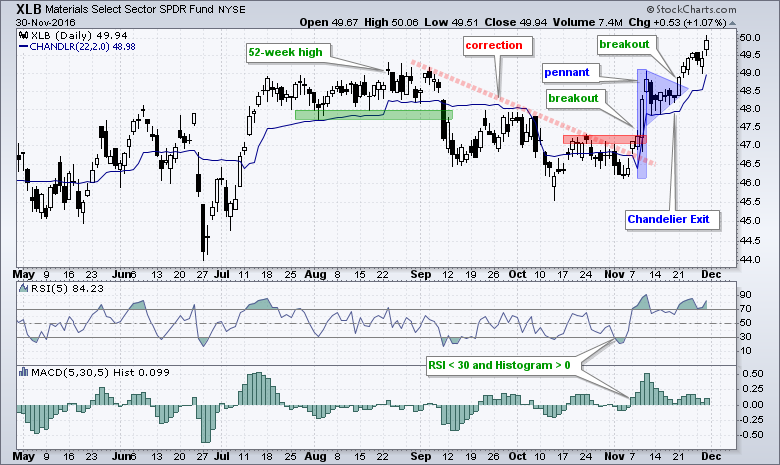
The Industrials SPDR (XLI), Materials SPDR and Energy SPDR continue to lead on the price charts with 52-week highs this week. XLI hit an intra-day high, while XLE and XLB hit 52-week highs on a closing basis. I recently outlined a strategy using RSI(5) to identify short-term oversold conditions with XLB and the MACD Histogram (5,30,5) to identify short-term upturns. The combo does NOT always work, but worked well with the most recent trade. XLB then formed a pennant in mid November and broke out last week (highlighted in Art's Charts on 22-Nov). I placed a Chandelier Exit and this remains on a chart as a potential trailing stop.
Bigger Uptrend Overpowers Short-term Dip in XLE
XLE plunged on Monday-Tuesday, but gained it all back with a surge to new highs on Wednesday. Once again, the bigger uptrend has proven to be the dominant force. As with all technical analysis tools, trend identification is not an exact science and I prefer to look at more than one indicator. Note that the price plot is the single most important analytical tool (in my humble opinion). The chart below shows XLE with a surge and then a steady uptrend since May. Notice the higher highs and higher lows formed a rising channel over the last seven months. Also notice the first 52-week high in mid August.
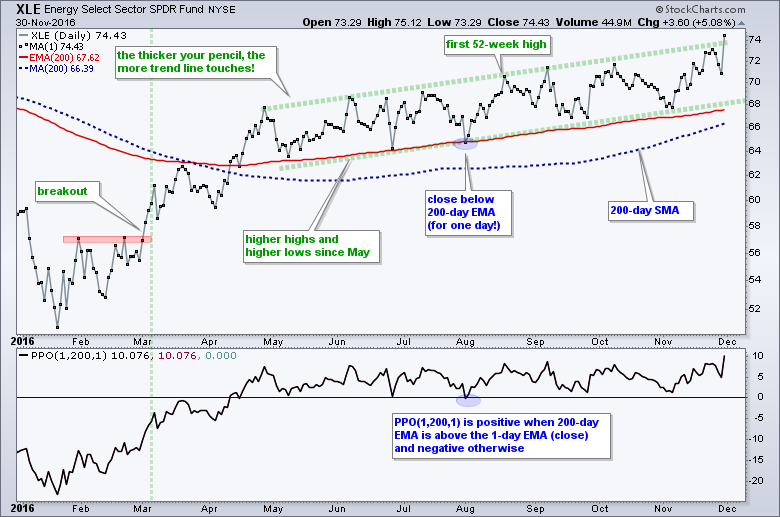
I overlaid the 200-day EMA (red) and 200-day SMA (blue) to help with the trend. I prefer EMAs because they give more weight to recent price data and less weight to older data. They also tend to have less lag than SMAs. XLE broke the 200-day EMA for one day on the Brexit plunge, but immediately recovered. Chartists can consider adding a price or time filter to signals by requiring price to move a certain percentage above the EMA (2%) or hold above the EMA for a certain amount of days (5).
Adjusting RSI for Trend Identification
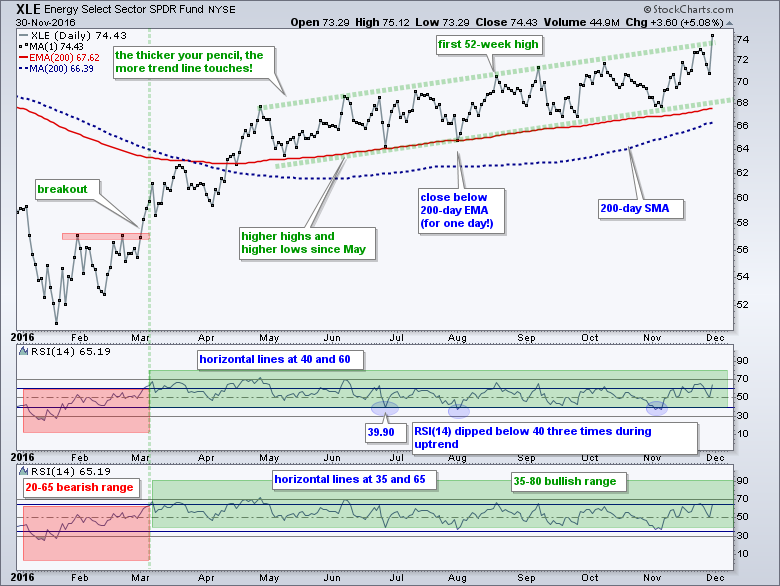
The first indicator window in the chart below shows RSI(14) and its imperfections. Normally, the trend is up when RSI trades in the 40-80 range, but notice that RSI dipped below 40 three times during the "uptrend". This has prompted me to do some testing on RSI trend levels in the coming weeks. At the risk curve fitting, chartists can lower the bearish threshold and raise the bullish threshold. This will result in later signals, but it will help reduce whipsaws. The second indicator window shows RSI with a bull range from 35 to 80 and a bear range from 20 to 65. This means a move below 35 signals a downtrend and the downtrend remains until a move above 65.
Healthcare Remains Under Pressure
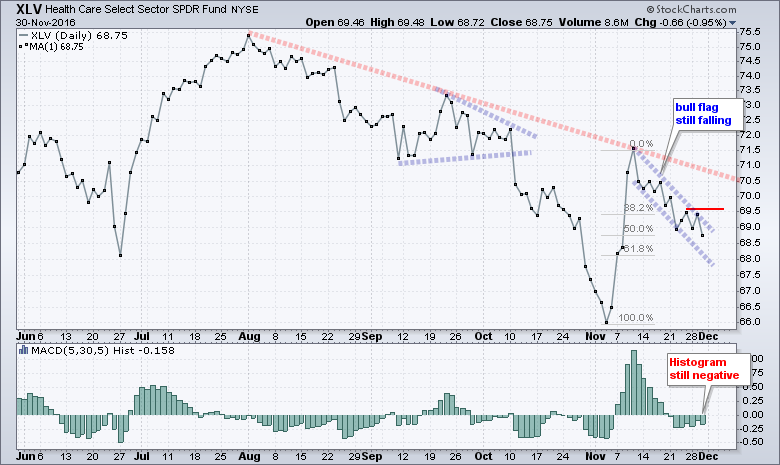
The HealthCare SPDR (XLV) and the biotech ETFs cannot get any upside traction to trigger flag breakouts. I am still watching these closely and think it wise to wait for the breakout or short-term upturn. The chart below shows XLF with closing prices only. Most indicators, such as RSI and MACD, are based on closing prices and we can filter some of the chart noise by focusing on closing prices. XLV remains in a long-term downtrend, but got a massive surge in early November. The ETF then pulled back with what looks like a short-term correction. A typical pullback would retrace 38.2% to 61.8% of the prior advance and XLV has currently retraced just over 50%. Even though a falling flag is typical for a correction after a sharp advance, the short-term trend is down as long as the flag falls. Look for a close above 69.5 and/or a Histogram cross above zero to signal a short-term upturn. Note that the Biotech SPDR (XBI) and Biotech iShares (IBB) are in similar situations (potential bullish setups, but no signal yet).
******************************************************
Spotting Pullbacks and Upturns within an Uptrend using RSI and MACD Histogram.
Defining Bull and Bear Market Environments with Breadth Indicators (plus video).
Backtesting Different Moving Average Pairs with SPY, QQQ and IWM.
ETF Master ChartPack - 300+ ETFs organized in a Master ChartList and in individual groups.
Follow me on Twitter @arthurhill - Keep up with my 140 character commentaries.
****************************************
Thanks for tuning in and have a good day!
--Arthur Hill CMT
Plan your Trade and Trade your Plan
*****************************************


