The S&P 500 fell softly (~3%) over the last nine trading days and the S&P 500 Volatility Index ($VIX) surged over 70%. This surge puts $VIX at its highest level in over three months - but this is not necessarily bearish. $VIX is a coincident indicator that moves opposite of stocks. This means it is supposed to move higher when stocks decline. From a contrarian perspective, these surges signal an increase in fear that could foreshadow a trough in the S&P 500. The trick is to measure this fear and today I will show a measuring technique using the PPO.
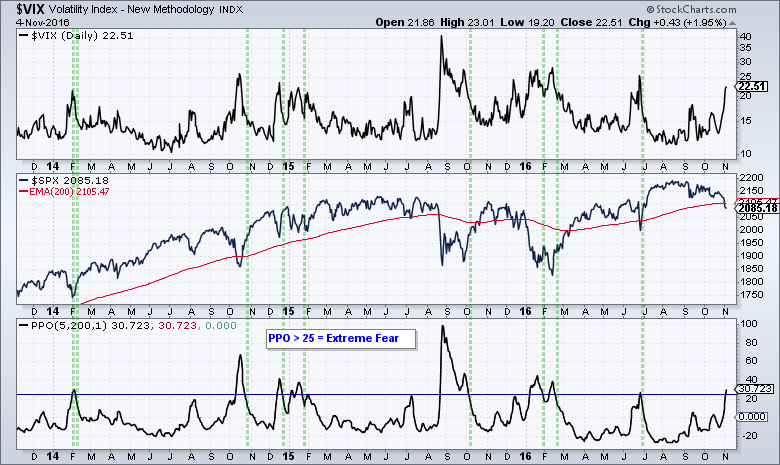
I think $VIX is best used as a mean-reversion type indicator because a certain level of fear can foreshadow a reaction low (trough) in the S&P 500. Instead of using actual $VIX levels, I am applying the Percentage Price Oscillator (PPO) to "normalize" $VIX and show momentum based extremes. The bottom window shows the PPO(5,200,1), which measures the difference between the 5-day EMA and the 200-day EMA. $VIX signals extreme fear when the PPO moves above 25%, which means the 5-day EMA of $VIX is 25% higher than the 200-day EMA. The green vertical lines on the chart below show when the PPO moves back below 25%, which means fear is subsiding and the S&P 500 is turning up. A sustained bounce in stocks today could push the PPO back below 25%.
******************************************************
Measuring Risk On-Risk Off - Using charts to quantify stock, economic and credit risk.
PPO Trading Strategy - How to use 3 PPOs to develop a trend-reversion trading strategy.
Long-term Trend Indicators - Using the PPO, EMA Slope and CCI to determine the trend.
ETF Master ChartPack - 300+ ETFs organized in a Master ChartList and in individual groups.
Follow me on Twitter @arthurhill - Keep up with my 140 character commentaries.
****************************************
Thanks for tuning in and have a good day!
--Arthur Hill CMT
Plan your Trade and Trade your Plan
*****************************************


