An RSI(5) Setup for QQQ .... IWM Corrects with Bull Flag .... Three Sector SPDRs with Short-term Bullish Setups .... Biotechs Hold the Key to Healthcare .... ChartList Update .... QCOM, SYMC, ACN, ATI, AVGO, CHKP, CTRL, AMGN, BMY, MRK, PFE, TASR and XOM .... //// ....
An RSI(5) Setup for QQQ
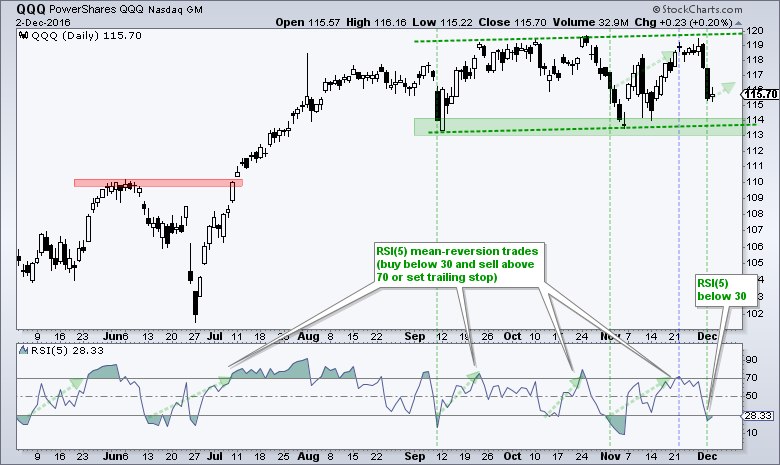
QQQ plunged on Wednesday-Thursday and RSI(5) moved below 30 for a mean-reversion setup. To recap: the RSI mean-reversion system goes long when RSI(5) closes below 30 and exits when RSI(5) closes above 70. The signals are based on closing prices, the trades are taken the next open and chartists can also consider a trailing stop once RSI(5) exceeds 70. The green arrows on the RSI plot show the previous trades. Note that the last trade resulted in a 2% gain. It is a short-term system designed to trade short-term pullbacks when the bigger trend is up. The overall trend for QQQ is clearly up because the ETF hit a new high on October 25th. In addition, the green trend lines mark a channel with a slight rise. Yes, I realize that QQQ is lagging the last six weeks and the seasonal patterns are mixed, but I focus most on the system. Thus, QQQ was oversold on the close Thursday and the signal triggered on Friday's open. Click here for more details on the 5-day RSI Mean-Reversion System.
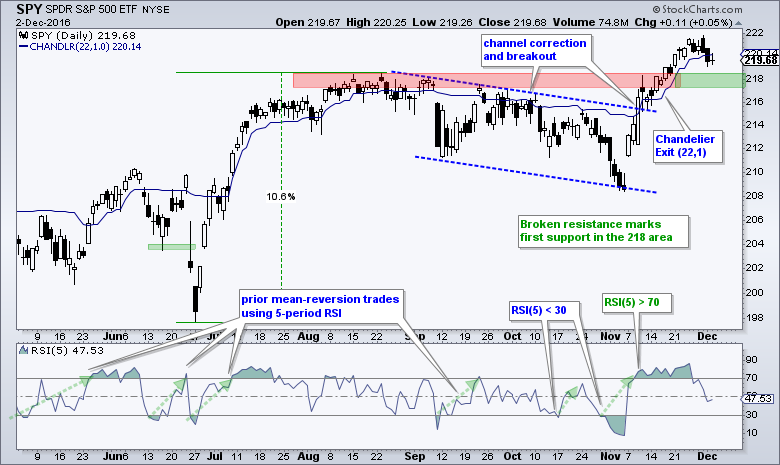
The next chart shows SPY with RSI(5) moving below 30 on October 31st and exceeding 70 on November 9th. A Chandelier Exit was set on November 10th and this exit triggered with the close on Thursday (December 1st). Short-term, SPY remains in watch mode because the exit trigger and I am waiting for the next setup (RSI(5) < 30). Broken resistance turns first support in the 218 area.
IWM Corrects with Bull Flag
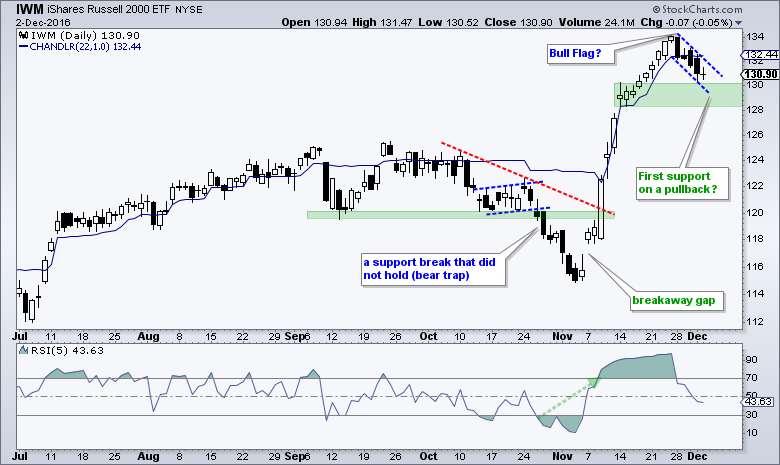
IWM is also waiting for another setup and RSI(5) to dip below 30. Pattern-wise, the decline over the last five days formed a falling flag and this is a bullish continuation pattern. Falling flags represent a correction after a sharp advance and a breakout at 132.1 would signal a continuation higher.
Three Sector SPDRs with Short-term Bullish Setups
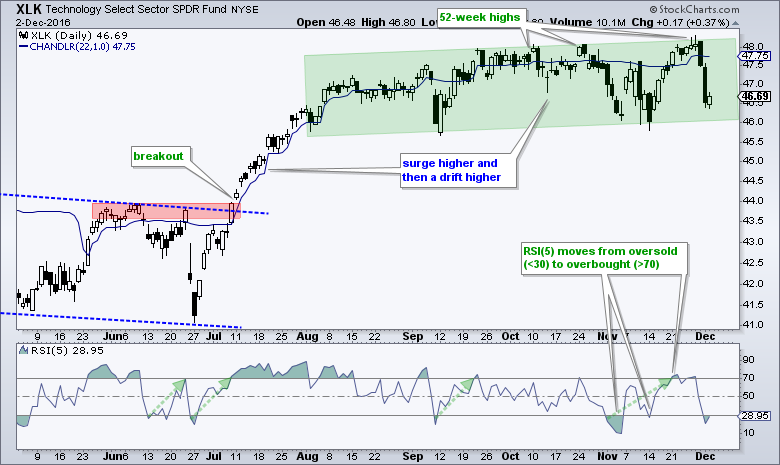
I only see three setups among the nine sector SPDRs. XLF, XLI, XLE and XLB hit new highs on Thursday-Friday and remain in strong uptrends (short-term and long-term). XLP hit a new low on Thursday and remains the weakest of the lot. XLU fell sharply on Wednesday-Thursday and tested the mid November low. XLP and XLU could come under pressure today as the 10-yr T-Yield ($TNX) ticks higher after the Italian referendum results. An uptick in yields could keep the bid in banks and brokers. That leaves three sector SPDRs on the watch with short-term setups. XLK is in a long-term uptrend and became oversold when RSI(5) moved below 30 on Thursday. This is the same setup as QQQ.
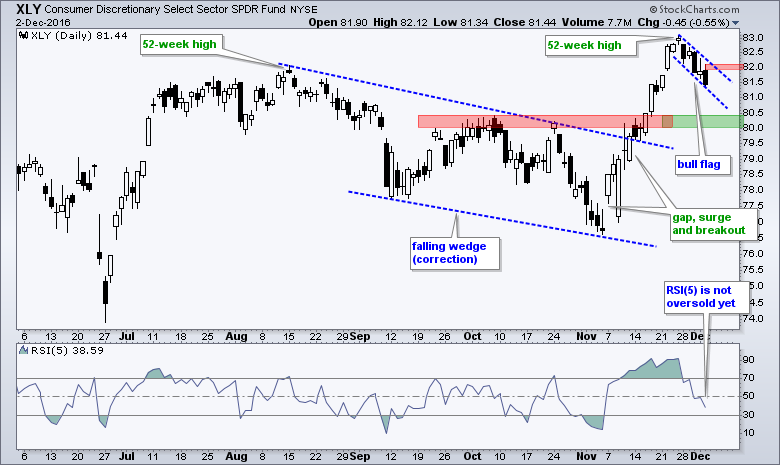
XLY pulled back over the last five days and formed a falling flag. RSI(5), however, is not yet oversold. A move above 82 would break flag resistance and signal a continuation higher. Note that XLY is in a long-term uptrend with a wedge breakout in late November and a 52-week high just six days ago.
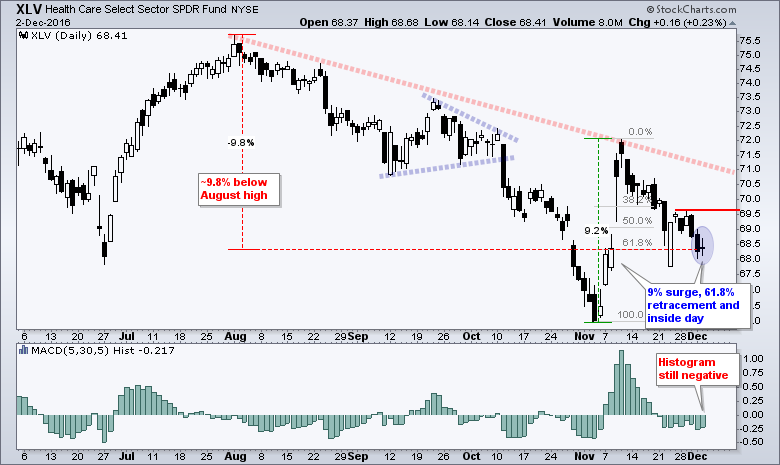
XLV is in a downtrend since August, but did not record a 52-week low in early November. In fact, XLV is currently around 10% above its February low, which is around 62. Overall, the ETF is currently around 10% from the August high and just below the midpoint of its two year range (ignoring the 25-Aug spike to 55.55). How's that for undecided. The trend is not up so I cannot use the RSI mean-reversion strategy. I remain intrigued because XLV surged 9% and then retraced 61.8% of that surge. The ETF formed a long white candlestick on 23-Nov and an inside day on Friday (blue oval). There are signs of firming and I continue to watch for an upturn and/or breakout. This watching may be in vain, but the setup is still there and I will keep watching until the setup dissipates. Look for a close above 69.6 or the MACD Histogram to turn positive.
Biotechs Hold the Key to Healthcare
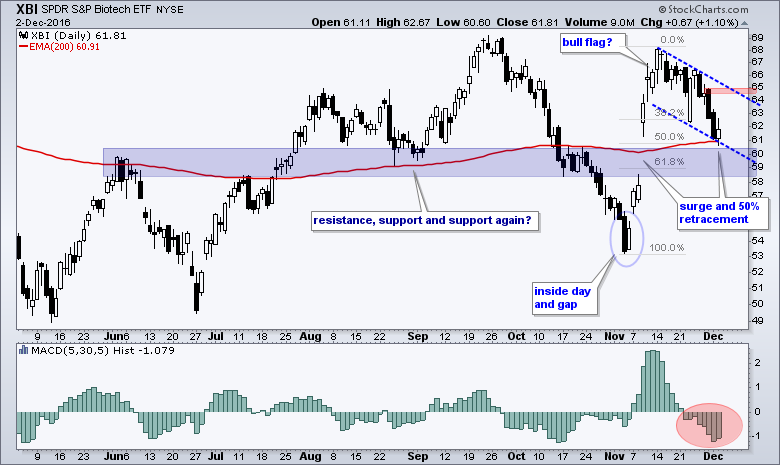
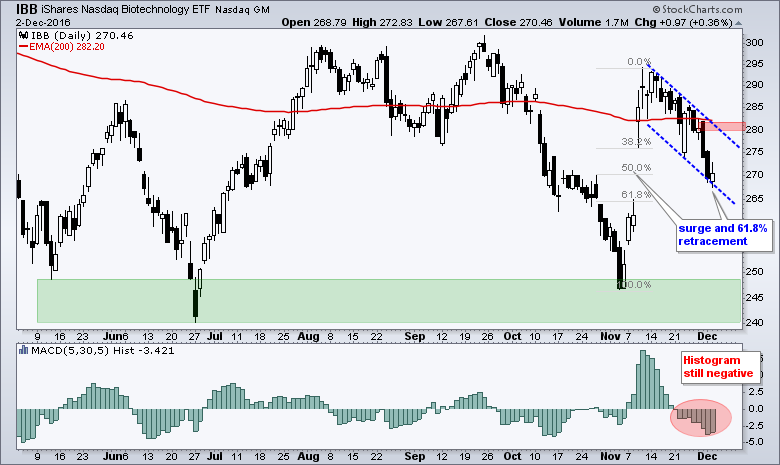
Unsurprisingly, the Biotech iShares (IBB) and the Biotech SPDR (XBI) have setups similar to XLV. Note that XBI is stronger that IBB because it held the 200-day EMA so far. Both remain in pullback mode with falling flags and the red zones mark flag resistance.
ChartList Update
Stock: QCOM, SYMC, ACN, ATI, AVGO, CHKP, CTRL, AMGN, BMY, MRK, PFE, TASR and XOM
I updated the Art's Charts ChartList with 13 stock charts. 10 of the 13 are above their 200-day EMAs. Most highlight short-term pullbacks within a bigger uptrend (5-day RSI below 30). AMGN, BMY and PFE are the three below their 200-day EMAs. These three are important to the HealthCare SPDR (XLV). These setups are for informational purposes only! Trade at your own risk. And....plan your trade first and then trade according to that plan.
******************************************************
Spotting Pullbacks and Upturns within an Uptrend using RSI and MACD Histogram.
Defining Bull and Bear Market Environments with Breadth Indicators (plus video).
Backtesting Different Moving Average Pairs with SPY, QQQ and IWM.
ETF Master ChartPack - 300+ ETFs organized in a Master ChartList and in individual groups.
Follow me on Twitter @arthurhill - Keep up with my 140 character commentaries.
****************************************
Thanks for tuning in and have a good day!
--Arthur Hill CMT
Plan your Trade and Trade your Plan
*****************************************


