 ----- Webinar Video ----- Art's Charts ChartList -----
Slow Down Time for XLF, XLI, and KRE? .... XME Target Based on Rising Channel .... Broken Resistance Turns First Support for XES .... EuroTop Index Stalls Near Resistance .... Webinar Preview.... //// ....
Slow Down Time for XLF, XLI, and KRE?
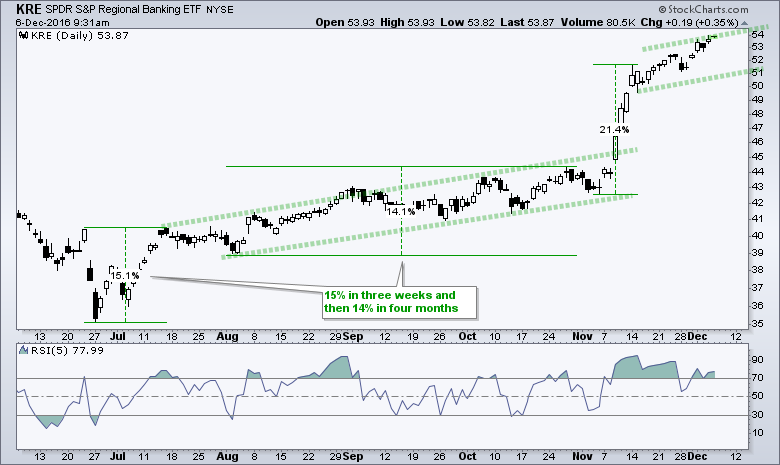
The Finance SPDR (XLF), Industrials SPDR (XLI) and Regional Bank SPDR (KRE) are leading the market with huge moves since early November. These moves are long-term bullish, but tough to trade in the short-term. After such a sharp advance, I would not be surprised to see some sort of slower advance evolve over the next few weeks. Such an advance could form a rising channel of sorts that zigzags higher at a slower pace. This means pullbacks within this channel would provide short-term opportunities to partake in the bigger uptrend.
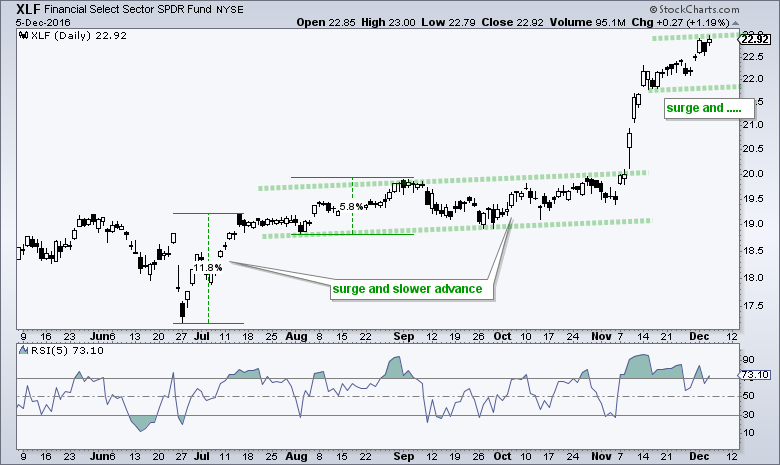
The chart above shows XLF surging in late June and then embarking on a long slog higher. XLF surged over 10% in three weeks and then added just 5.8% (max) the next four months. A similar scenario now could involve a channel starting in mid November with support in the 22 area. Or, perhaps a channel will start from this week's high because buying pressure may not be exhausted just yet. Chartists looking for pullbacks can also watch for RSI(5) to become short-term oversold for potential opportunities.
The next chart shows the Industrials SPDR (XLI) surging over 11% in late June and then embarking on a long sideways correction. The ETF then surged over 12% and could now embark on channel/zigzag higher. Keep in mind that I am making a guess because nobody can predict the future. This guess, however, is somewhat educated because it has happened before in the past (but not always!).
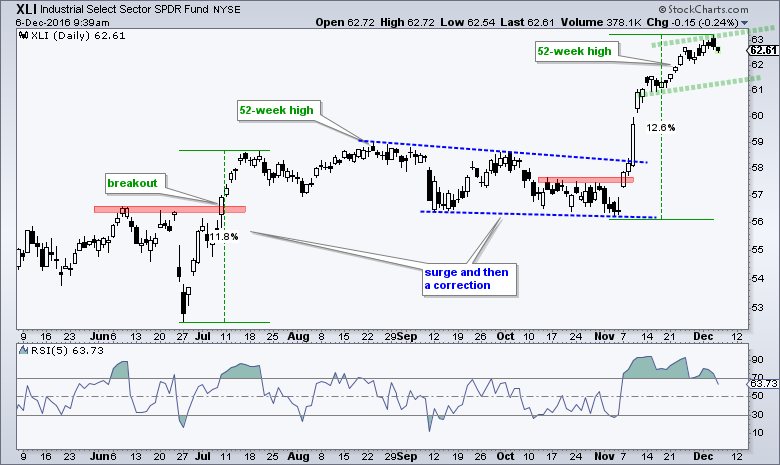
Note that I updated the Art's Charts ChartList by adding 18 stocks.
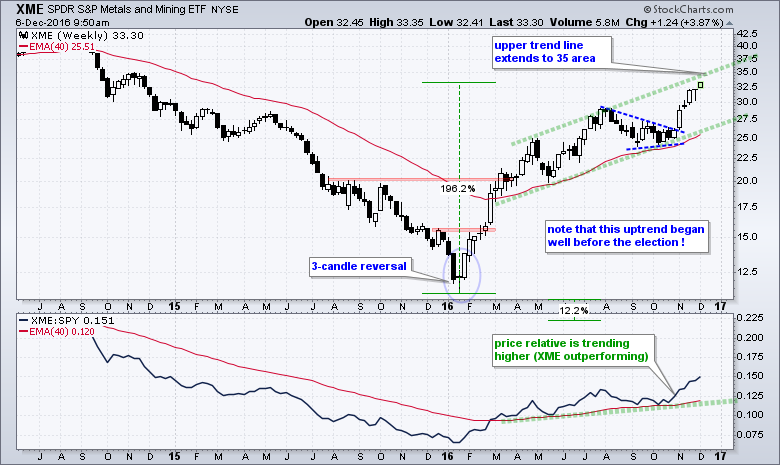
XME Target Based on Rising Channel
The next chart shows the Metals & Mining SPDR (XME) with weekly candlesticks over the last three years. The ETF is up almost 200% from the January low, but still well below its 2014 high, which leaves room for further upside. The uptrend is not in question and this group should relative strength as well. While I am not too keen on picking tops or predicting pullbacks, I will offer a technique that may help. I first drew the lower trend line and then created another parallel trend line. I then moved this trend line to match the peaks and it extends to the 35 area. This is not a HARD resistance level, but it would mark an extended level that could lead to a pullback or consolidation. Also keep in mind that targets are VERY subjective.
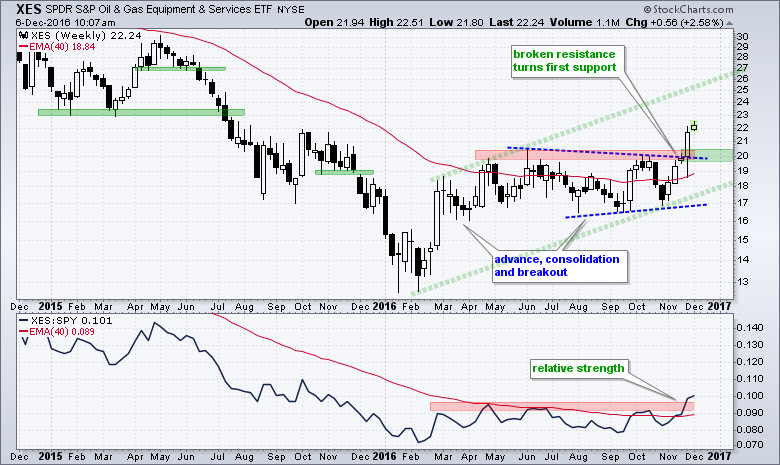
Broken Resistance Turns First Support for XES
A basic tenet of technical analysis is that broken resistance turns into support (and vice versa). As noted before, I think support and resistance levels are a bit tenuous for ETFs and indexes because they have dozens of components (stocks) affecting their price. Support and resistance levels for individual stocks are more concrete. In any case, we can see the Oil & Gas Equip & Services SPDR (XES) breaking a clear resistance zone around 20. This zone turns into the first support zone to watch on a throwback, which is a pullback to the newfound support zone. This would be the first area to consider an opportunity to partake in the overall uptrend. The breakout is bullish and there is no guarantee that we will see a throwback or a pullback. Applying the channel technique, XES could advance to the 26 area before getting too extended on this weekly chart.
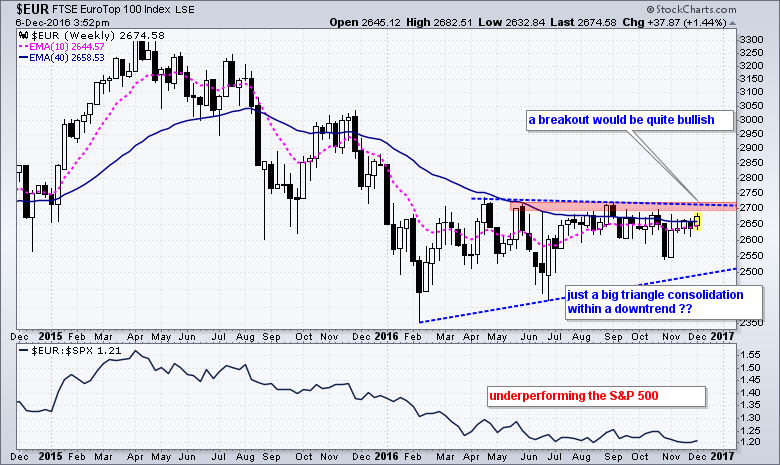
 EuroTop Index Stalls Near Resistance
The Eurotop 100 ($EUR) remains in a funk and down year-to-date. Note that $EUR is down around 6.8% year-to-date and the S&P 500 is up almost 8%. Also note that this index is priced in Euros and reflects what is happening in Europe. The index is at a make-or-break area because of resistance in the 2700 area. A breakout here would be quite bullish and suggest that European equities are turning around. Barring an upside breakout, it is also possible that a big triangle is forming and this is just a consolidation within a downtrend.
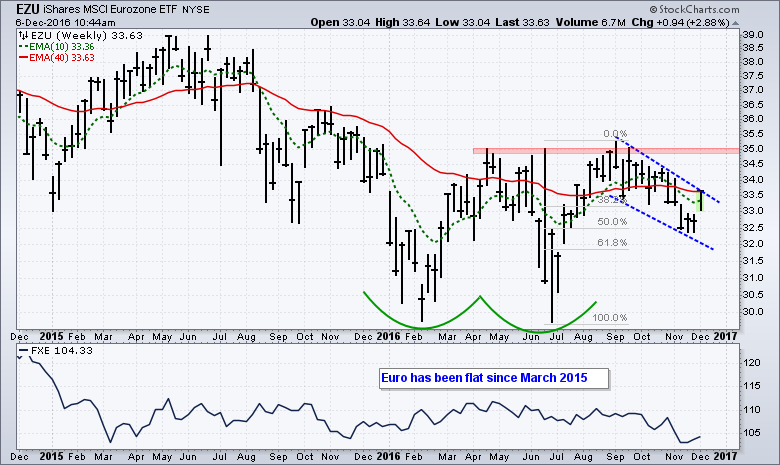
The next chart shows the Eurozone ETF (EZU), which is priced in Dollars. The sharp decline in the Euro weighed on this ETF over the last two months, but a potentially bullish setup is emerging. Notice that the ETF surged from late June to early September and then corrected with a falling channel/wedge. This pullback retraced 50-61.8% and the ETF surged this week. A breakout could be in the making here.
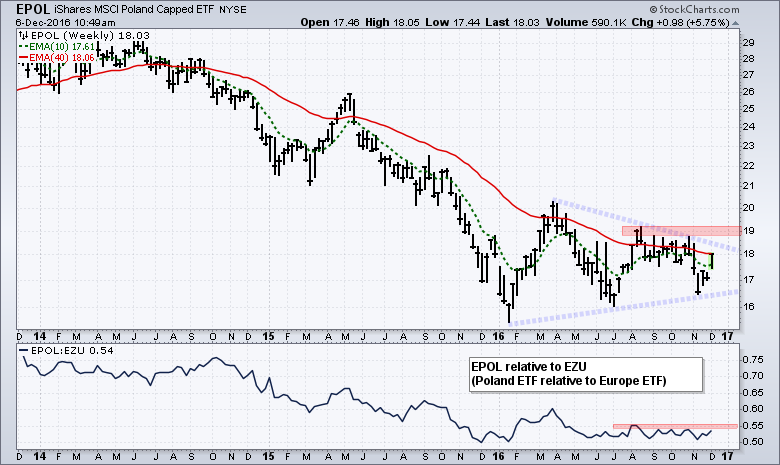
If European stocks are indeed turning around, then I would watch the Poland ETF (EPOL) closely because this is part of "emerging" Europe. EPOL formed a massive triangle this year and recently held above its summer lows. The ETF surged over the last 2-3 weeks and a follow through breakout would be bullish.
*****************************************************
Spotting Pullbacks and Upturns within an Uptrend using RSI and MACD Histogram.
Defining Bull and Bear Market Environments with Breadth Indicators (plus video).
Backtesting Different Moving Average Pairs with SPY, QQQ and IWM.
ETF Master ChartPack - 300+ ETFs organized in a Master ChartList and in individual groups.
Follow me on Twitter @arthurhill - Keep up with my 140 character commentaries.
****************************************
Thanks for tuning in and have a good day!
--Arthur Hill CMT
Plan your Trade and Trade your Plan
*****************************************


