Equal-weights are Leading Large-caps .... IJR is Greater than IWM .... Supply of Stocks Continues to Shrink .... QQQ Surges within Uptrend .... Trailing the Bull Flag Breakout in IWM .... Charting the Fab Five (FB, AAPL, AMZN, GOOGL, MSFT) .... Leadership from Consumer Discretionary is Very Positive .... Four Homebuilder Stocks to Watch (DHI, KBH, LEN, PHM).... //// ....
Equal-weights are Leading Large-caps
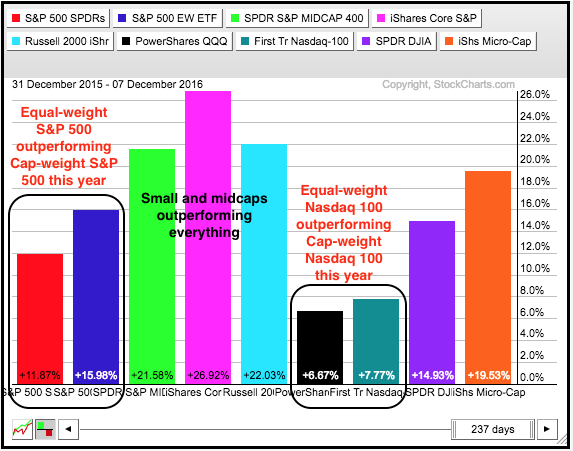
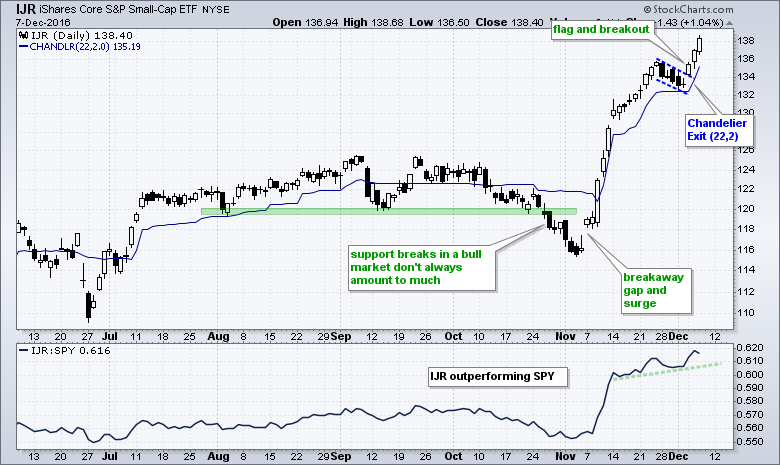
Stocks surged with the EW S&P 500 ETF (RSP) and Nasdaq 100 EW ETF (QQEW) leading the charge. This implies that the "average" stock in the S&P 500 and Nasdaq 100 indexes led the market, not just a few large-caps. This also speaks to the broadness of this advance. The PerfChart below shows year-to-date performance for nine index ETFs. Notice that RSP (blue) is outperforming SPY (red) and QQEW (teal) is outperforming QQQ (black). Also notice that the S&P SmallCap iShares (IJR), S&P MidCap SPDR (MDY) and Russell 2000 iShares (IWM) are outperforming everything. And finally, notice that IJR (pink) is up 26.92% this year and IWM (light blue) is up 22.03%. IJR is THE leader this year. More on this later.
While yesterday's surge may seem surprising with stocks "overbought", it is not surprising in the context of the trend. This is a bull market environment. Moreover, the long-term and short-term trends for the major stock indexes are up. Bullish surprises are more likely than bearish surprises with these conditions. Moreover, I will continue to ignore bearish patterns and only focus on bullish patterns and setups. The bull market is the dominant force at work right now and we should trade/think accordingly.
IJR is Greater than IWM
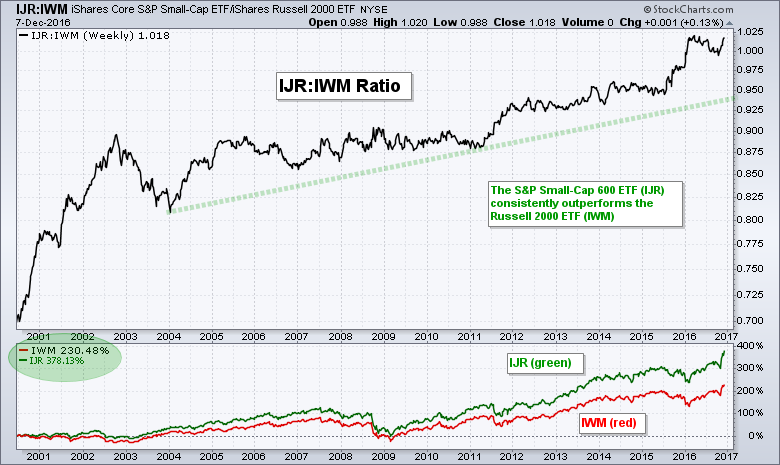
Most of us use the Russell 2000 and the Russell 2000 iShares (IWM) to measure small-cap performance and trade small-caps. The Russell 2000 is indeed a small-cap index, but it chronically underperforms the S&P Small-Cap 600. Put another way, the S&P SmallCap iShares (IJR) consistently outperforms the Russell 2000 iShares (IWM). The chart below shows the IJR:IWM ratio since the July 2001. The ratio clearly moves from the lower left to the upper right and this means IJR consistently outperforms IWM. This also means that we should favor IJR when looking for a play on small-caps.
Supply Continues to Shrink
I found a FTSE Russell document from June 2016 that pegs the total market capitalization of the small-cap Russell 2000 at $1.9 trillion and the large-cap Russell 1000 at $22.1 trillion. Together, these two form the Russell 3000 (market cap $24 trillion) and this index covers around 98% of the total US stock market. This means the Russell 2000 accounts for around 8% of the Russell 3000. This document also notes a decrease in market cap from 2015 to 2016. The total market cap of the Russell 1000 decreased 4% and the total market cap of the Russell 2000 decreased 14%. This means the supply of available stock decreased.
QQQ Surges within Uptrend
QQQ fell sharply last week and RSI(5) moved below 30 for a bullish setup (short-term mean-reversion trade). Even though the advance slowed since September, QQQ remained in an uptrend with a 52-week high in late October and a slightly rising channel since September. Thus, pullbacks were deemed opportunities, not threats. Moreover, short-term bearish signals and short-term support breaks were to be ignored because the bigger uptrend was the dominant force. The bullish setup occurred with Friday's close and this means the trade trigger was Monday's open.
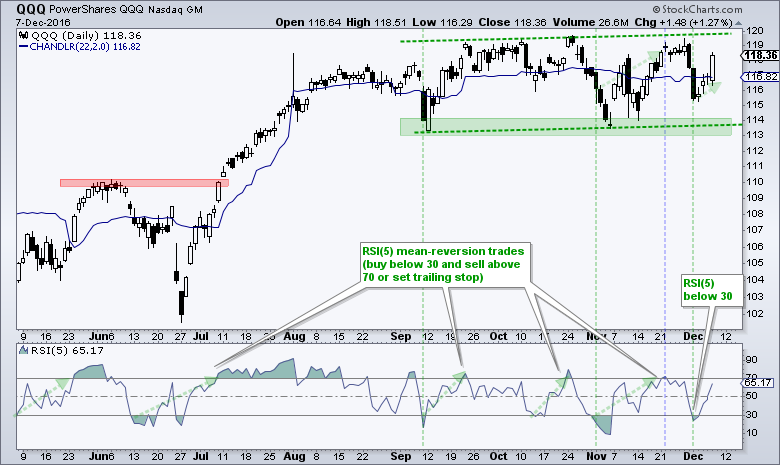 QQQ is now "in trade" and I see two options for an exit: an RSI close above 70 or a trailing stop. The original system entered when RSI(5) closed below 30 and exited when RSI(5) closed above 70. The last trade produced a 2% gain in November because the system exited before last week's sharp decline (blue dashed line). We are in a bull market and QQQ could play some catch-up here so I am tempted to apply a trailing stop using the Chandelier Exit (22,2). This is shown with the blue line, which is currently at 116.82. Thus, a close below this level would trigger an exit on the next open.
Trailing the Bull Flag Breakout in IWM
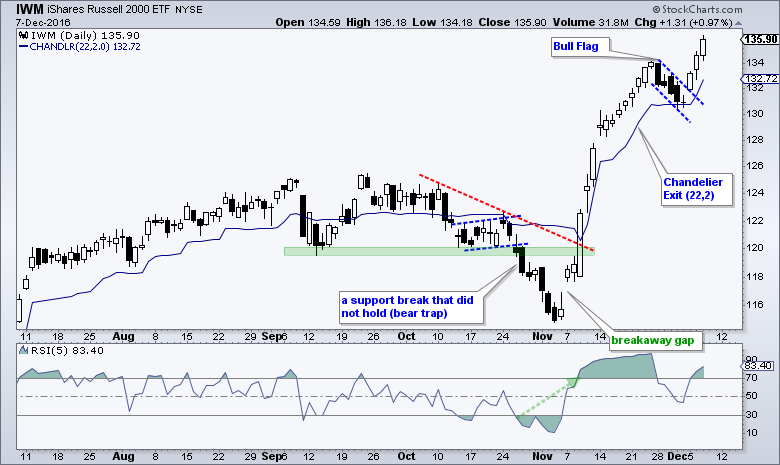
I showed the bull flag in IWM on Monday before the open and the ETF broke out with a gap surge that day. IWM is now up over 3% the last three days and trading at a 52-week high. The blue line is a Chandelier Exit (22,2) for a trailing stop-loss. This indicator is set two ATR(22) values below the 22-day high, which is now Wednesday's high. This exit will trail higher as long as IWM makes new highs. Chartists looking for a tighter stop can use the Chandelier (22,1). Don't ask me which one is better! It depends!
 Next week I will move to the S&P SmallCap iShares (IJR) for small-cap analysis and trading.
 Charting the Fab Five (FB, AAPL, AMZN, GOOGL, MSFT)
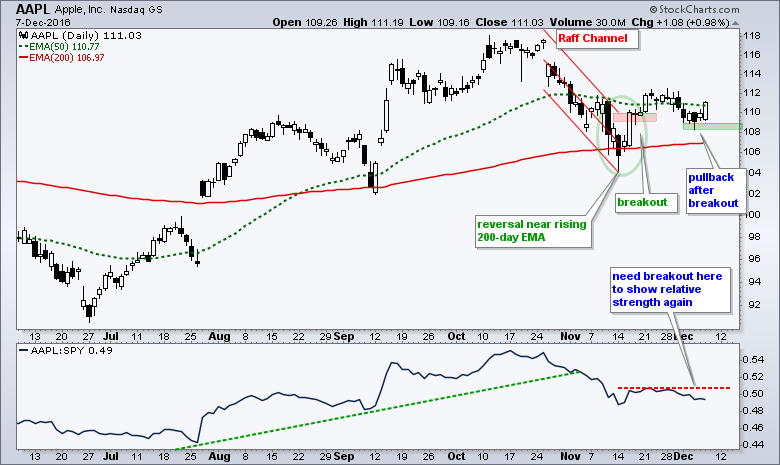
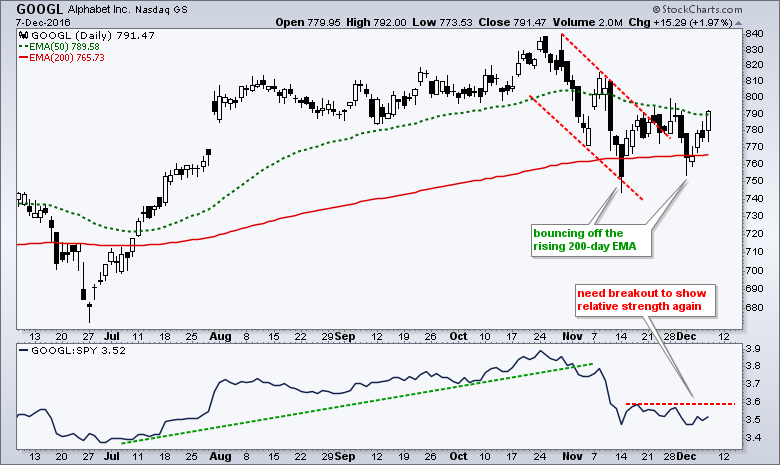
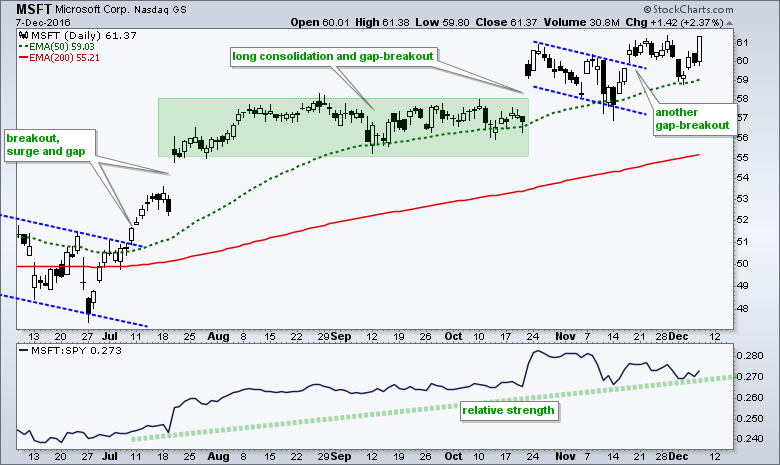
The top stocks in QQQ were hit rather hard from 22-Nov to 2-Dec, but they bounced over the last few days and remain in long-term uptrends. The 50-day EMA is above the 200-day EMA for Apple, Amazon, Facebook, Google and Microsoft (Fab Five). AAPL, AMZN, GOOGL and MSFT are above their 200-day moving averages. MSFT is the clear leader because it is the closest to a 52-week high.
The chart below shows APPL reversing in mid November, falling back in early December and getting a nice bounce on Wednesday. This could signal the end of the short pullback.
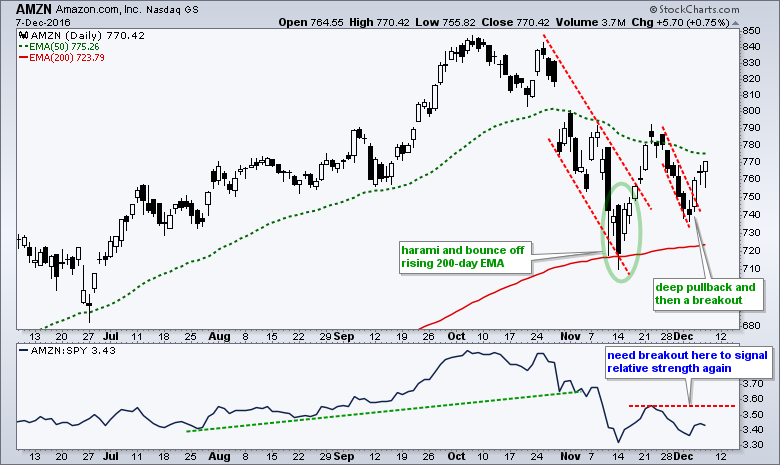
 The pullback in Amazon was deeper than I expected, but the stock broke out of the smaller channel with a surge the last three days.
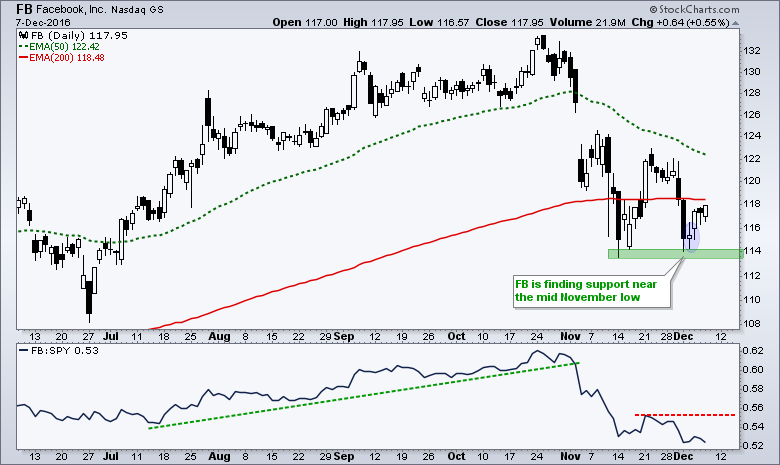
 FB is perhaps the weakest of the fab five because it tested its mid November low. The low held with a small spinning top four days ago (blue oval) and a bounce the last three days.
 GOOGL is getting its second bounce off the rising 200-day EMA.
 Microsoft is just a few cents from a 52-week high.
Leadership from Consumer Discretionary is Very Positive
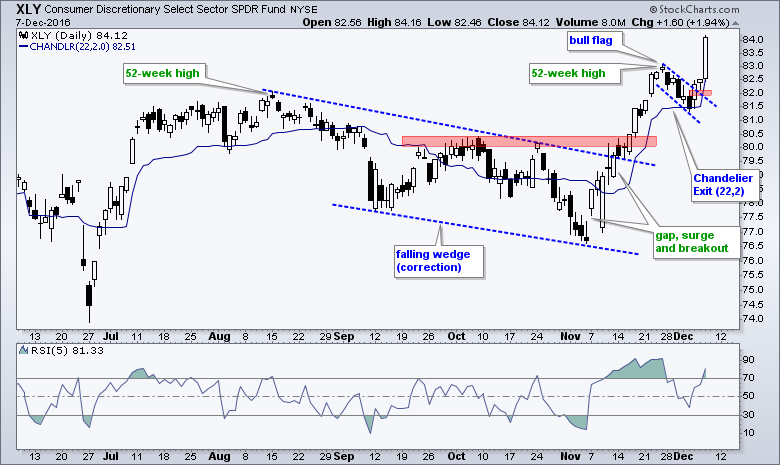
The consumer discretionary sector (aka cyclicals) is the most economically sensitive sector and strength in this sector bodes well for the economy and the stock market. The Consumer Discretionary SPDR (XLY) was lagging into early November, but took the lead over the last few weeks with a surge and 52-week high. I pointed out the bull flag on Monday before the open and the ETF broke out on the close that day. XLY then surged around 2% to lead the sector SPDRs on Wednesday. I added a Chandelier Exit (22,2) for a possible trailing stop. Also note that the EW Consumer Discretionary ETF (RCD) led the equal-weight sectors with a 2.41% gain and a new high on Wednesday.
Four Homebuilder Stocks to Watch (DHI, KBH, LEN, PHM)
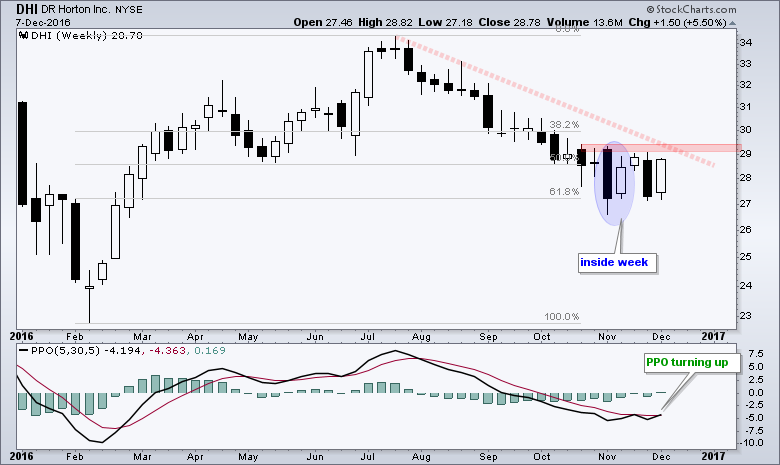
Within the consumer discretionary sector, note that the Retail SPDR (XRT) hit a new 52-week high and the Home Construction iShares (ITB) surged over 5% this week. The surge in housing stocks prompted me to check out some homebuilders and I am showing their annotated charts below. The first shows DR Horton with a big advance and then a decline that retraced 61.8%. The stock firmed with an inside week in early November and surged again this week. Notice that the weekly PPO (5,30,5) turned up and moved above its signal line.
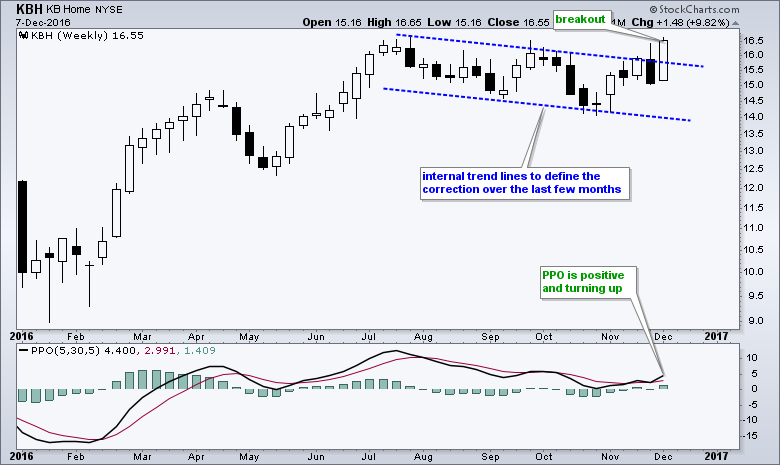
 KB Home is close to a 52-week high after breaking out this week.
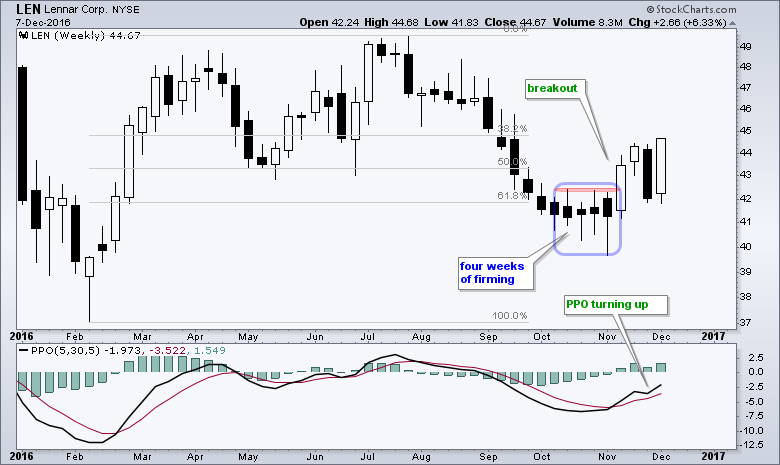
 Lennar overshot the 61.8% retracement, but managed to firm for four weeks and then break out with the surge above 43. The stock pulled back sharply last week with a long black candlestick and then recouped this loss with a surge back above 44.
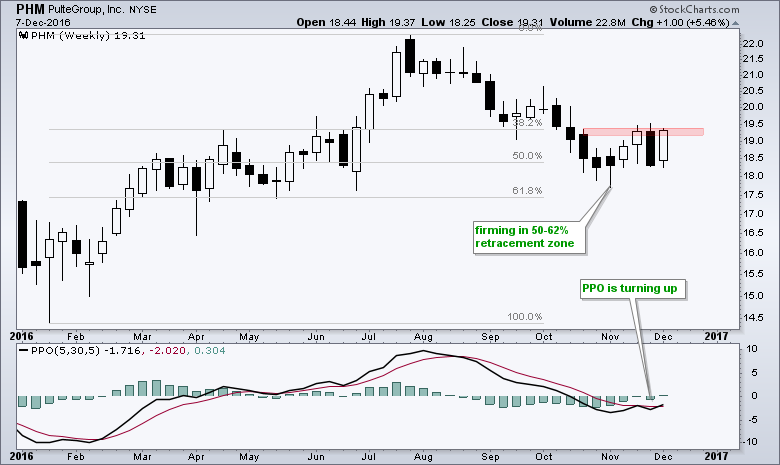
 Pulte Group surged the first seven months of the year and then retraced 50-61.8% of this advance with a decline into October. This advance-correction sequence could be two step forward and one step backward. PHM may now be about to start another leg higher because the weekly PPO (5,30,5) moved above its signal line for the first time since early August.
 ******************************************************
Spotting Pullbacks and Upturns within an Uptrend using RSI and MACD Histogram.
Defining Bull and Bear Market Environments with Breadth Indicators (plus video).
Backtesting Different Moving Average Pairs with SPY, QQQ and IWM.
ETF Master ChartPack - 300+ ETFs organized in a Master ChartList and in individual groups.
Follow me on Twitter @arthurhill - Keep up with my 140 character commentaries.
****************************************
Thanks for tuning in and have a good day!
--Arthur Hill CMT
Plan your Trade and Trade your Plan
*****************************************


