Broad Market Breadth Corrects During Consolidation .... Still Far from Bearish Breadth Signals .... New Highs Shrink, but New Lows have yet to Appear .... Over 70% of Stocks remain above 200-day EMAs .... Identifying Pullbacks with %Above 20-day EMA .... //// ....
The S&P 500 consolidated with a trading range the last five weeks and breadth corrected during this consolidation. The chart below shows the S&P 500 with three breadth indicators for the S&P 1500: the 10-day EMA of AD% ($SUPADP), High-Low%($SUPHLP) and %Above 200-day EMA (@GT200SUP). The latter (@GT200SUP) is a user-defined index created using data from !GT200SPX, !GT200MID and !GT200SML. To recap, the 10-day EMA of AD Percent turns bullish with a surge above +30% and remains bullish until a move below -30%, which is bearish. High-Low Percent turns bullish with a above +10% and bearish with a move below -10%. The %Above 200-day EMA turns bullish with a move above 60% and bearish with a move below 40%. You can read more about these indicators in these three articles: AD Percent, High-Low Percent, and %Above 200-day EMA. The indicators have been net bullish since March 31st (2 of 3 with bull signals).
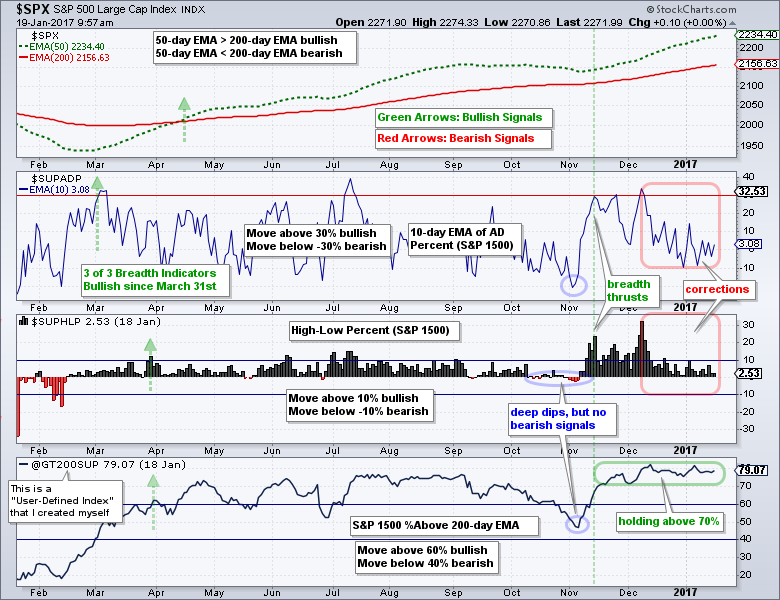
There are two items worth noting. First, the blue ovals in early November mark corrections when all three indicators declined. Notice that all three held above their bearish thresholds and turned up in early November. Corrections can look scary at the time, but we must keep in mind that the bigger trend is the dominant force. Second, AD Percent and High-Low Percent fell back in the second half of December and are slightly positive. This is basically a correction after the indicators surged from mid November to mid December. These indicators are not even close to turning bearish because selling pressure has been quite mild the last five weeks. Notice that the %Above 200-day EMA has been above 70% since mid November. I do not know when these indicators will trigger bearish signals. All I can do is identify the levels and abide by the current signal.
Still Far from Bearish Breadth Signals
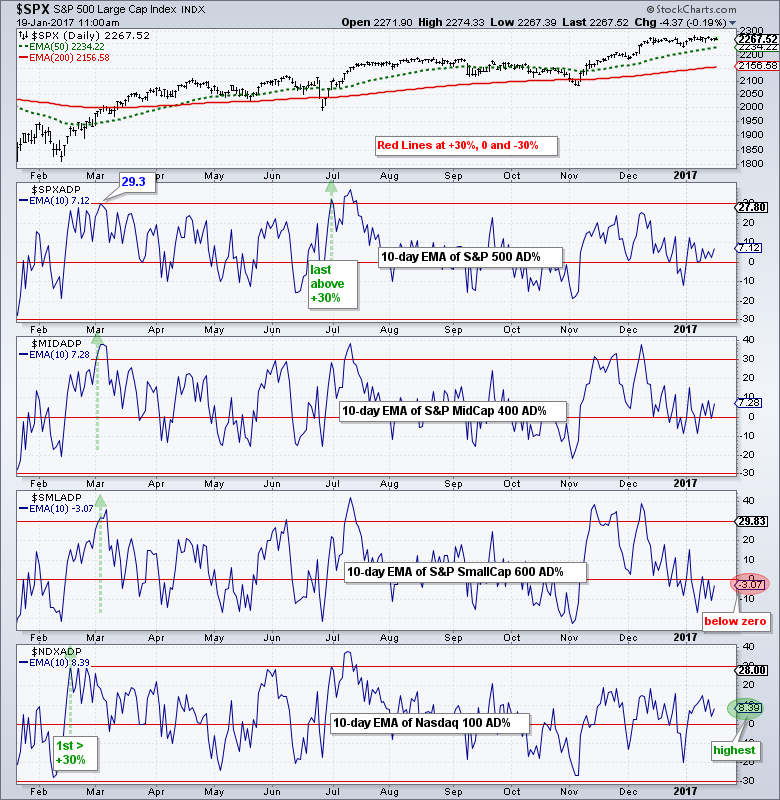
Chartists can analyze and compare individual breadth indicators for the S&P 500, S&P MidCap 400, S&P Small-Cap 600 and Nasdaq 100. The chart below shows the 10-day EMA of AD Percent for each index. This is the early warning indicator and usually the first to trigger a signal. Note that the Nasdaq 100 was the first to trigger bullish in mid February (move above +30%). The S&P Small-Cap 600 and S&P MidCap 400 followed with signals in early March, but the S&P 500 fell short (29.3%). $SPX ultimately triggered bullish with a move above +30% in late June. All four indicators are considered bullish until they move below -30%, which is still quite far away. I will not even consider the possibility of a bear market until two of these trigger bearish signals. The S&P 500, S&P MidCap 400 and Nasdaq 100 are still positive with the Nasdaq 100 the highest (+8.4%). The S&P Small-Cap 600 is negative (-3%) and the weakest of the four.
New Highs Shrink, but New Lows have yet to Appear
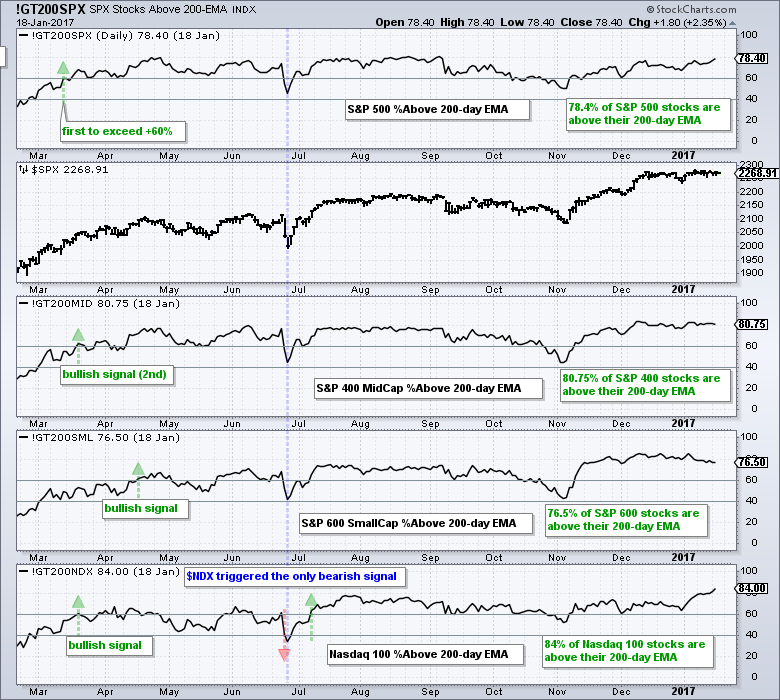
The chart below shows the %Above 200-day EMA for each index. Chartists can use this indicator to rank the different indexes. The highest values show the most internal strength. Notice that 84% of stocks in the Nasdaq 100 are above their 200-day EMA. This makes it the strongest index of the four. Also notice that all four indicators are above 70%. It is hard to have a bear market with such broad internal strength.
Over 70% of Stocks remain above 200-day EMAs
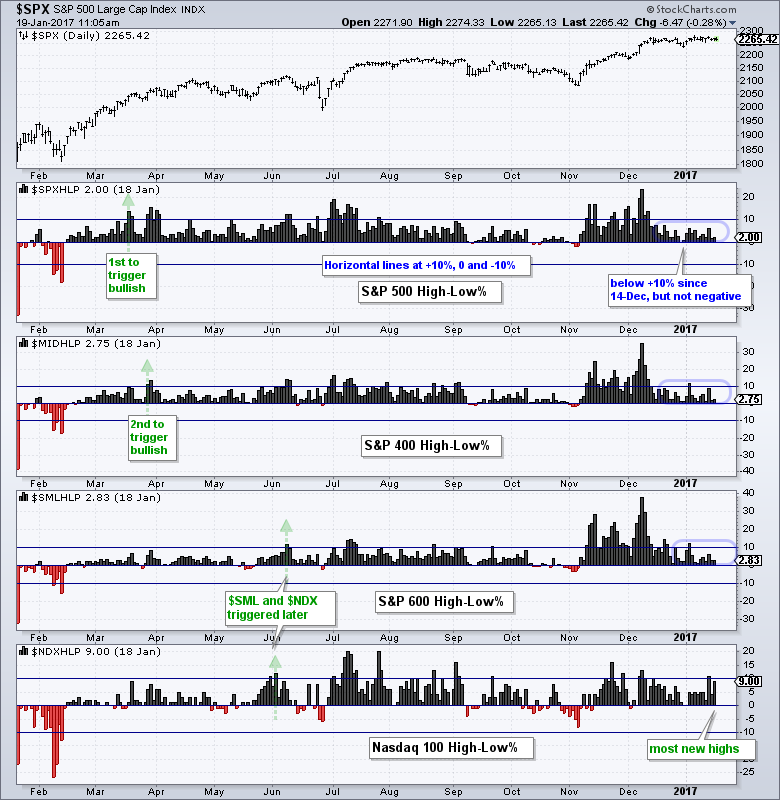
The next chart shows High-Low Percent for the same four indexes. Relative to AD Percent and %Above 200-day EMA, this indicator can be a laggard and the last to turn. Notice that S&P 500 High-Low% ($SPXHLP) was the first to trigger with a move above +10% in mid March. S&P 400 High-Low% ($MIDHLP) followed suit with a signal in late March. S&P 600 High-Low% ($SMLHLP) and Nasdaq 100 High-Low% ($NDXHLP) triggered much later with signals in June. Once the S&P 500 and S&P MidCap 400 triggered bullish, the S&P 1500 High-Low% ($SUPHLP) also triggered bullish and this set the bullish tone for the broader market. Currently, High-Low Percent has been below 10% for the three S&P indexes, but we have yet to see this indicator turn negative because new lows are not expanding. The Nasdaq 100 is the leader with 9% of its components hitting new highs on Thursday.
Identifying Pullbacks with %Above 20-day EMA
The first chart showed broad market breadth turning net bullish at the end of March. This means we are in a bull market. This is the most important signal because it establishes my trading bias for the broad market indexes. I want to look for short-term oversold conditions and bullish setups in a bull market. Conversely, I want to ignore short-term overbought conditions and bearish setups. I have shown how to find short-term oversold setups using 5-day RSI and today I will show how the use the %Above 20-day EMA to identify short-term pullbacks.
The chart below shows the %Above 20-day EMA for the four major indexes. The red lines mark 30% and 70%, while the blue lines mark 50%. A move below 30% signals a short-term pullback because it means less than 30% of stocks are above their 20-day EMA. Put another way, more than 70% are below their 20-day EMA. This may seem short-term bearish, but keep in mind that I am banking on the bigger uptrend, which is the dominant force, reasserting itself. The short-term oversold setups are marked with the green ovals. The subsequent green arrows mark when the indicator moves above 50%, which signals that the majority of stocks have turned up and the market may also be turning back up. The longest green arrows show the last three signals for the S&P 500.
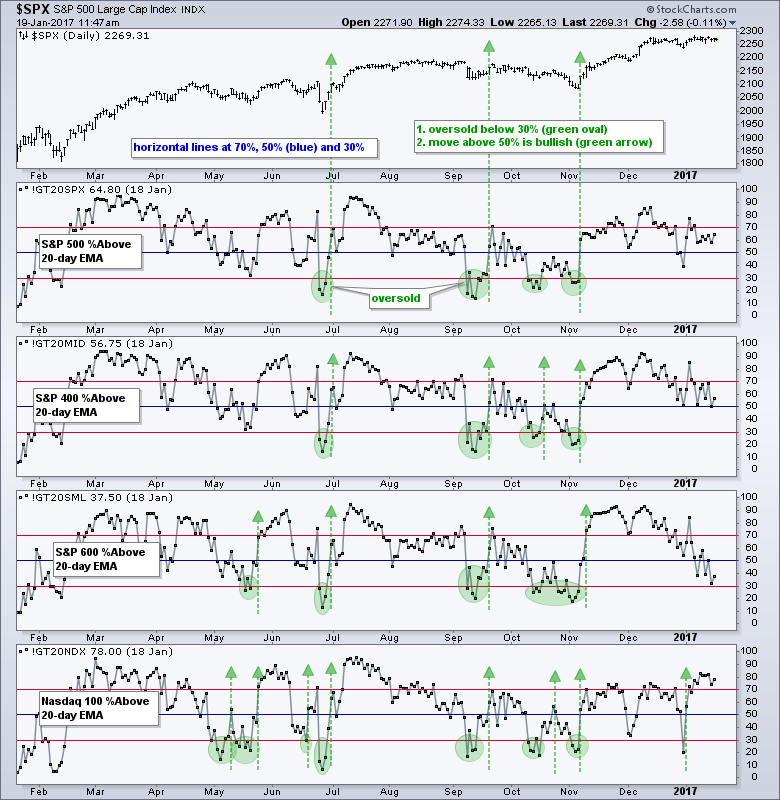
Not every signal is a winner because there were some bad signals in September and October. We cannot expect perfection. This is just another way to trade pullbacks when the bigger trend is up. I think the best signals occur when three of the four indicator move below 30% and then three of the four move above 50%. The Small-Cap %Above 20-day EMA (!GT20SML) is currently the closest to a bullish setup because it is at 37.5% right now. However, the other indicators are not even close to signalling a short-term pullback.
******************************************************
Spotting Pullbacks and Upturns within an Uptrend using RSI and MACD Histogram.
Backtesting Different Moving Average Pairs with SPY, QQQ and IWM.
Difference between EMA and SMA - Using %Above 200-day EMA for Breadth Analysis.
ETF Master ChartPack - 300+ ETFs organized in a Master ChartList and in individual groups.
Follow me on Twitter @arthurhill - Keep up with my 140 character commentaries.
****************************************
Thanks for tuning in and have a good day!
--Arthur Hill CMT
Plan your Trade and Trade your Plan
*****************************************


