Small-caps Pull back after Big Surge .... SPY Stalls Near 52-week High .... QQQ and its Top Components Lead .... Five Sectors within 2% of 52-week Highs .... Consumer Discretionary and Materials Hold Breakouts .... Finance and Industrials Extend High-Level Consolidations .... Healthcare is the Most Challenging Sector .... Utilities and Staples Remains the Laggards .... //// ....
---- Art's Charts ChartList (updated 17-Jan) ---- Webinar Video ----
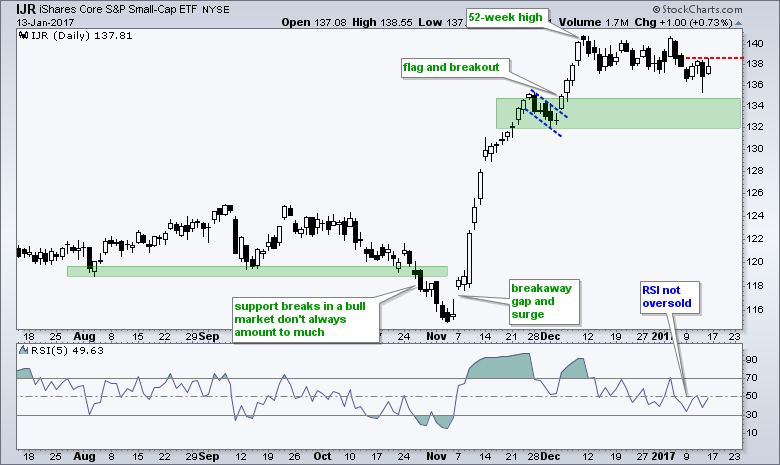
Small-caps Pull back after Big Surge
There are a lot of tight consolidations as we head into earnings season, but chartists should keep the bigger trends in mind. QQQ hit a new high on Friday, SPY hit a new high six days ago and IJR hit a new high on December 9th. The new high parade suggests that QQQ is leading because it has the most recent new high. IJR is lagging because it hit a new high 23 days ago. I do not consider a few weeks of relative weakness in small-caps as bearish because the bigger trends are clearly up. In other words, the slow decline in IJR over the last four weeks is a correction within a bigger uptrend. There are two things to watch on the IJR chart. First a breakout at 138.6 would provide the first signal that this correction is ending. Second, a deeper correction and dip below 30 in 5-day RSI would create a short-term oversold condition (bullish setup). There is also a possible support/reversal zone in the 132-134 area to watch.
SPY Stall Near 52-week High
I think there is only one chart we need to watch when it comes to the "stock market" and that is the S&P 500 (and SPY). The S&P 500 is the most widely followed benchmark, it accounts for around 80% of the US equity market and the golden cross works quite well. First, note that the 50-day EMA has been above the 200-day EMA since April 1st (bull market). Second, the ETF hit a new high on 17-Nov and again on 6-Jan. The long-term trend is clearly up and this sets my trading bias to bullish. I am looking for bullish setups in sector SPDRs, industry group ETFs and stocks. Furthermore, I am ignoring bearish setups and trying to focus on leaders (not laggards).
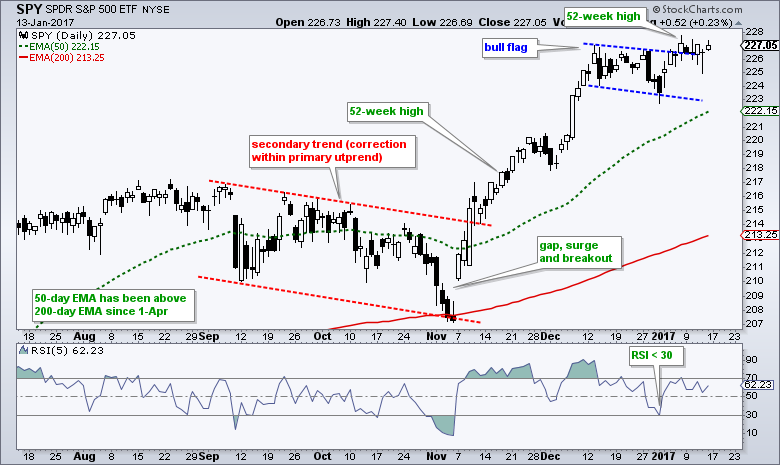
Short-term, the chart sports a bull flag in December and breakout in early January. Even though this breakout is looking shaky, I think a pullback would present a short-term bullish opportunity. As noted before, I am not keen on playing upside breakouts because of the reward-to-risk ratio. Instead, I prefer to look for short-term oversold conditions when the bigger trend is up. This means a dip below 30 in 5-day RSI would trigger a bullish setup.
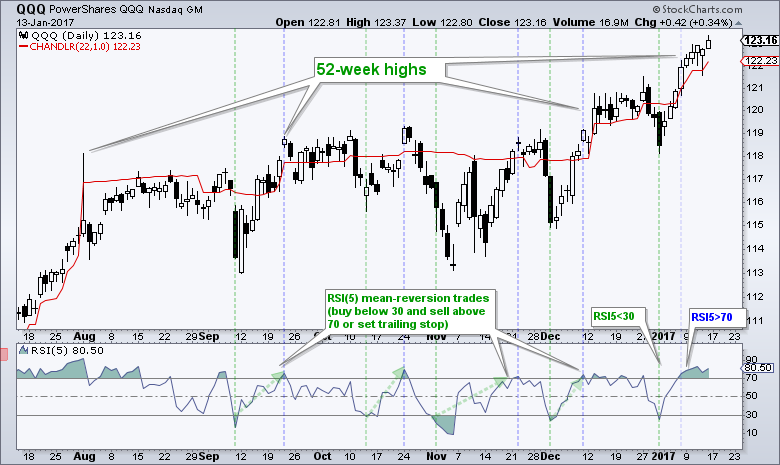
QQQ and its Top Components Lead
QQQ is the clear leader of the three major index ETFs (IJR, SPY, QQQ). Note that AAPL and NFLX hit 52-week highs last week. GOOGL and MSFT are in clear uptrends and less than 2% from 52-week highs. AMZN and FB surged the last two weeks and they are less than 5% from their 52-week highs. These six stocks account for over 40% of the ETF. NFLX is a pretty small component at just 1%. On the chart below, QQQ became oversold on 30-Dec when RSI(5) dipped below 30. The ETF is now up around 4% from the 30-Dec close. The Chandelier Exit (22,1) marks a potential trailing stop-loss at 122.23.
Five Sectors within 2% of 52-week Highs
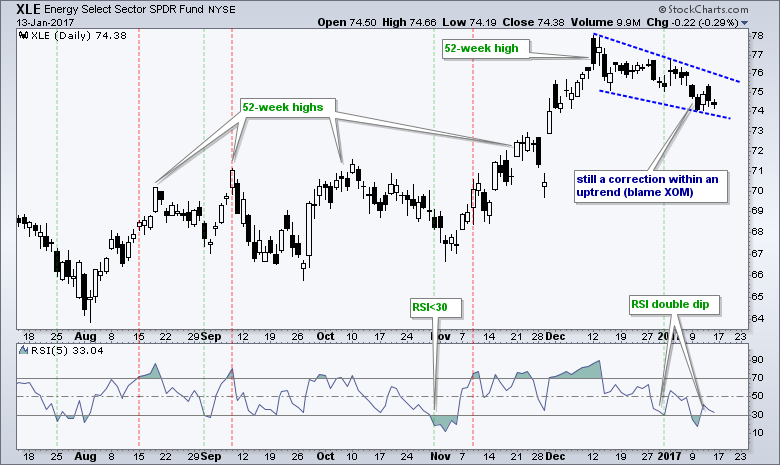
On a close-only basis, four of the five sector SPDRs are within 1% of a 52-week high (XLK, XLY, XLI, XLB), and XLF is 1.2% from a closing 52-week high. Thus 5 of the nine sectors are VERY close to 52-week highs and in long-term uptrends. The other four sectors are 6.5% to 7.5% below their 52-week highs and these are the weakest sectors right now (XLE, XLV, XLP, XLU). Of these four, XLE is the only one to hit a 52-week high within the last few months (December to be precise).
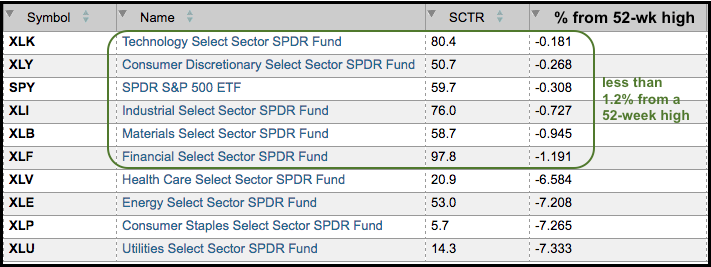
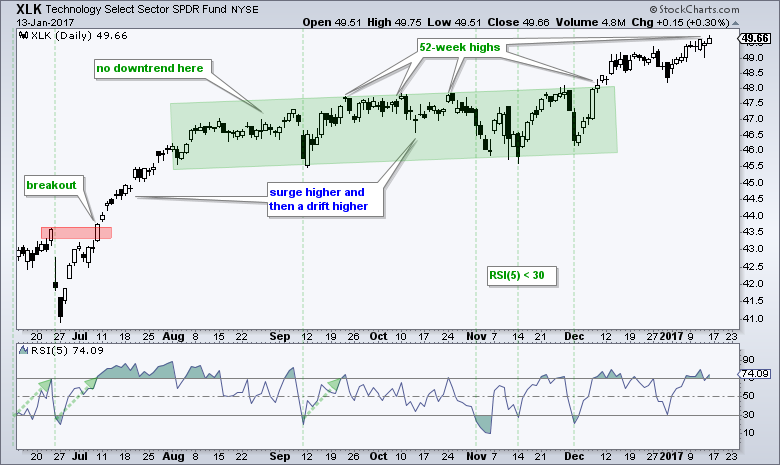
The Technology SPDR (XLK) is the clear "chart" leader with a fresh 52-week high on Friday. The ETF may be extended, but the trend is clearly up and pullbacks should be used as opportunities.
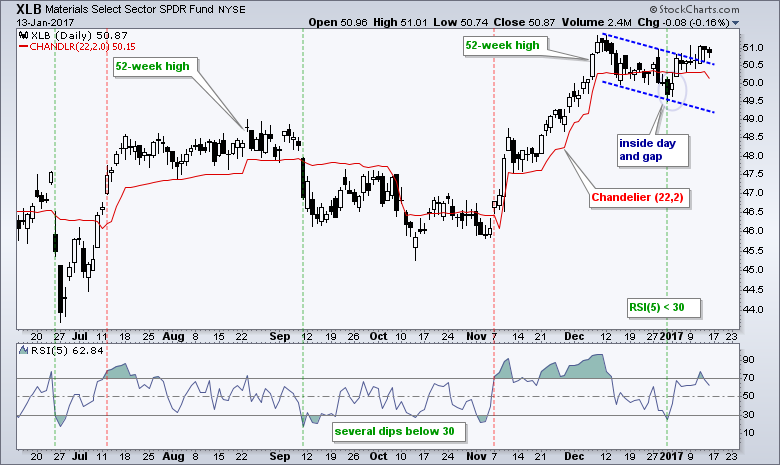
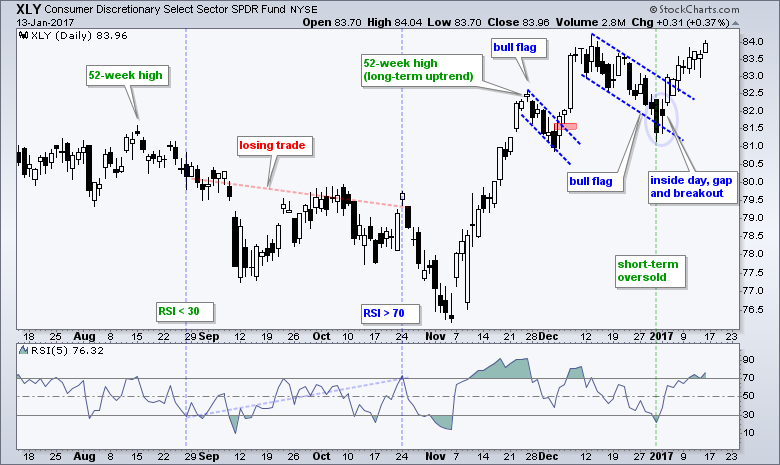
Consumer Discretionary and Materials Hold Breakouts
The Consumer Discretionary SPDR (XLY) and Materials SPDR (XLB) hit new highs in mid December, corrected with falling flag type patterns and broke out. XLY broke out first with a move in early January. XLB broke out second with a move last week. Even though these breakouts may not provide the best trade signals because of the reward-to-risk ratio, they are bullish developments on the chart because they reflect buying pressure. As far as tradable signals, notice that RSI(5) dipped below 30 on December 30th and inside days formed on January 3rd.
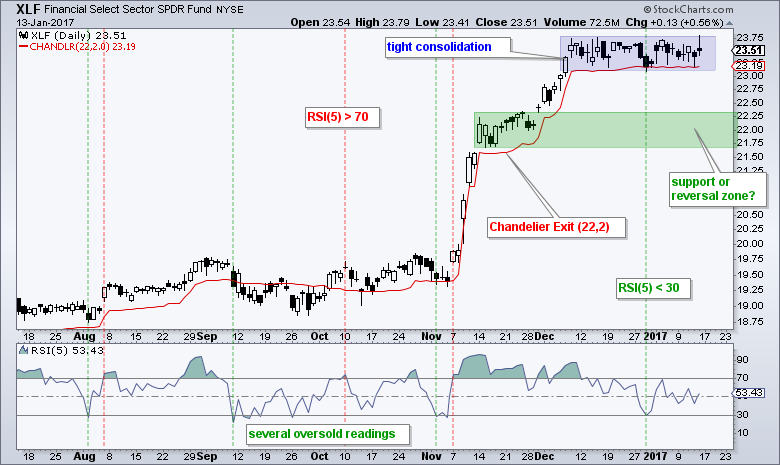
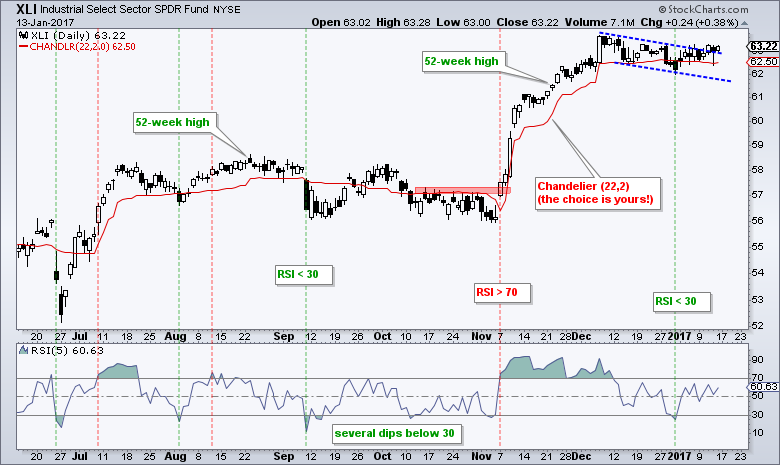
Finance and Industrials Extend High-Level Consolidations
The Finance SPDR (XLF) and Industrials SPDR (XLI) remain stuck in consolidations. XLI formed a falling flag over the last four weeks and edged above the upper trend line last week. XLF formed a flat flag and remains within this tight trading range. Notice that both were short-term oversold on December 30th when RSI dipped below 30. While breaks below the 30-December lows would be negative in the classical charting sense, I would not consider such moves very bearish because the long-term trends are clearly up. In other words, I am ignoring short-term bearish signals when the bigger trend is clearly up.
 The Energy SPDR (XLE) hit a 52-week high in mid December and then corrected with a falling wedge. RSI(5) dipped below 30 twice in the last two weeks and the SPDR remains with a short-term bullish setup. Note that oil is up around 1.5% in trading this morning.
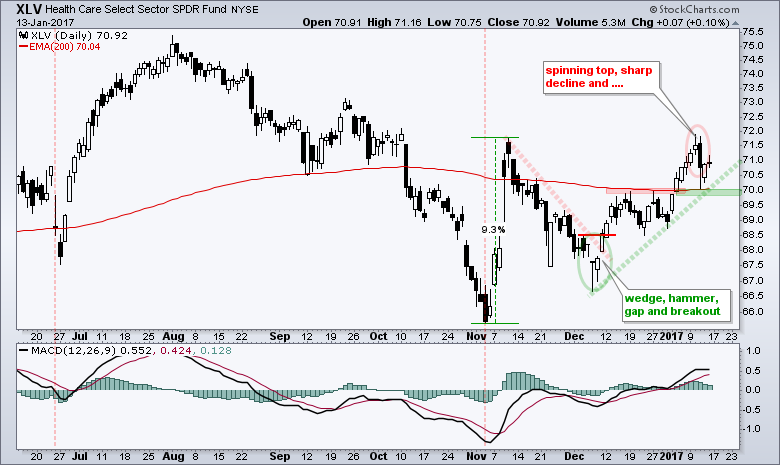
Healthcare is the Most Challenging Sector
The HealthCare SPDR (XLV) is perhaps the most difficult sector to analyze right now. First, note that XLV has traded flat for around two years now. Second, the ETF has seen three big swings since early November. At this point, I am watching the swings quite closely for early signals. The current swing is up with the breakouts in mid December and early January. Broken resistance, last week's low and the December trend line mark upswing support around 70. A close below 69.8 would reverse this upswing.
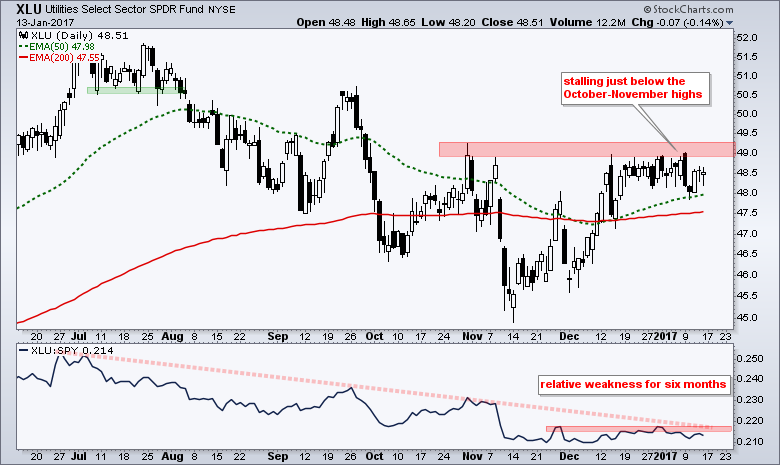
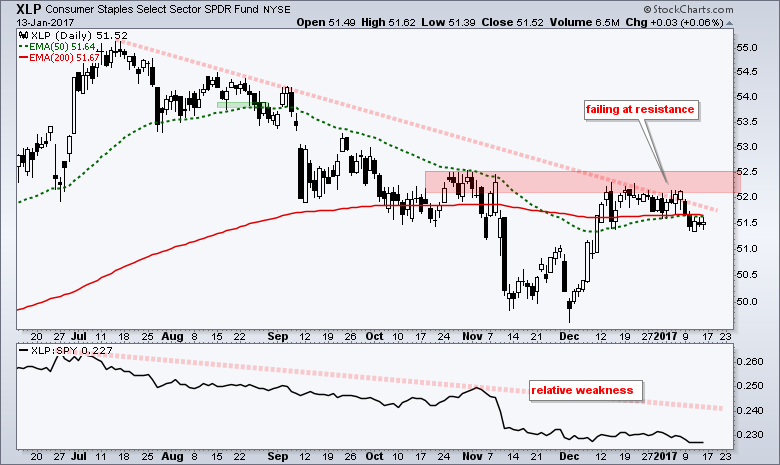
Utilities and Staples Remains the Laggards
The Utilities SPDR (XLU) and Consumer Staples SPDR (XLP) are the clear laggards of the nine sector SPDRs. Both hit resistance near the October-November highs and stalled over the last few weeks. Admittedly, the consolidations over the last 4-5 weeks could be flag-like patterns after the early December surge. Even so, these two sectors are at the bottom of my list for two reasons. First, we are in a bull market and this favors the "offensive" sectors, not the defensive sectors. Second, they are well below their 52-week highs and underperforming the broader market.
*****************************************************
Spotting Pullbacks and Upturns within an Uptrend using RSI and MACD Histogram.
Defining Bull and Bear Market Environments with Breadth Indicators (plus video).
Backtesting Different Moving Average Pairs with SPY, QQQ and IWM.
ETF Master ChartPack - 300+ ETFs organized in a Master ChartList and in individual groups.
Follow me on Twitter @arthurhill - Keep up with my 140 character commentaries.
****************************************
Thanks for tuning in and have a good day!
--Arthur Hill CMT
Plan your Trade and Trade your Plan
*****************************************


