QQQ Closes near another 52-week High .... Fab Five Holding Strong .... HealthCare SPDR Falls on Huge Volume .... Biotech ETFs Test Breakout Zones .... ITB Still Setting Up Bullish .... Watching MACD for a Reversal in Gold .... A Precarious Bounce for Treasury Bonds ... ChartList Update .... //// ....
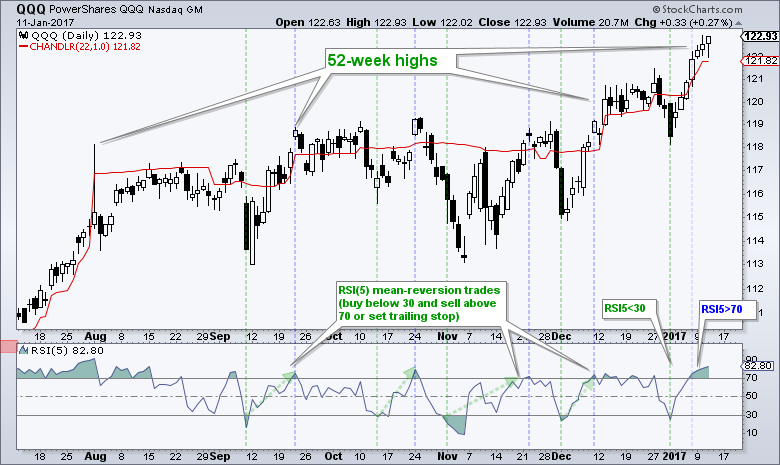
QQQ closed at the high of the day and very close to yet another 52-week high. The ETF could be short-term overbought and ripe for a pullback, but the long-term trend is clearly up and this is the dominant force at work. A pullback, should it occur, would likely provide the next bullish setup. The most recent short-term opportunity was when RSI(5) moved below 30 and QQQ became short-term oversold on 30-Dec. At this point, short-term traders might consider an exit strategy for any long positions or setting a trailing a stop-loss with the indicator of their choice. I like the Chandelier Exit because I fully understand how it works and what it is telling me.
The Art's Charts ChartList has been updated with 26 annotated stock charts.
Fab Five Holding Strong
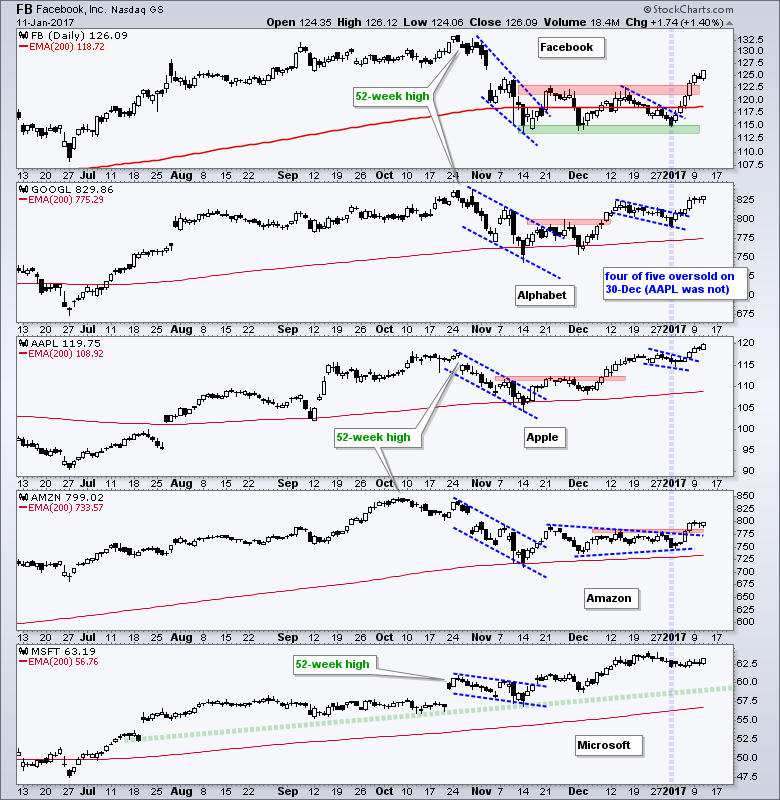
It is hard not to be bullish QQQ when looking at the top five stocks. The next chart shows Facebook, Alphabet, Apple, Amazon and Microsoft (FAAAM), and these five account for around 40% of the ETF. First, all five hit 52-week highs in October (long-term uptrend). Second, they corrected with falling channels or wedges into early-mid November. The subsequent breakouts were mixed and then four of the five became short-term oversold on 30-Dec (blue vertical line). RSI(5) did not dip below 30 for Apple and this was a sign of relative strength. 2017 has gotten off to a strong start with breakouts in Amazon, Alphabet and Facebook, and a 52-week high in Apple. Microsoft barely bounced, but remains in a steady uptrend. Note that GOOGL, AMZN and MSFT report earnings on 26-Jan, Apple reports on 31-Jan, and Facebook reports on 1-Feb.
HealthCare SPDR Falls on Huge Volume
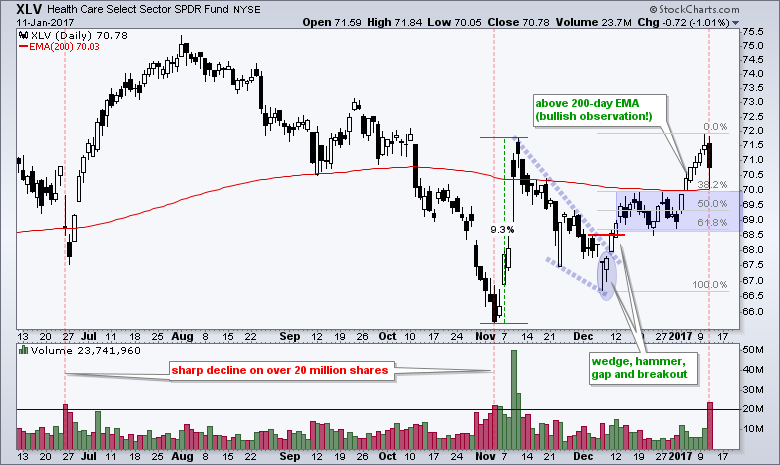
The HealthCare SPDR (XLV) fell on high volume on Wednesday. While this may seem bearish, the chart shows the last two times XLV fell with volume exceeding 20 million shares (24-June and 3-Nov). I am not going to make a trading rule based on two observations, but these examples show why I do not use ETF volume in the traditional sense (OBV, Accumulation Distribution Line, Chaikin Money Flow). Instead, I think high volume declines mark a selling climax of sorts and should alert chartists to a potential bottom or reversal. On the price chart, XLV broke wedge resistance with on 9-Dec and broke out at 70 on 4-Jan. The blue zone marks a consolidation zone and some key retracements. This is the first area to watch for support and a short-term oversold reading.
Biotech ETFs Test Breakout Zones
A similar picture is unfolding for the Biotech iShares (IBB) and Biotech SPDR (XBI). Both surged and broke out this year and then fell back rather hard on Wednesday. The breakout zones and the 50-61.8% retracements are the first areas to watch for potential support and a short-term reversal.
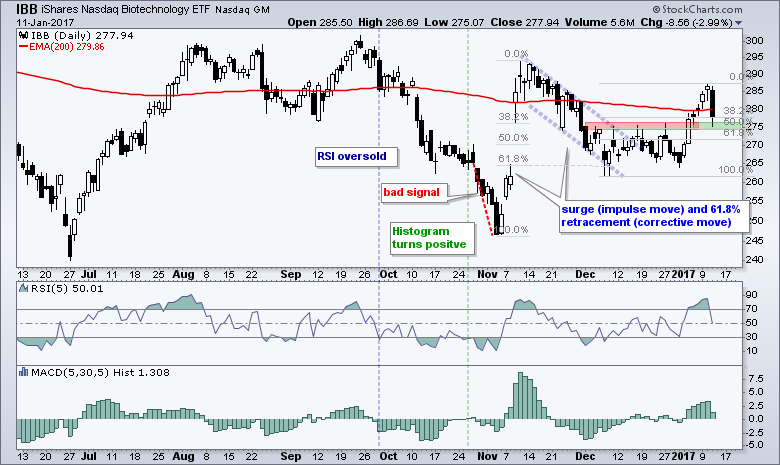
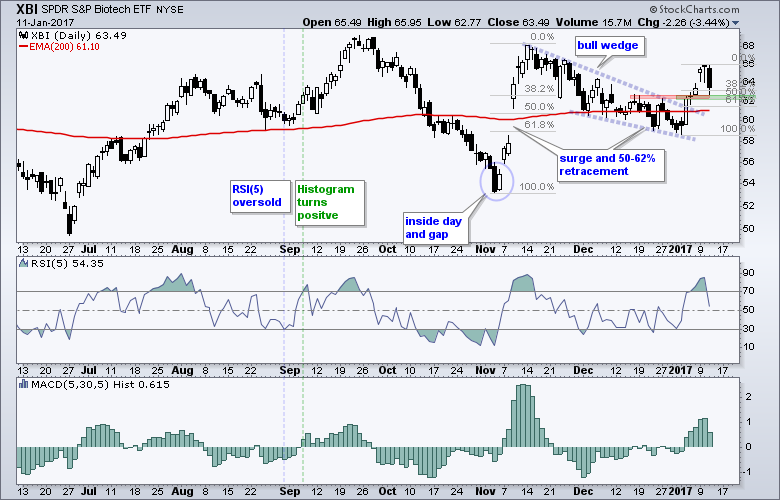
There are two choices when taking a bullish entry signal using a mean-reversion system. Traders can either buy when the momentum oscillator becomes oversold or wait for some sort of upturn. The XBI chart shows a strategy that uses 5-period RSI to identify oversold conditions and the MACD Histogram (5,30,5) to identify a short-term upturn. The setup occurs when RSI moves below 30 and the trigger fires when the histogram turns positive. An example is shown with the green and blue vertical lines. Biotechs are quite volatile and it sometimes helps to wait for a small upturn.
ITB Still Setting Up Bullish
The Home Construction iShares (ITB) still has a bullish setup working with a falling wedge after a big surge. This wedge looks like a correction and a breakout at 28.3 would reverse this short-term slide.
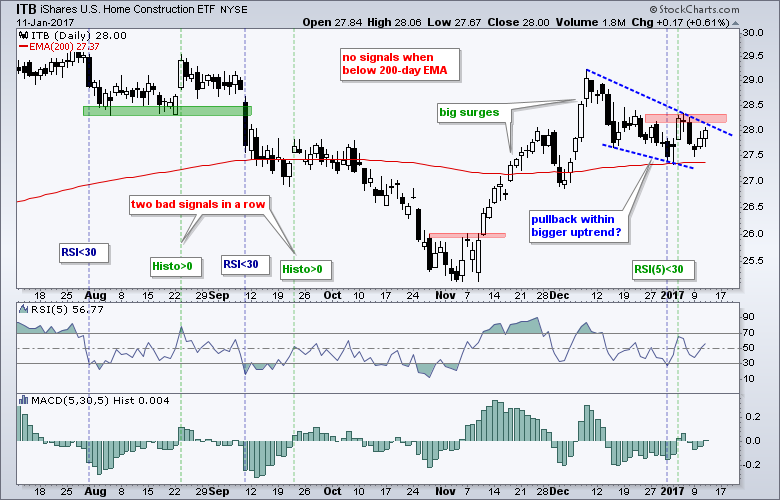
I am also showing the system using RSI and the MACD Histogram for signals. The signals in August and September were not good and resulted in losses. There were no signals from mid October to mid November because ITB was below the 200-day EMA. A current signal is working as RSI moved below 5 on 30-Dec and the histogram turned positive two days later. I will update the Art's Chart ChartList by 9:30 ET and a number of housing stocks will be featured.
Watching MACD for a Reversal in Gold
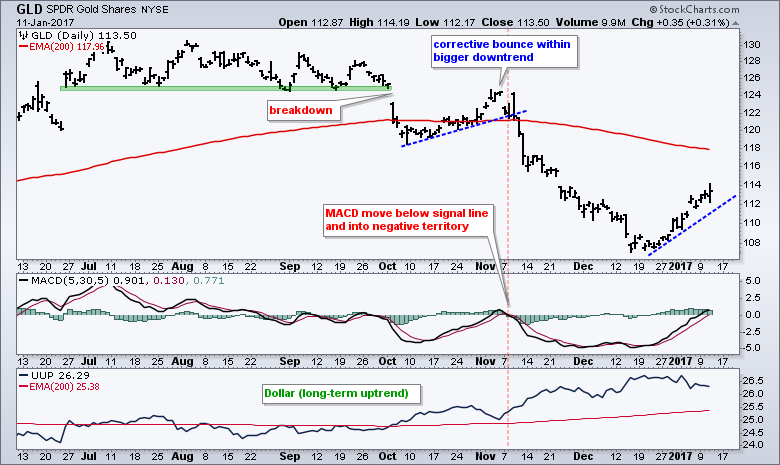
The Gold SPDR (GLD) sports a corrective bounce similar to the October bounce. Notice how GLD broke down in September and then bounced with a move back to the 124 area. This move ended when MACD moved below its signal line and into negative territory on 8-Nov. GLD is in the midst of another counter-trend bounce and MACD(5,30,5) just turned positive. A close below 112 or GLD and/or a MACD move below zero would signal a reversal of this corrective bounce.
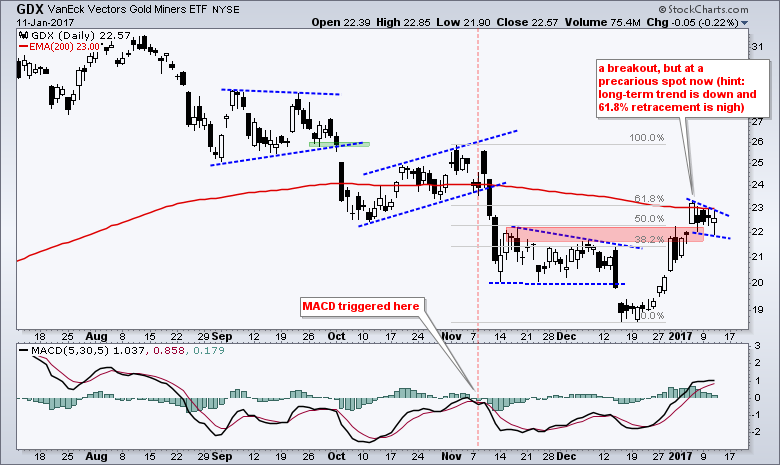
I featured the Gold Miners ETF (GDX) in Tuesday's webinar and still see a long-term downtrend. Admittedly, a small bullish pennant could be forming the last four days and a breakout at 23 would signal a continuation higher. Further strength is possible as long as gold holds its short-term uptrend. Watch out, however, if gold reverses.
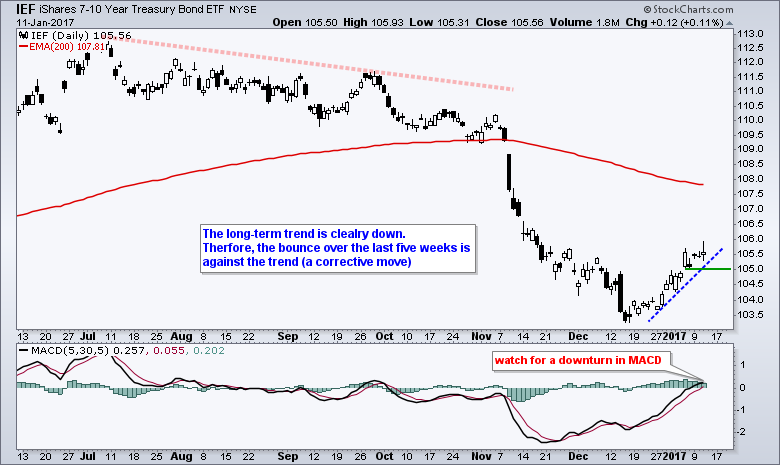
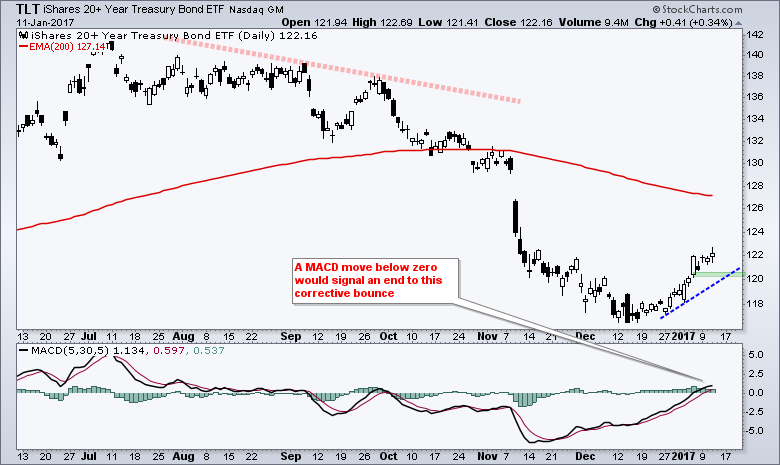
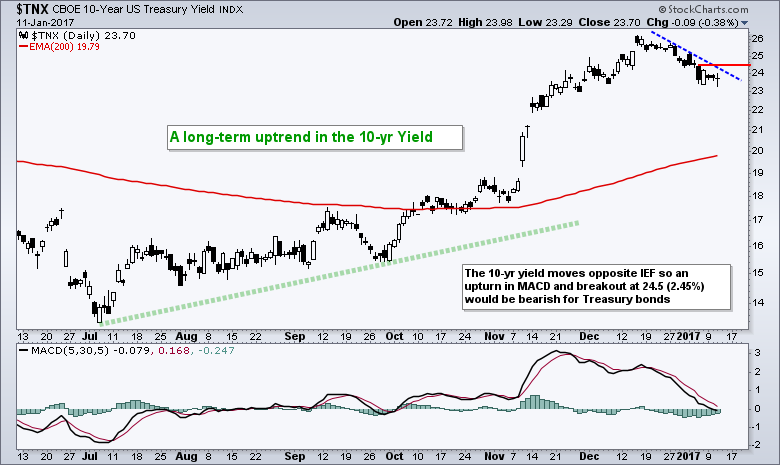
A Precarious Bounce for Treasury Bonds
The 7-10 YR T-Bond ETF (IEF) sports a bearish setup similar to gold. IEF is in a long-term downtrend and the ETF bounced over the last five weeks. This means the primary trend is down and the five week bounce is a secondary uptrend. In Elliott Wave terms, the decline from October to mid December was an impulse move and the bounce is a corrective move (counter-trend). The second trend is still up and MACD(5,30,5) just turned positive. Look for a break below 105 on the price chart and a MACD move below zero to reverse this uptrend. A break down in bonds could provide fuel for further gains in stocks.
******************************************************
Spotting Pullbacks and Upturns within an Uptrend using RSI and MACD Histogram.
Defining Bull and Bear Market Environments with Breadth Indicators (plus video).
Backtesting Different Moving Average Pairs with SPY, QQQ and IWM.
ETF Master ChartPack - 300+ ETFs organized in a Master ChartList and in individual groups.
Follow me on Twitter @arthurhill - Keep up with my 140 character commentaries.
****************************************
Thanks for tuning in and have a good day!
--Arthur Hill CMT
Plan your Trade and Trade your Plan
*****************************************


