----- Weekly Recap Video ----- Art's Charts ChartList -----
Weekly Recap Video .... A Pretty Normal Uptrend .... QQQ is Leading the Broader Market .... Small-caps Take a Rest .... Oil Continues to Grind Higher .... Energy SPDR Corrects within Uptrend .... Oil & Gas Equip & Services SPDR Outperforms XLE .... //// ....
A Pretty Normal Uptrend
The S&P 500 SPDR (SPY) bottomed in January-February, broke out in late February and advanced the next ten months with a pretty normal uptrend. Let's review this uptrend and see where we stand now. Overall, there were two corrective periods last year and several all time highs. The first correction formed a most ominous broadening formation and bottomed just after a "support" break. I say this with sarcasm because we should not be looking for bearish patterns after hitting all time highs and we should not take minor "support" breaks that seriously when the 50-day EMA is above the 200-day EMA. The trend is the dominant force and we should focus on patterns that match the trend, not contradict it.
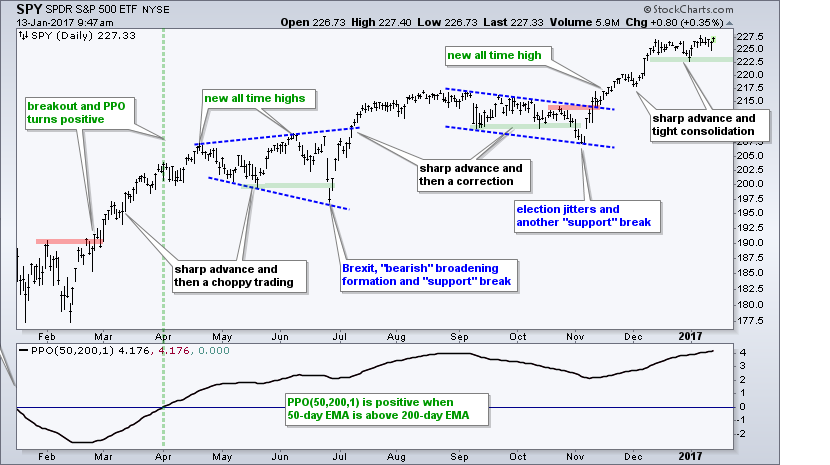
After hitting more all time highs in August, the ETF corrected with a garden-variety falling channel in September and October. Breadth indicators were deteriorating by early November and the ETF broke below the September-October lows on November 1st. A falling channel is normal for a correction and this one ended with a surge above 215 on November 9th. SPY went on to new all time highs yet again and then consolidated the last four weeks. This is a consolidation after a sharp advance and within a long-term uptrend. Thus, it is a bullish continuation pattern.
There are at least two big takeaways here. First, this daily chart provided just three big signals last year. These were the double bottom breakout in late February, the Brexit reversal and surge in July, and the channel breakout in November. 3-4 big signals per year is the most trader/investor can expect. Chartists need to see short-term mean-reversion techniques to generate more signals during the year. Second, be wary of so-called support breaks when the big trend is clearly up. Chartists need to step back and keep the bigger picture in mind. We should expect corrections in an uptrend and refrain from turning bearish during corrections.
QQQ is Leading the Broader Market
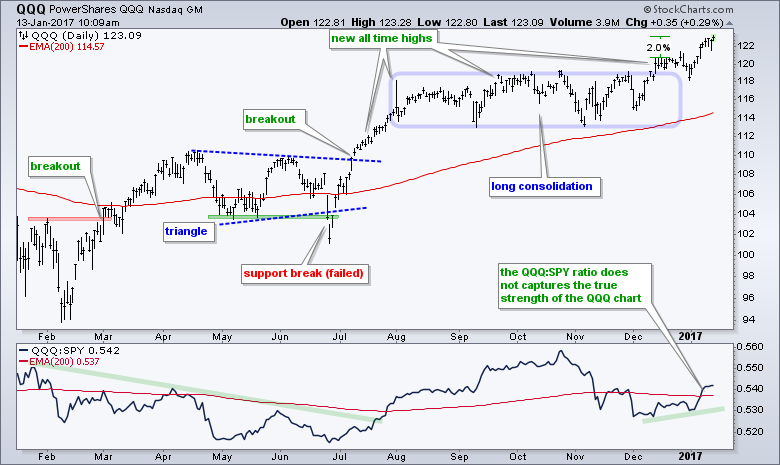
Even though the price relative (QQQ:SPY ratio) remains well below its October high, QQQ sports the stronger chart and shows price leadership. Notice that the ETF recorded new all time highs on December 13th, December 27th, and January 6th. QQQ is currently around 2% above its mid December high, while SPY is even with this high and IJR is just below this high. There is nothing but strong uptrend on this chart. I do not know how price action will unfold as we head into earnings season, but I think the 118-120 area will act as support on any pullback.
Small-caps Take a Rest
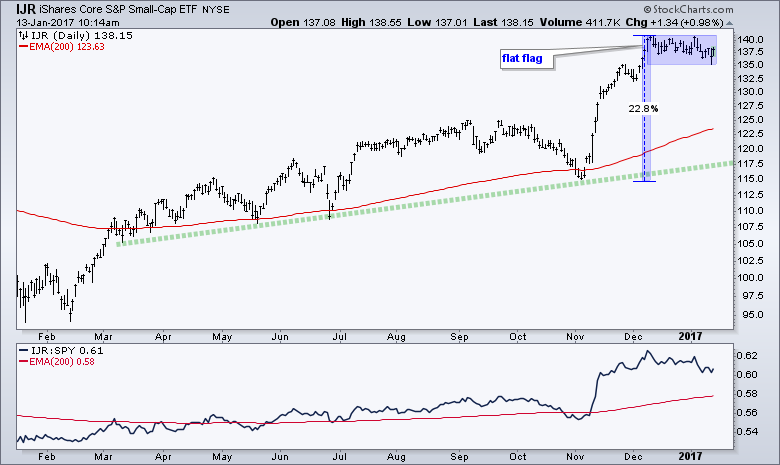
The S&P SmallCap iShares (IJR) surged over 20% and then traded flat the last 4-5 weeks. This looks like a text-book bull flag and a breakout would signal a continuation higher. While a break below 135 might seem negative, I would not turn bearish because we are in a bull market right now. This means a pullback would be viewed as an opportunity, not a threat.
Oil Continues to Grind Higher
Before looking at the charts for oil, note that I am using the Light Crude February Futures Contract (^CLH17) for analysis, not the USO Oil Fund (USO). As you can see by comparing the charts, USO does not track the futures contract step for step. This is usually the case when looking at six or more months of price action. Notice that USO has yet to exceed its June high, but the Futures Contract did exceed this high and shows a rising channel. I think the futures contracts are a much better representation for crude oil than USO. Chartists can use USO for short-term analysis and trading, but not for longer term analysis and definitely not for long-term investing.
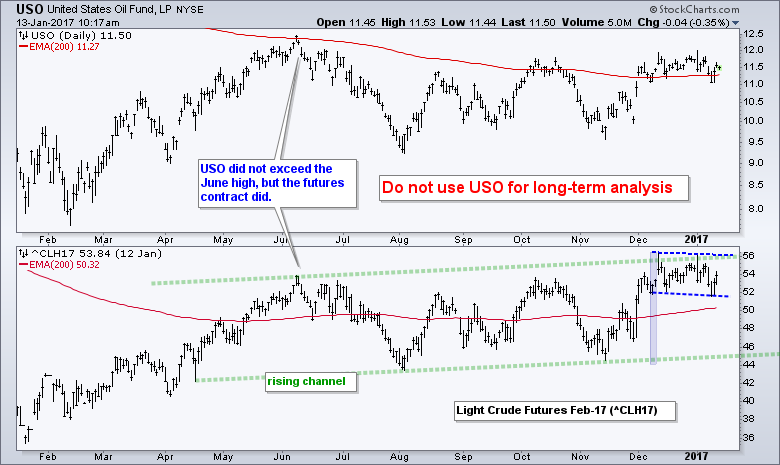
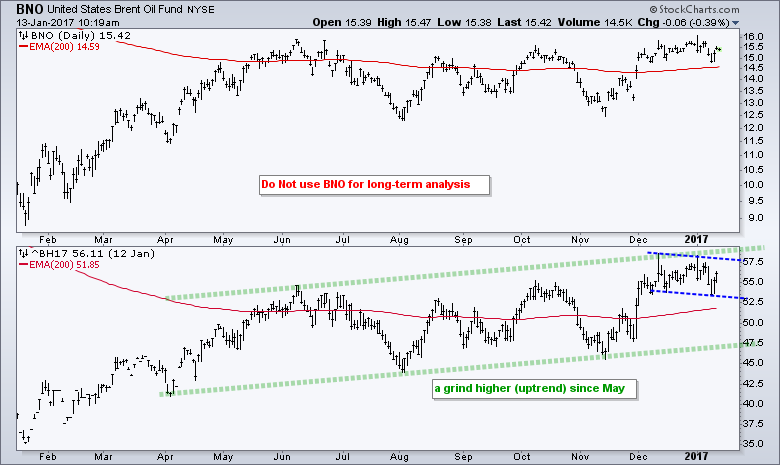
The February Light Crude hit a 52-week high in mid December and then moved into a consolidation the last few weeks (blue lines). The prior move was up (~44 to ~56) and this means we have a consolidation within an uptrend (bullish continuation pattern). Admittedly, oil has traded quite choppy since June. However, there is a clear upward bias on this chart and this should help energy-related shares. The next chart shows February Brent (^BH17) in a clear uptrend since April.
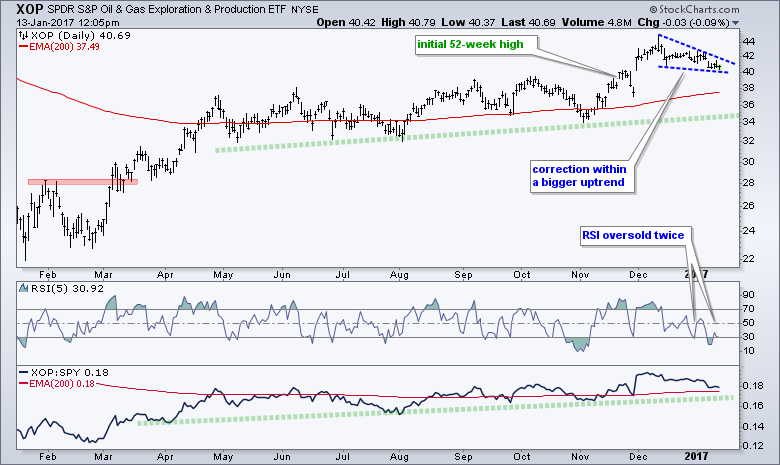
Energy SPDR Corrects within Uptrend
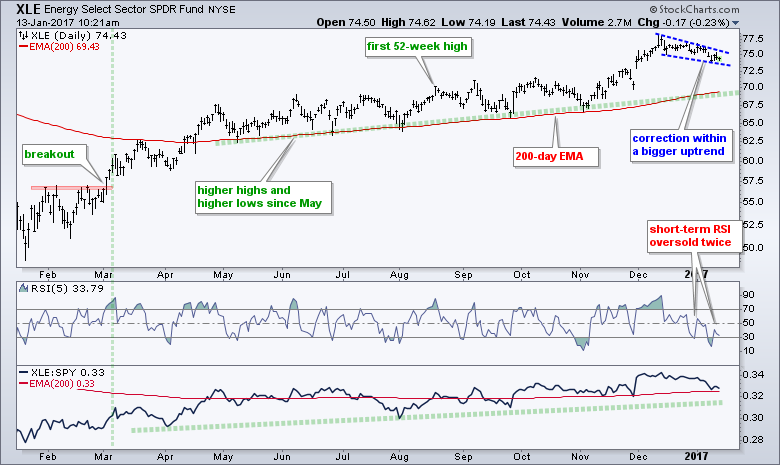
The Energy SPDR (XLE) is in a clear uptrend with a series of higher highs and higher lows the past year. The ETF hit its first 52-week high in August and most recent 52-week high in mid December. XLE corrected after this high with a falling wedge and short-term RSI became oversold twice. This looks like a classic pullback within a bigger uptrend. Look for a wedge breakout to signal an end to this pullback and a resumption of the bigger uptrend.
Oil & Gas Equip & Services SPDR Outperforms XLE
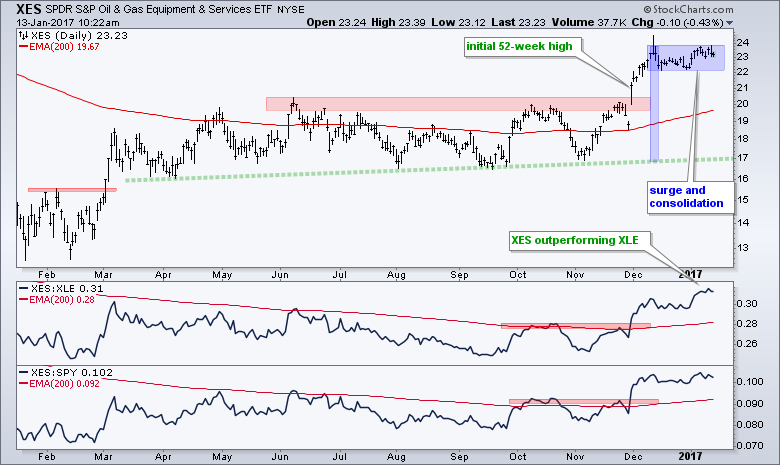
The Oil & Gas Equipment & Services SPDR (XES) moved sideways from March to November and then broke out with a big surge after the election. XES recorded an initial 52-week high during this surge and then consolidated. The long-term trend is clearly up when hitting a 52-week high and 52-week highs are usually not isolated events. In other words, I expect the uptrend to continue and more 52-week highs this year. Most recently, XES consolidated and the last four weeks and an upside breakout would signal a continuation higher. The first indicator window shows the XES:XLE ratio hitting a 52-week high as XES outperforms XLE.
******************************************************
Spotting Pullbacks and Upturns within an Uptrend using RSI and MACD Histogram.
Defining Bull and Bear Market Environments with Breadth Indicators (plus video).
Backtesting Different Moving Average Pairs with SPY, QQQ and IWM.
ETF Master ChartPack - 300+ ETFs organized in a Master ChartList and in individual groups.
Follow me on Twitter @arthurhill - Keep up with my 140 character commentaries.
****************************************
Thanks for tuning in and have a good day!
--Arthur Hill CMT
Plan your Trade and Trade your Plan
*****************************************


