----- Webinar Video ----- Art's Charts ChartList (updated 10-Jan) -----
QQQ and SPY Get Oversold Bounces .... IJR Fails to Hold Breakout .... Healthcare Leads in 2017 .... Biotechs Lead Healthcare Sector Higher .... Vanguard Financials and Regional Bank SPDR Extend Stall .... Housing and Retail Off to a Rough Start .... //// ....
Let's start out with a quick update on the RSI mean-reversion strategy. First and foremost, QQQ and SPY are in long-term uptrends as both hit 52-week highs in December and January. This means pullbacks present short-term opportunities - not threats. Second, both became short-term oversold when 5-day RSI moved below 30 on December 30th. This pullback created an opportunity to partake in the bigger uptrend.
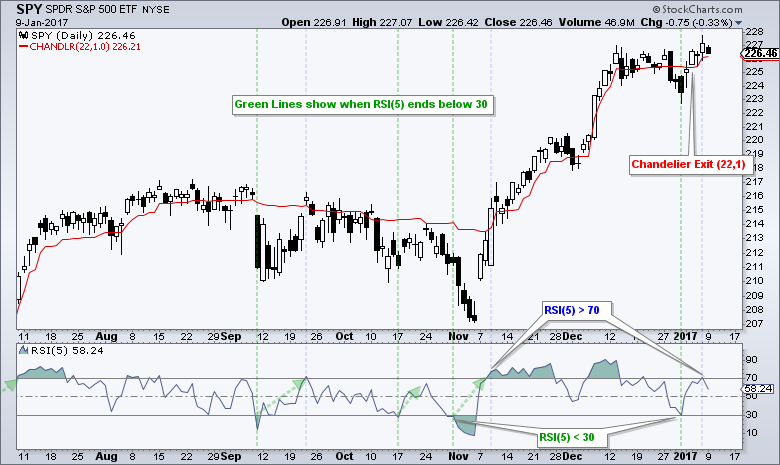
The chart above shows SPY edging higher the last four days and RSI moving above 70 on Friday. There are two possible exits for this strategy: exit when RSI moves above 70 or exit when SPY closes below the Chandelier Exit (22,1). The choice is yours, as is the choice for the Chandelier and RSI settings. Here is a link to the 9-Dec article outlining the RSI-Chandelier strategy.
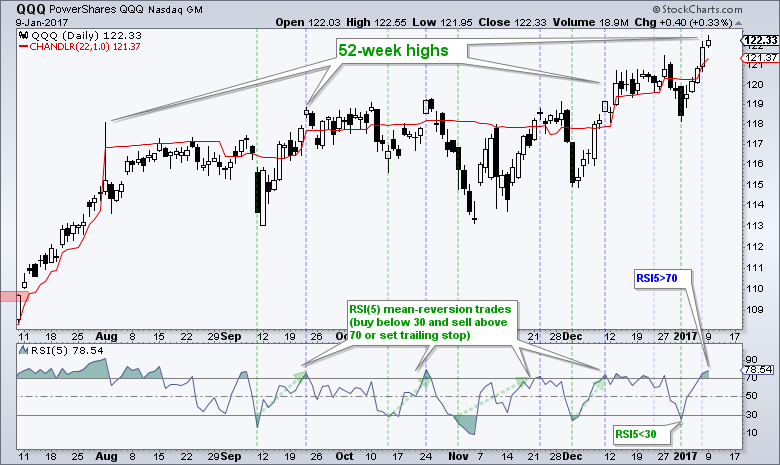
In addition to the RSI signals, the chart above shows QQQ with a clear and present uptrend. The ETF hit new highs from August to January and also formed a series of rising lows over the last five months. Furthermore, QQQ is currently above its December high. SPY fell back below its December high, while IJR and IWM fell back over the last three days.
IJR Fails to Hold Breakout
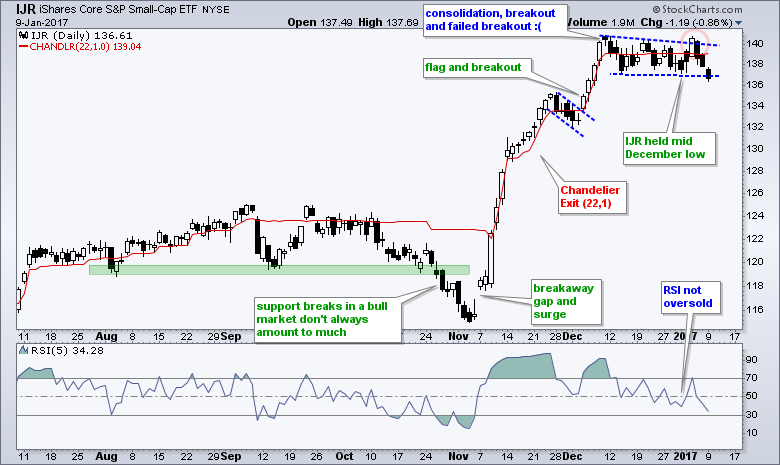
The next chart shows IJR with another one of those pesky failed breakouts. IJR closed above the pennant/wedge trend line on 4-January and then moved below the mid December low. As noted in Thursday's video (11:44 mark), it is a real challenge to trade breakouts because of the reward-to-risk ratio. Personally, I think breakouts and higher highs are more informational than actionable. A breakout signals a significant increase in buying pressure and a higher high affirms the uptrend. These are bullish events, but not always tradable. For trading, I am opting more for a mean-reversion strategy that seeks to take advantage of pullbacks within an uptrend. This means an opportunity will not present itself until RSI(5) dips below 30.
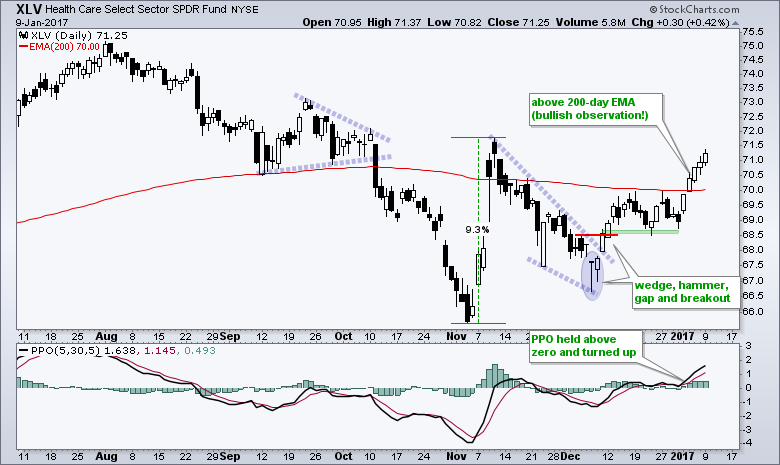
Healthcare Leads in 2017
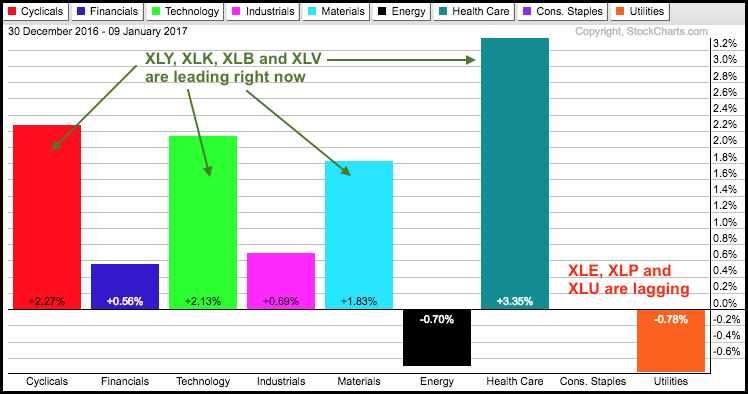
I was re-thinking the healthcare sector at yearend, but the HealthCare SPDR (XLV) ultimately held its breakout and zoomed higher the last five days. Thinking is very dangerous and it often pays to let the price chart do the thinking. In other words, a breakout or signal is valid until it is proven otherwise. XLV broke out with a gap, hammer and gap in the second week of December, held the breakout zone around 68.5 in December and zoomed above 71 this year. XLV is the best performing sector year-to-date. Consumer discretionary (cyclicals), technology and materials are the next best performing sectors.
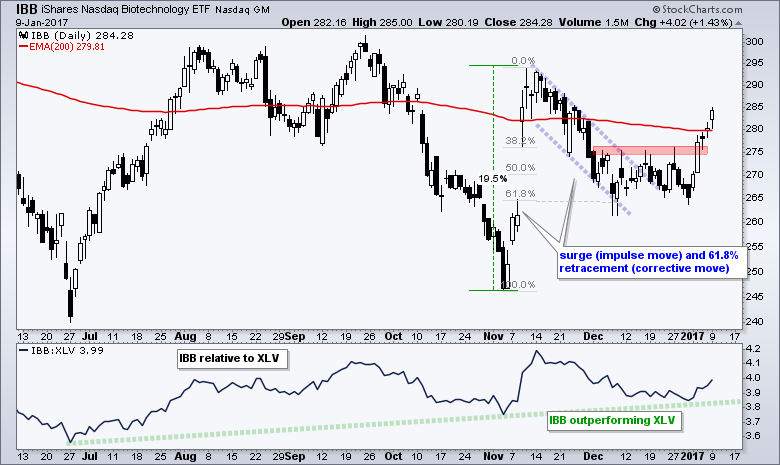
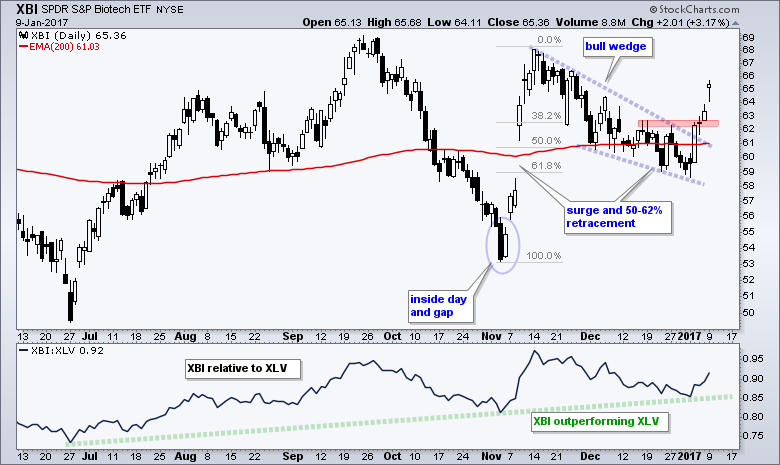
Biotechs Lead Healthcare Sector Higher
The Biotech iShares (IBB) and Biotech SPDR (XBI) surged over the last four days and broke resistance. I have been watching these two ever since they entered the 50-61.8% retracement zones in mid December. The early November surges looked like an impulse moves and the pullbacks looked like corrective moves. These are Elliott Wave terms, but I have no idea what wave this is and do not care to count because it is just too complicated. The breakout is important and signals a continuation of the prior advance. I will also cover the Medical Devices ETF (IHI) and HealthCare Providers ETF (IHF) in today's webinar.
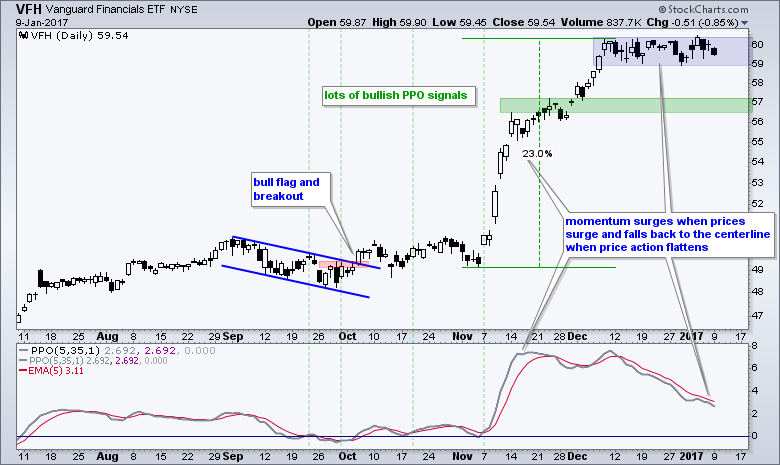
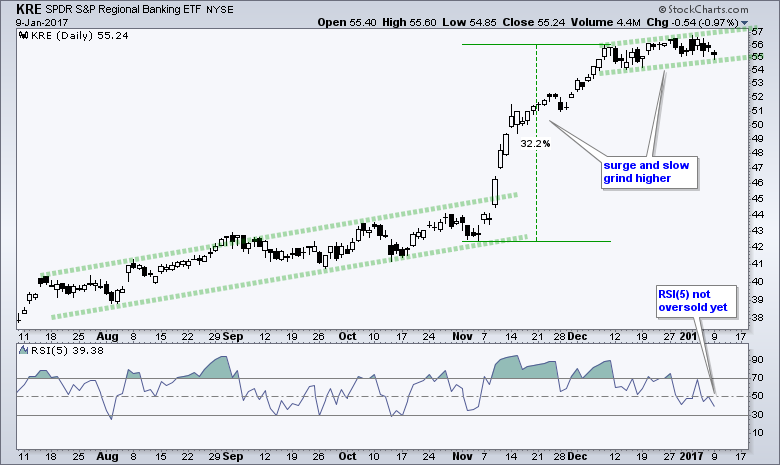
Vanguard Financials and Regional Bank SPDR Extend Stall
After a big surge from early November to early December, the Vanguard Financials ETF (VFH) and Regional Bank SPDR (KRE) stalled the last four weeks. A rest is quite normal after a 20+ percent surge. The indicator window shows the PPO (5,30,5) surging in early November, moving sideways and then falling over the last four weeks. This is normal for a momentum oscillator because momentum is flat the last four weeks. The PPO is just gravitating back to its centerline (0). I don't know how far the PPO will fall, but a move above the signal line would signal an upturn in momentum.
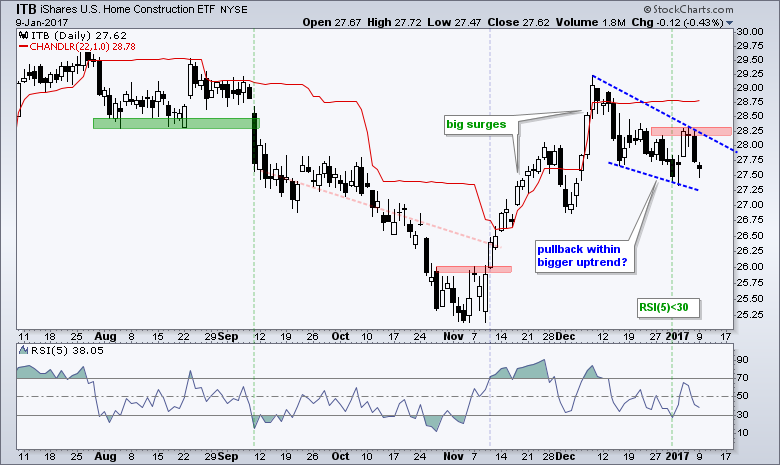
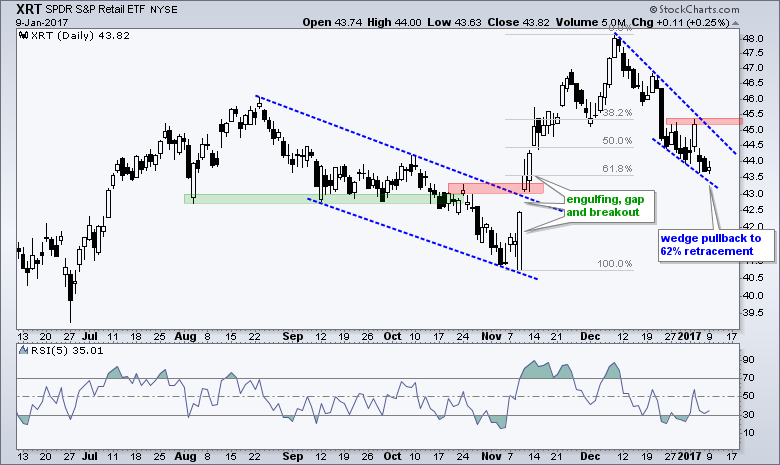
Housing and Retail Off to a Rough Start
The Home Construction iShares (ITB) and the Retail SPDR (XRT) are off to a rough start this year. Both surged on January 4th (last Wednesday), but fell back over the last three days. Overall, I am still intrigued because both surged from early November to mid December and then corrected with falling wedge patterns (kind of like the biotech ETFs). Again, it looks like the surge is an impulse move and the decline is a correction after this surge. This framework also fits with the primary and secondary trends in Dow Theory. A close above the early January highs would break wedge resistance and signal a continuation of the prior advance. I will discuss the RSI(5) signals in the webinar.
******************************************************
Spotting Pullbacks and Upturns within an Uptrend using RSI and MACD Histogram.
Defining Bull and Bear Market Environments with Breadth Indicators (plus video).
Backtesting Different Moving Average Pairs with SPY, QQQ and IWM.
ETF Master ChartPack - 300+ ETFs organized in a Master ChartList and in individual groups.
Follow me on Twitter @arthurhill - Keep up with my 140 character commentaries.
****************************************
Thanks for tuning in and have a good day!
--Arthur Hill CMT
Plan your Trade and Trade your Plan
*****************************************


