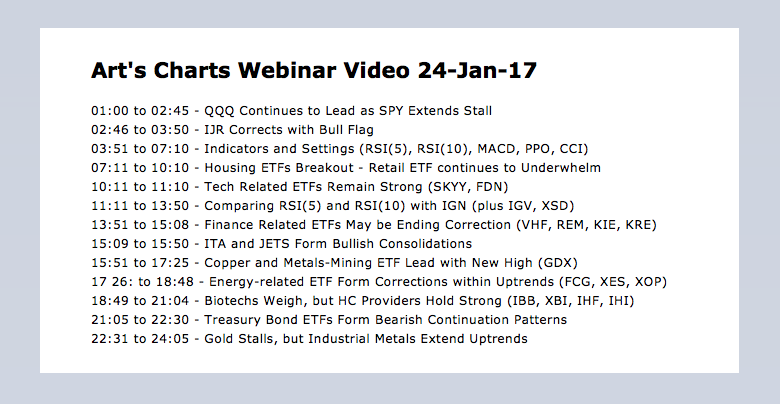
Webinar Video ..... QQQ Continues to Lead as SPY Extends Stall .... IJR Corrects with Bull Flag .... Indicators and Settings .... Housing ETFs Remain in Corrective Mode .... Retail ETF continues to Underwhelm .... Tech Related ETFs Remain Strong .... Comparing RSI(5) and RSI(10) with IGN .... Finance Related ETFs are Correcting .... RSI Enters Oversold Zone for KRE .... //// ....
----- Webinar Video ----- Art's Charts ChartList (updated 24-Jan) -----
QQQ Continues to Lead as SPY Extends Stall
The market is still in the post-surge funk with small-caps correcting (IJR), large-caps consolidating (SPY) and large-techs grinding higher (QQQ). Let's start with QQQ. As you will see from the industry group ETFs below, the tech-related industry groups are the strongest in the market right now. This is why QQQ is the strongest of the major index ETFs. The ETF became oversold 14 days ago when RSI(5) dipped below 30 and bottomed that very day. QQQ is now up 11 of the last 14 days and holding above the Chandelier Exit (22,1), which continues to rise along with the new highs. Short-term, there is nothing to do but remain in a holding pattern with a trailing stop-loss. 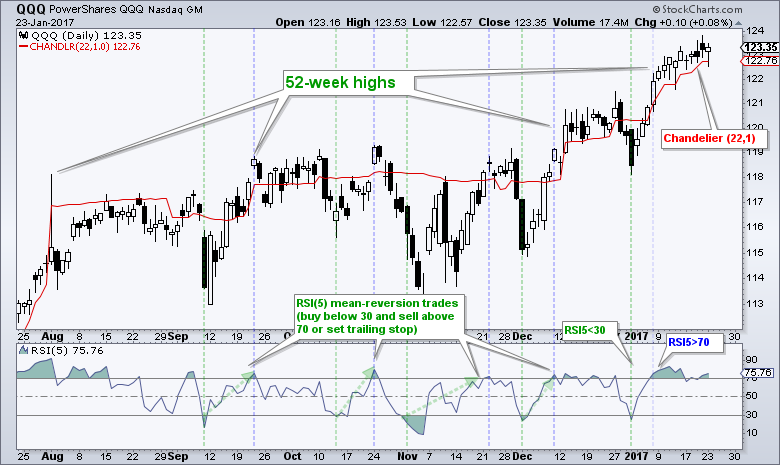
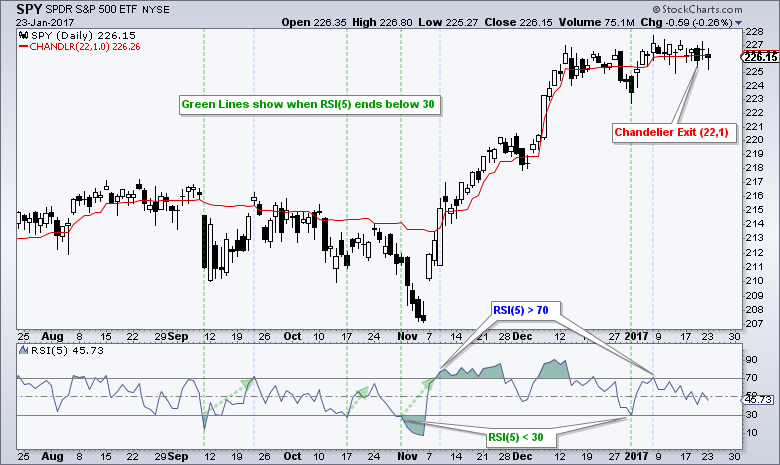
SPY also became short-term oversold 14 days ago and bounced with a move above 226. The ETF has been flat the last two weeks, but did manage to close below the Chandelier Exit (22,1) three days ago. Actually, SPY has been flat for 5 weeks because it first exceeded 126 on 13-Dec. This sideways action can be frustrating for short-term traders and chartists following every wiggle, but it is part of a bullish consolidation or correction when looking at the bigger trend (which is up).
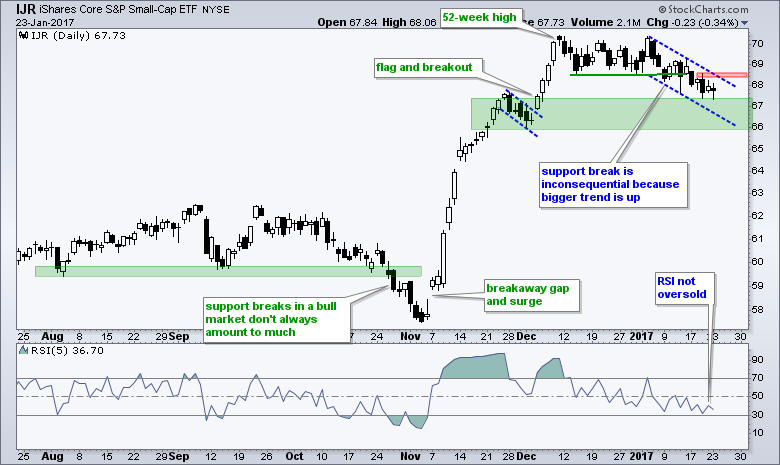
IJR Corrects with Bull Flag
Led by weakness in retail and banks, the S&P SmallCap iShares (IJR) corrected with a falling flag over the last 12 days. I am not concerned with the break below the mid December lows because the bigger uptrend is the dominant force. Instead, I am more interested in catching an oversold bounce within this bigger uptrend. RSI is nearing oversold levels (~30) and the ETF is near a potential reversal zone (green). A move above 68.5 would break flag resistance.
Indicators and Settings
The next charts focus on some of the key industry group ETFs that I follow with one year bar charts and 10-day RSI. It is impossible to pick the perfect momentum oscillator and with the perfect settings for each ETF. My favorite oscillators and settings include RSI(10), RSI(5), CCI(20), PPO (5,30,5) and MACD (12,26,9). The chart below shows SPY with these five indicators. They are more alike than different. The shorter the lookback period, the more sensitive the indicator. RSI(5) is more sensitive than RSI(10) and PPO (5,30,5) is more sensitive than MACD (12,26,9).
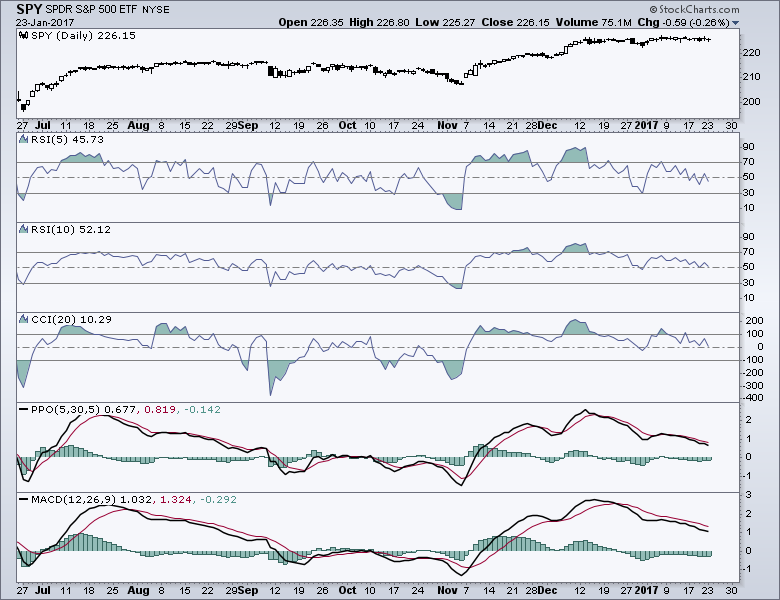
Note that CCI uses the high and low in its calculation and this means intraday spikes will affect the indicator. RSI, PPO and MACD use closing prices. I do not want to see all indicators because I want to analysis paralysis and multicolinearity, which is using the same type of indicator more than once. Note that our very own Greg Morris just penned an article covering Diversification and Multicollinearity. The choice of indicator and settings is a personal decision.
Housing ETFs Remain in Corrective Mode
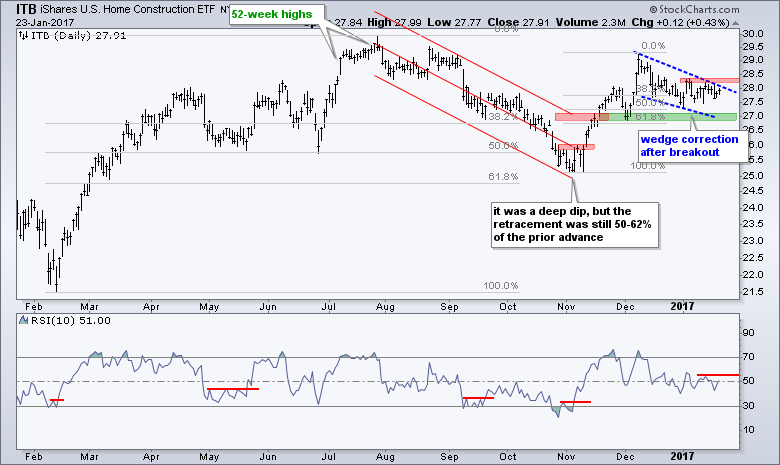
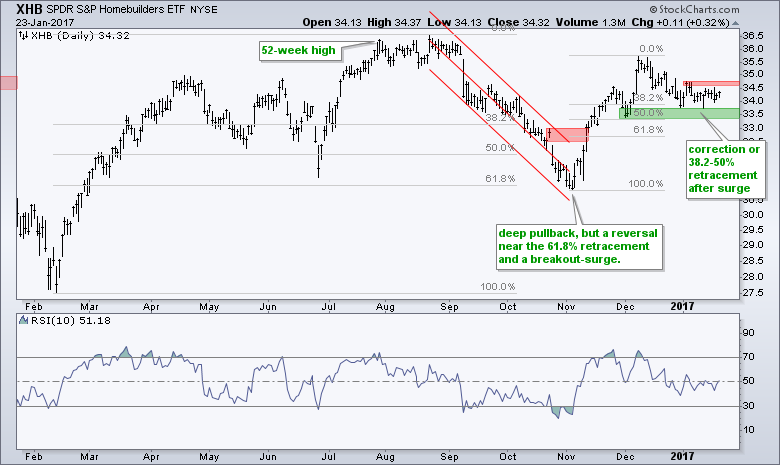
The Home Construction iShares (ITB) and Home Builders SPDR (XHB) remain in short-term downtrends and short of breakouts. First, note that both recorded 52-week highs this summer and then retraced 50-61.8% of the February-July advance. These retracements were deep, but these corrections reversed with surges from early November to early December. I think the 52-week high, correction and breakout sequence is more indicative of a long-term uptrend than a long-term downtrend. This means I assume that the decline over the last five weeks is a correction within a bigger uptrend. Look for a breakout above the early January highs to signal a resumption of this uptrend.
Retail ETF continues to Underwhelm
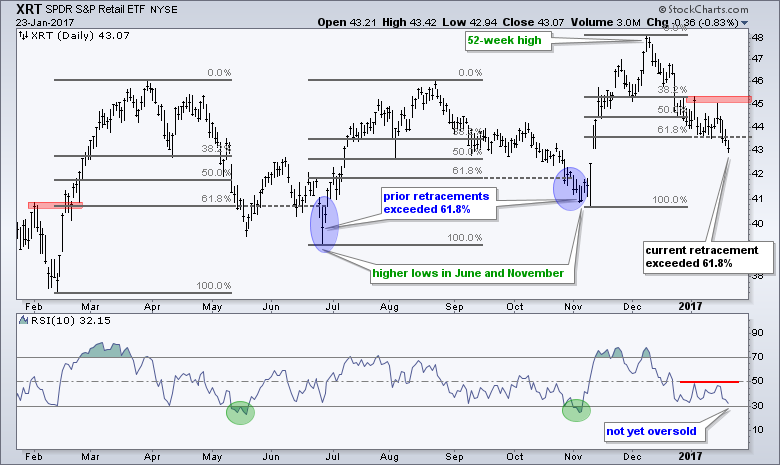
XRT fell to a new low for the year and is one of the weakest groups since early December, but the long-term trend still appears to be up. Note that XRT recorded a 52-week high in mid December as well as higher lows in late June and early November. Prices are zigzagging higher with big swings on both side. The current pullback exceeded the 61.8% retracement, but so too did the prior pullbacks (blue ovals). At this point, I am watching for a potential upside reversal or catalyst. This could be an RSI breakout at 50 or a price break above the early January highs.
Tech Related ETFs Remain Strong
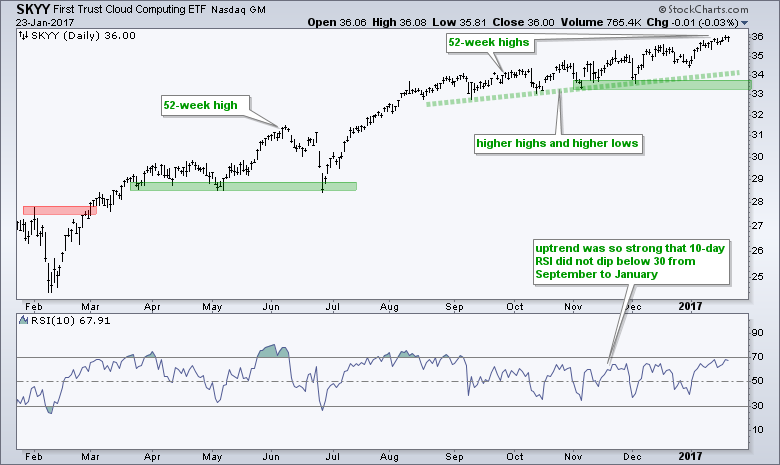
The Cloud Computing ETF (SKYY) surged from late June to late August and then embarked on a slower advance (September to January). There is nothing wrong with an advance that consistently records higher highs and higher lows.
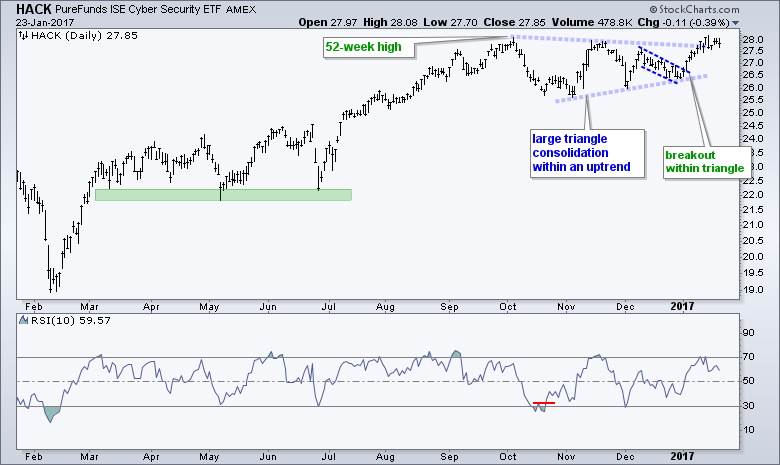
The Cyber Security ETF (HACK) is breaking out of a large triangle consolidation and very close to a 52-week high. This triangle looks like a big bullish continuation pattern.
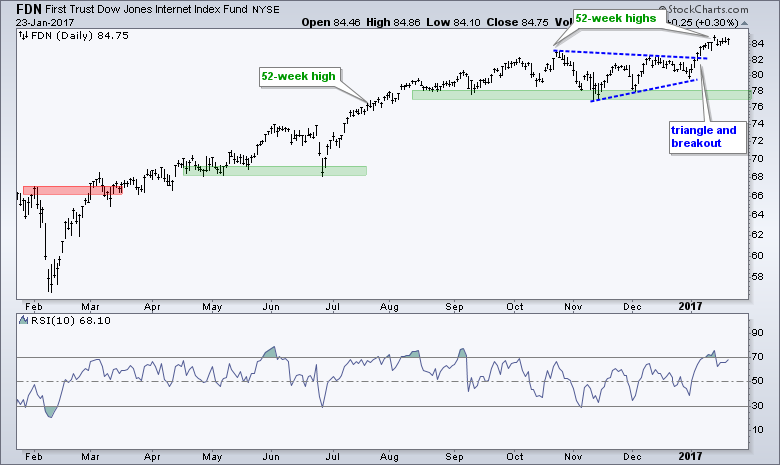
The Internet ETF (FDN) broke out of a triangle consolidation in early January and hit a fresh 52-week high last week. ETFs hitting 52-week highs are leading the market and FDN is clearly a chart leader.
Comparing RSI(5) and RSI(10) with IGN
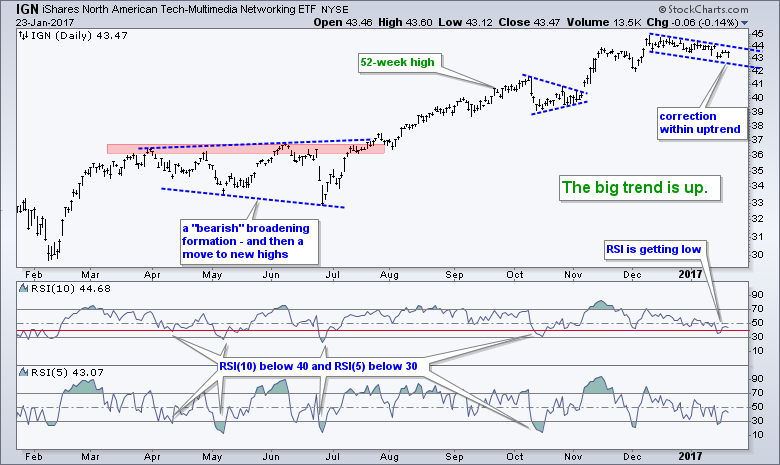
The Networking iShares (IGN) is in a long-term uptrend and a short-term correction. A falling flag formed the last five weeks and a breakout at 44 would signal an end to this pullback. The indicator windows show RSI(10) and RSI(5) for educational purposes. RSI(10), which is less sensitive, has yet to become oversold, but RSI(5) did become oversold. It is not a question of the right setting or the wrong setting. Instead, it is more a question of interpretation and timeframe. IGN is oversold on a five day timeframe with RSI(5), but not on a ten day timeframe with RSI(10). Chartists looking to match the oversold signals should notice that RSI(10) dips below 40 most of the time when RSI(5) dips below 30. Not every time, but most of the time. RSI(10) dipped below 40 last week and RSI(5) dipped below 30. These readings suggest that the pullback may be close to ending and I should be on alert for an upside catalyst or potential breakout on the price chart.
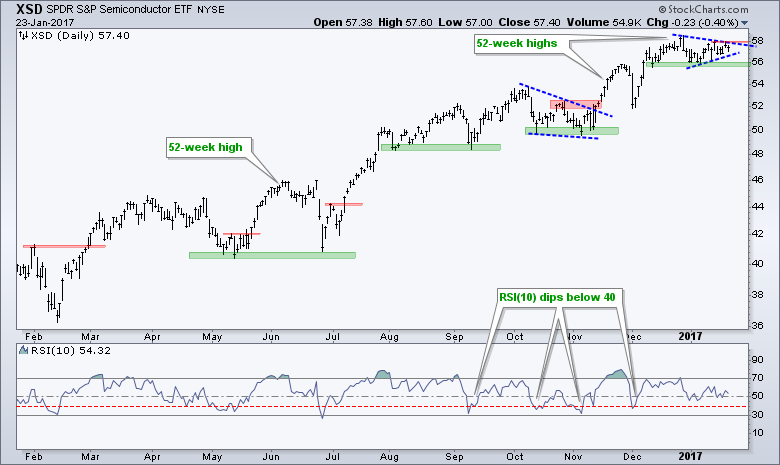
The Semiconductor SPDR (XSD) is consolidating within a clear uptrend (note the recent 52-week highs). A triangle breakout would open the door to more new highs. Note that RSI(10) last dipped below 40 in early December.
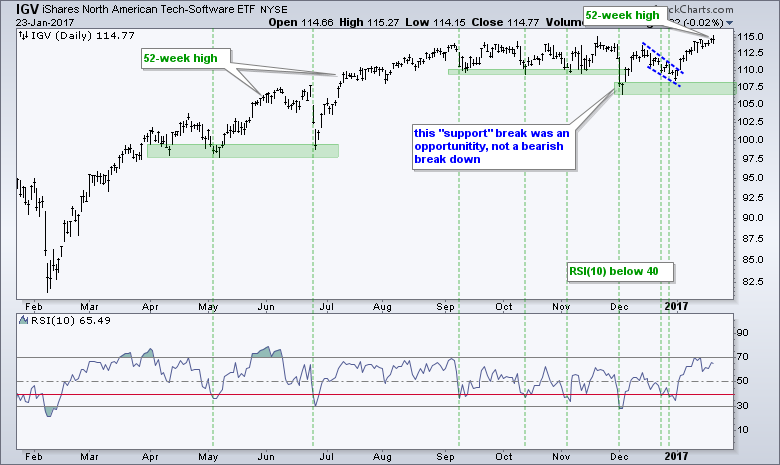
The Software iShares (IGV) hit a new 52-week high on Monday. This new high follows a wedge breakout in early January and RSI(10) dip below 40.
Finance Related ETFs are Correcting
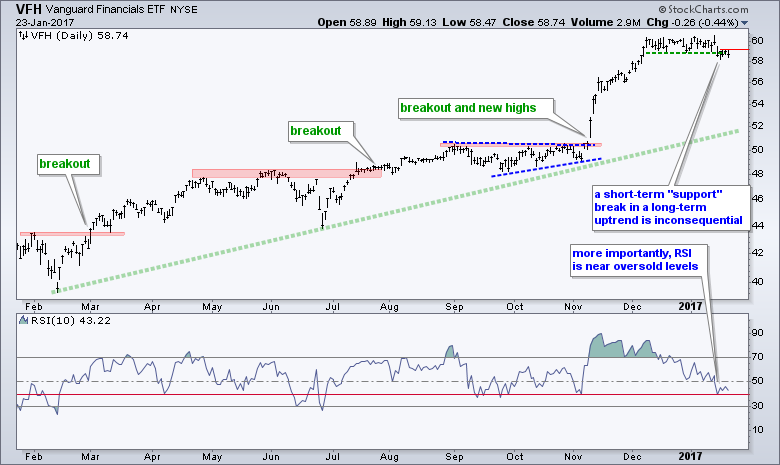
The Vanguard Financials ETF (VFH) is in a long-term uptrend and a short-term downtrend, which is deemed a correction. I am not very concerned with the "support" break last week because the long-term trend remains the dominant force. Instead, I am more interested in the fact that RSI(10) is getting close to oversold levels.
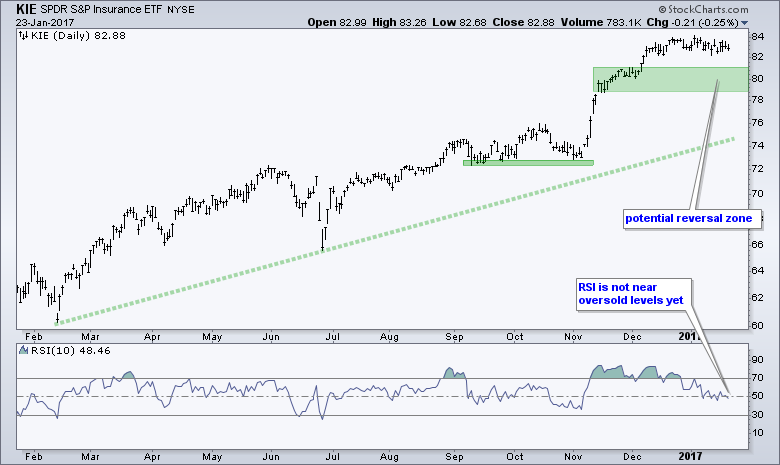
The Insurance SPDR (KIE) sports a flat consolidation over the last five weeks. We do not need Bollinger Bands to know that volatility is contracting. Chartists looking for the break can watch 84 up and 82 down. I am more interested in a mean-reversion trade so I will watching for pullback to the 80 area and/or an oversold RSI reading.
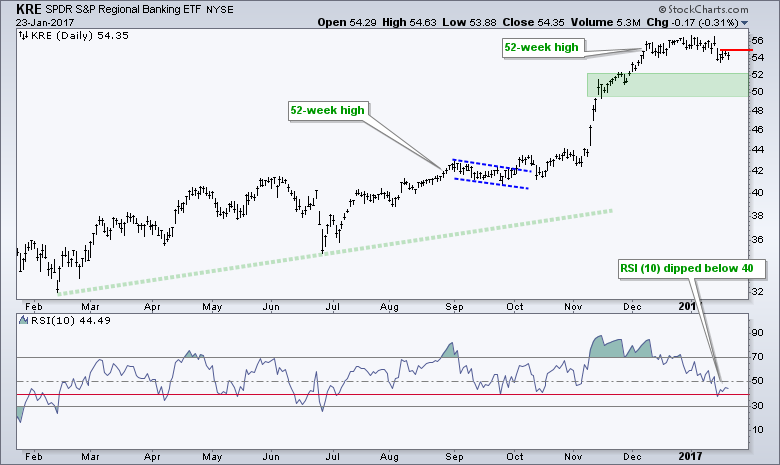
RSI Enters Oversold Zone for KRE
The Regional Bank SPDR (KRE) has also traded flat the last five weeks and RSI(10) dipped below 40 last week. Again, there is no such thing as perfect settings for an indicator. Chartists should simply stick to a setting and learn how the indicator correlates to price movements. In this case, last week's dip below 40 pushed RSI(5) below 30 and RSI(10) below 40. Even though KRE is short-term oversold on one timeframe, it could become even more oversold. In other words, RSI(10) could dip below 30 and the ETF could correct to the 50-52 area. Nobody knows! I am on a alert because KRE is in a long-term uptrend and RSI(10) dipped below 40. A price break above 55 would provide the first sign that the bigger uptrend is resuming.
I do not watch CNBC or Bloomberg during the day, but I do pick and choose from videos posted on their website. In particular, I like to hear from select technical analysts, select fundamental analysts and certain portfolio managers. I do not want to hear from politicians, government officials or company representatives because they simply talk their book. Dick Bove, VP of equity research at Rafferty Capital, is always worth a listen. This time he sets us straight on a couple of urban myths regarding banks, interest rates and the yield curve.
******************************************************
Spotting Pullbacks and Upturns within an Uptrend using RSI and MACD Histogram.
Difference between EMA and SMA - Using %Above 200-day EMA for Breadth Analysis.
Backtesting Different Moving Average Pairs with SPY, QQQ and IWM.
ETF Master ChartPack - 300+ ETFs organized in a Master ChartList and in individual groups.
Follow me on Twitter @arthurhill - Keep up with my 140 character commentaries.
****************************************
Thanks for tuning in and have a good day!
--Arthur Hill CMT
Plan your Trade and Trade your Plan
*****************************************


