SPY through the Mean-Reversion Lens .... SPY through the Trend-Breakout Lens .... Small-caps Continue to Lead (IJR and QQQ) .... Five Sector SPDRs Get Oversold Bounces .... Chartlist Update (30 Stocks including the Fab 5) .... //// .... Commentary Video ----- Art's Charts ChartList (updated 5-Jan) -----
SPY through the Mean-Reversion Lens
There is a clear difference between breakout trades and mean reversion trades. A breakout trade identifies a chart pattern and then buys on an upside breakout. The mean reversion trade uses an indicator or a sharp decline to identify oversold conditions and buy on a pullback. Breakout trading works great in strong bull markets, and not-so-great other times. Pullbacks can be limited in strong bull markets, but mean reversion trading usually offers a better reward-to-risk ratio than breakout trading. Let's look at SPY for a current example.
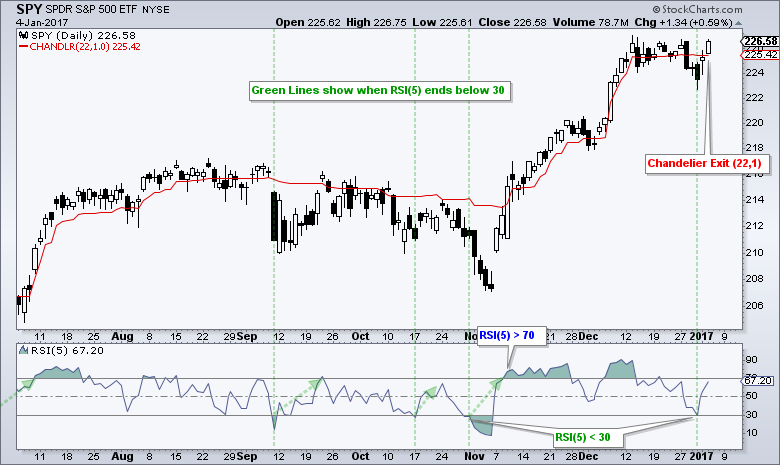
The chart above shows 5-day RSI moving below 30 on 31-Dec to create a short-term oversold condition and set up a bullish mean-reversion trade for the next open (Tuesday, 3-Jan). Keep in mind that this is a short-term trading system designed to play pullbacks when the bigger trend is up. Once the trade is active, chartists can now consider an exit when RSI moves above 70 or when SPY closes below the Chandelier Exit (22,1). The indicator settings, entries and exits are up to you.
SPY through the Trend-Breakout Lens
The next chart shows a completely different picture and analysis style. First, We can see that the 50-day EMA is above the 200-day EMA and SPY is well above both EMAs (primary uptrend). Second, we can see that a bull flag is taking shape the last few weeks and SPY is on the verge of a breakout. Even though buying on an upside breakout seems like the "right thing to do", note breakout entries are usually well above the mean reversion entries.
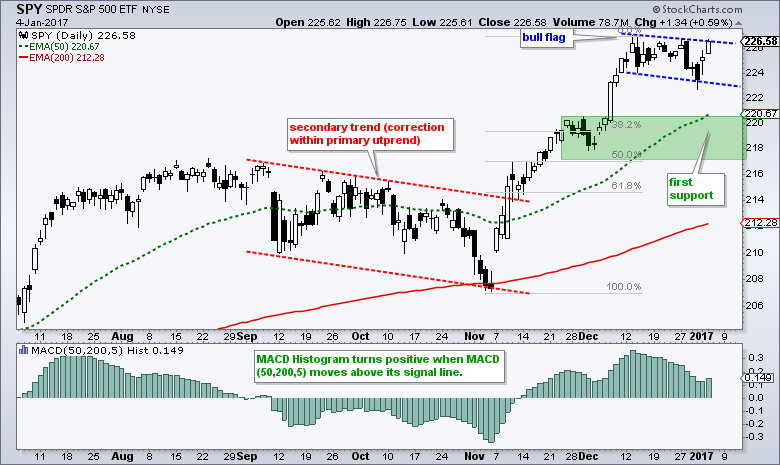
The indicator window shows the MACD Histogram (50,200,5). This indicator plots the difference between MACD (50,200,5) and its signal line, which is the 5-period EMA. The histogram is positive when MACD turns up and moves above its signal line and negative when MACD turns down and moves below its signal line. It is a medium-term timing mechanism that I will test in tomorrow's system trader article.
Small-caps Continue to Lead (IJR and QQQ)
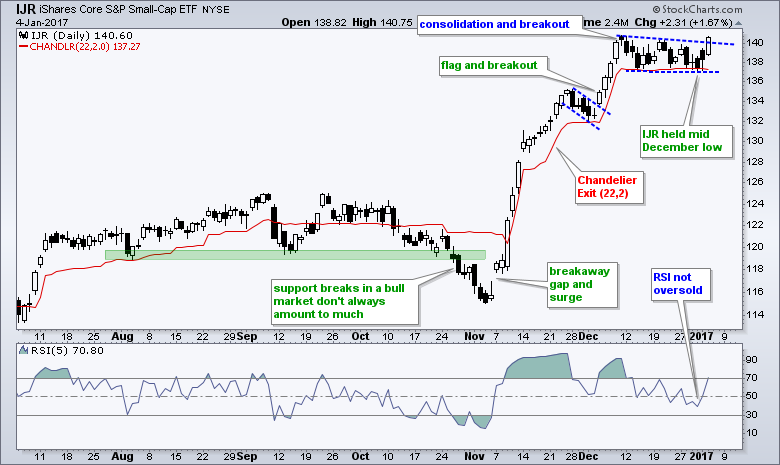
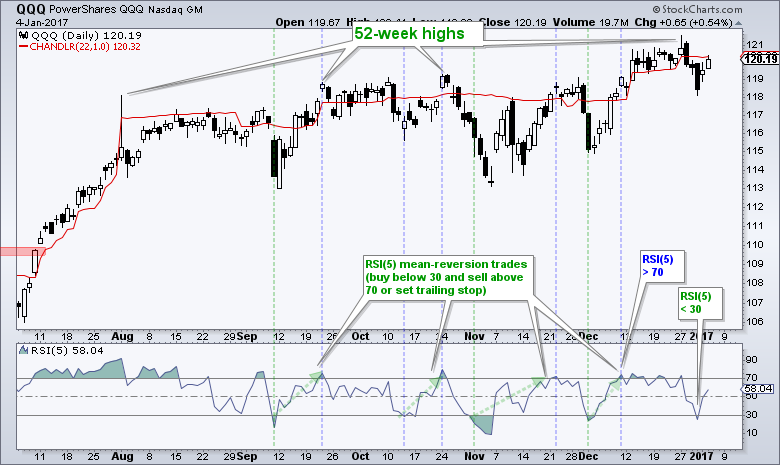
There are numerous ways to measure relative performance and I believe that the S&P SmallCap iShares (IJR) held up better than QQQ and SPY the last few weeks. First, IJR led the surge from early November to mid December. Second, IJR held its mid December low during the yearend dip (QQQ and SPY did not). Third, RSI(5) did not become oversold (<30) for IJR, but did for QQQ and SPY. On the price chart, IJR broke above the consolidation trend line and this signals a continuation higher.
Five Sector SPDRs Get Oversold Bounces
I tested the RSI mean-reversion strategy with the nine sector SPDRs in July and the strategy has a positive expectation (positive returns). The returns were not uniform though and varied because the price characteristics are different for each SPDR. You can read that article here. I bring this up because RSI(5) became oversold for several sector SPDRs on 31-Dec. The chart below shows XLY with RSI moving below 30 for the first time since early November. Also notice that XLY formed an inside day Friday-Tuesday and surged above the flag trend line on Wednesday.
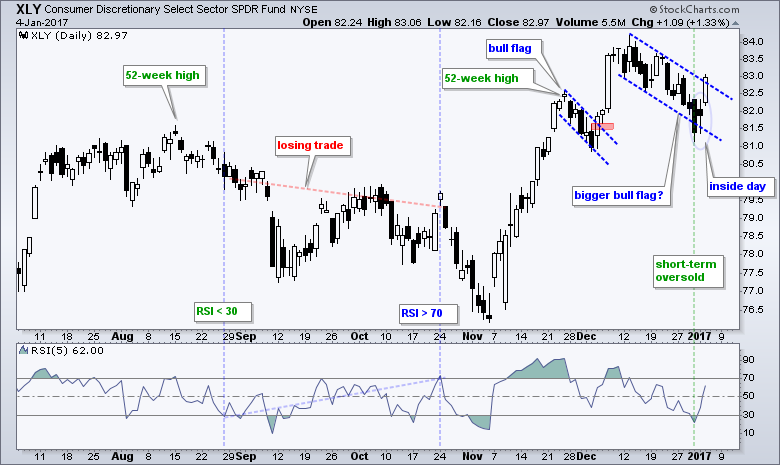
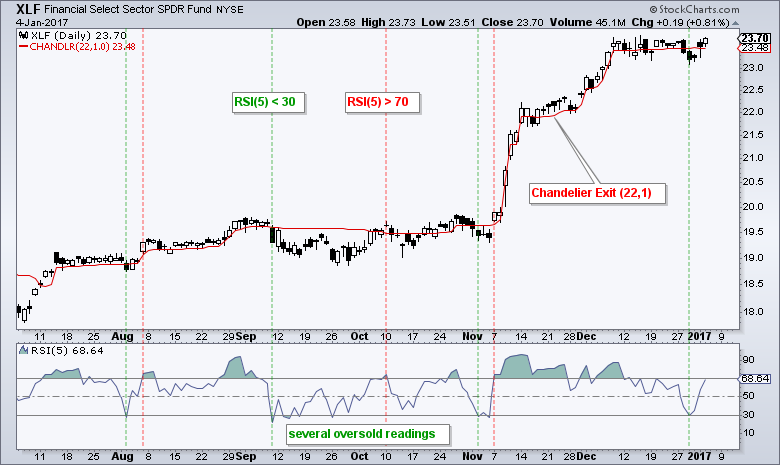
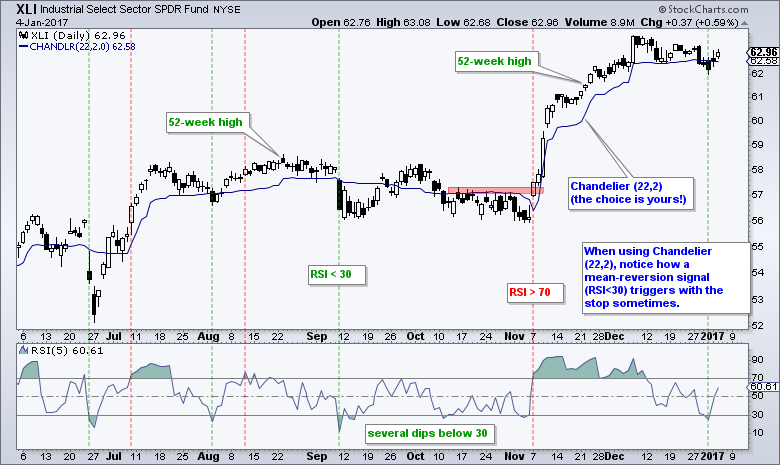
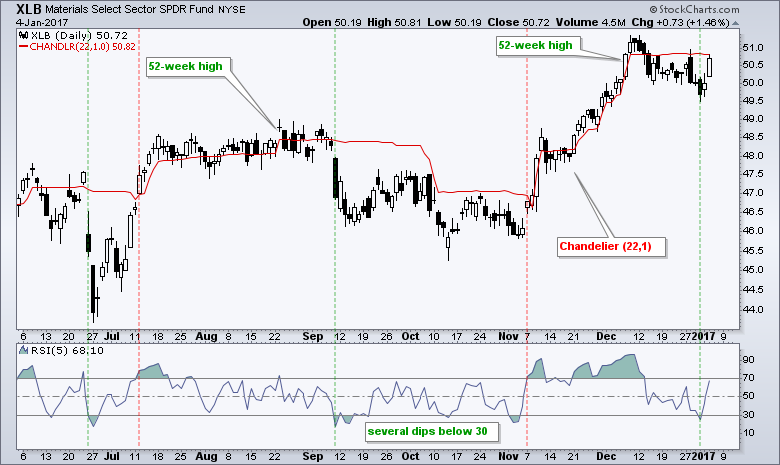
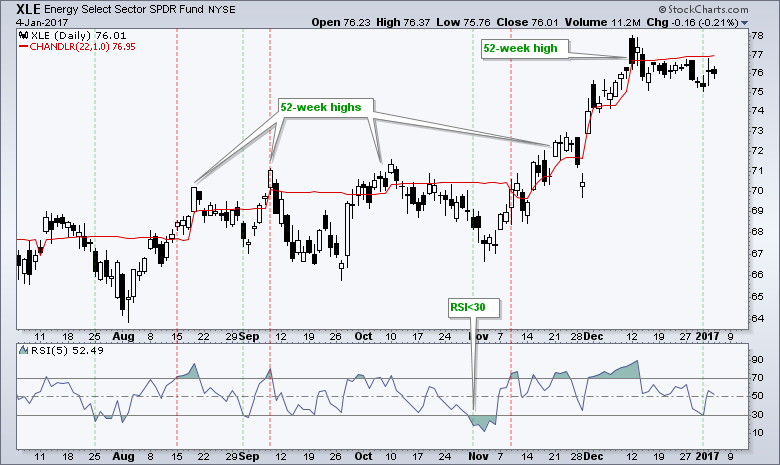
The indicator window shows one particular trade from late August to late October (blue dashed lines). The system goes long when RSI moves below 30 and exits when RSI moves above 70. Chartists can also consider trailing a stop-loss with the Chandelier Exit. In any case, notice that RSI dipped below 30 numerous times in September and October as the correction extended. This is the risk of not using a stop-loss and employing an RSI exit. RSI will eventually make it above 70, but we never know when. Nobody does! The next charts show XLF, XLI, XLE and XLB with RSI becoming oversold on 31-December.
Other Pull Backs and Patterns
Here are some other symbols with long-term uptrends and short-term bullish setups over the last five days.
- RSI(5)<30: XLE, IGV, COPX, SLX, XOP
- RSI(5)<30 and Bull Flag/Wedge: RSP, XLY, XLF, XLI, XLB, ITB, XHB, SKYY, ITA, JETS, XME
- Bull Flag/Pennant/Wedge: MDY, IWM, IJR, XLV, IGN, IHF
ChartList Update
The Art's Charts CharList has been updated with 30 stock charts. Here are some groupings:
- Failed breakouts versus mean-reversion (ATI and WFM)
- Miscellaneous Charts: DHR, AKAM, SQ, V, SKX
- Cyber Security Stocks: CSCO, FEYE, PANW, PFPT, QLYS, SYMC
- Fab Five: AAPL, AMZN, FB, GOOGL, MSFT
- Housing Stocks: DHI, KBH, LEN, PHM, TOL
- Building Products: DOOR, HD, MAS, MHK
- Auto Parts: BWA, DLPH and WBC
******************************************************
Spotting Pullbacks and Upturns within an Uptrend using RSI and MACD Histogram.
Defining Bull and Bear Market Environments with Breadth Indicators (plus video).
Backtesting Different Moving Average Pairs with SPY, QQQ and IWM.
ETF Master ChartPack - 300+ ETFs organized in a Master ChartList and in individual groups.
Follow me on Twitter @arthurhill - Keep up with my 140 character commentaries.
****************************************
Thanks for tuning in and have a good day!
--Arthur Hill CMT
Plan your Trade and Trade your Plan
*****************************************
