----- Webinar Video ----- Art's Charts ChartList -----
Tides, Waves, Ripples and Charles Dow .... Primary and Secondary Trend for SPY .... Using 5-day RSI for the Minor Trend .... QQQ Becomes Oversold as IJR Stalls .... Bonds are Not the Place to Be Right Now .... Oil Extends Slow Uptrend .... Primary Downtrend for Gold .... Strong Dollar Weighs on Bullion .... Webinar Preview .... //// ....
Tides, Waves, Ripples and Charles Dow
Before looking at the charts, note that my outlook for 2017 is based on current trends and this is not a forecast. I am simply applying the basics of Dow Theory and relying on two key tenets. First, the trend is in force until proven otherwise. Second, neither the length nor the duration of the trend can be forecast. Thus, I am seeking to identify the primary trend and trade the smaller trends until the primary trend reverses. This means I am out during primary downtrends and I am looking for bullish opportunities during a primary uptrend. This may sound oversimplified, but getting the primary trend correct is more than half the battle.

Charles Dow also referred to three trends: primary, secondary and minor. Using an aquatic metaphor, the primary trend represents the tide and this is the dominant force at work. Waves represent the intermediate trend and run counter to the primary trend (corrections). These can last from two weeks to three months and generally retrace around half of the prior move. Ripples represent the minor trend and these can last up to two weeks. In general, I use weekly charts to define the primary trend, and daily charts for the secondary and minor trends. The chart below shows the S&P 500 with a primary uptrend (green line) and secondary trend corrections. You can read more on Dow Theory in our ChartSchool.
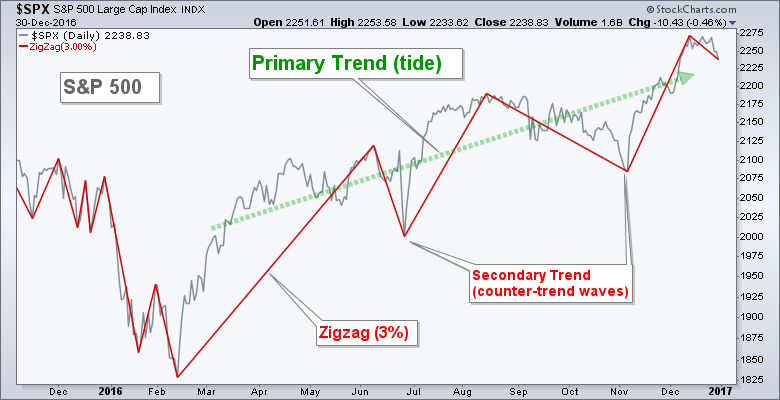
Even though Charles Dow provided guidelines, keep in mind that these guidelines are more like rough guides for a general idea of market movements. As with the primary trend, we cannot really forecast the length or duration of the secondary and minor trends. In addition, we do not know if a minor trend will develop into a secondary trend or if a secondary trend will develop into a primary trend.
Primary and Secondary Trend for SPY
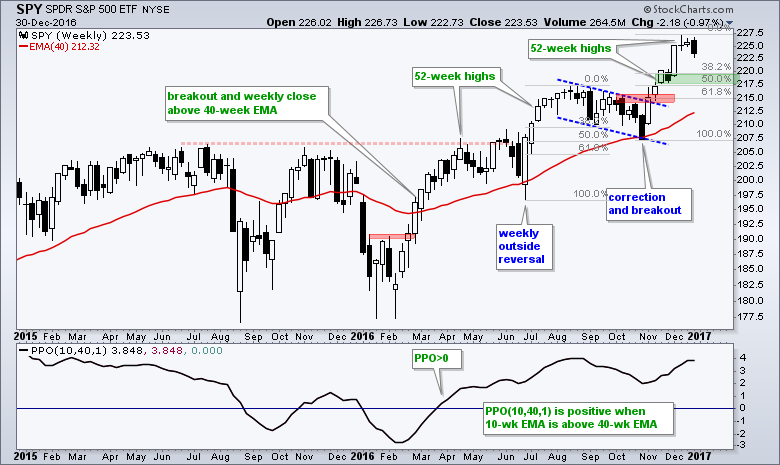
The primary trend for SPY is clearly up because the ETF hit new 52-week highs from April to December. This means the outlook for the broader market is bullish. The blue dashed lines show a secondary trend from August to October that retraced around 50% of the prior advance. SPY then broke out in early November and surged to another 52-week high. At this stage, I think the primary and secondary trends are up, and the minor trend is down. Should a secondary downtrend (correction) unfold, I would look for support in the 217.5-220 area (38.2-50% retracement).
Using 5-day RSI for the Minor Trend
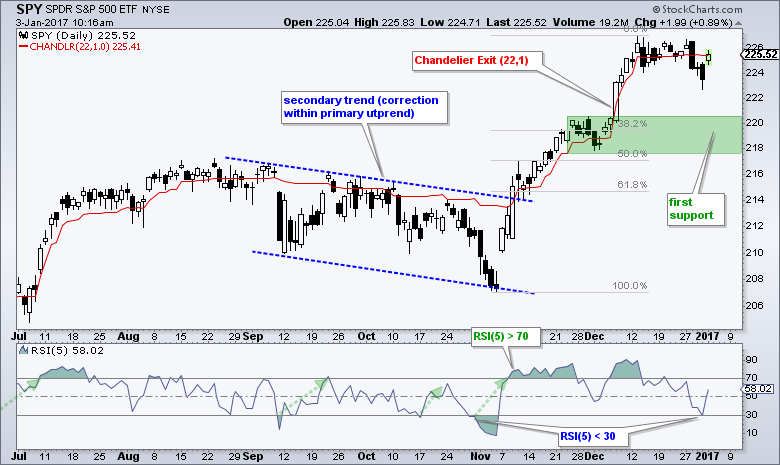
The next chart shows daily candlesticks for SPY and 5-day RSI. The mean-reversion strategy using 5-day RSI is a short-term system designed to identify short-term pullbacks (minor-trend). As detailed in this System Trader article, the basic mean-reversion system goes long when 5-day RSI moves below 30 and exits when 5-day RSI moves above 70. Chartists can also use a Chandelier Exit to trail a stop-loss once RSI moves above 70.
QQQ Becomes Oversold as IJR Stalls
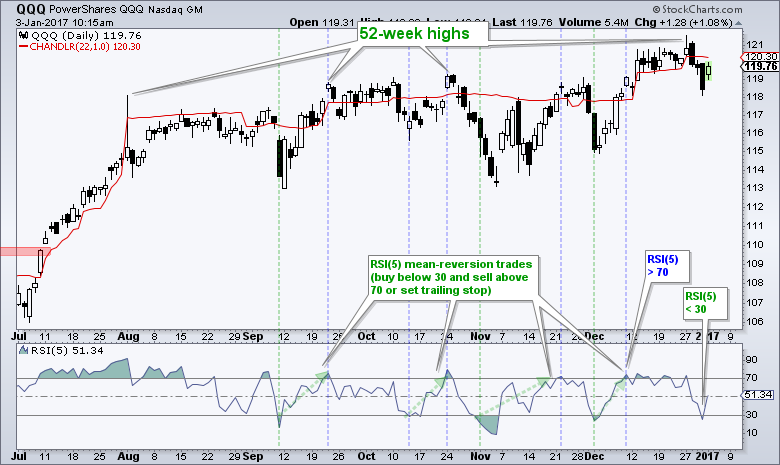
The Nasdaq 100 ETF (QQQ) hit new 52-week highs from August to December and the primary trend is clearly up. 5-day RSI became oversold on 1-Dec to trigger a bullish setup and QQQ closed below the Chandelier Exit (22,1) on 28-Dec. The decline over the last three days pushed 5-day RSI back below 30 for another bullish setup.
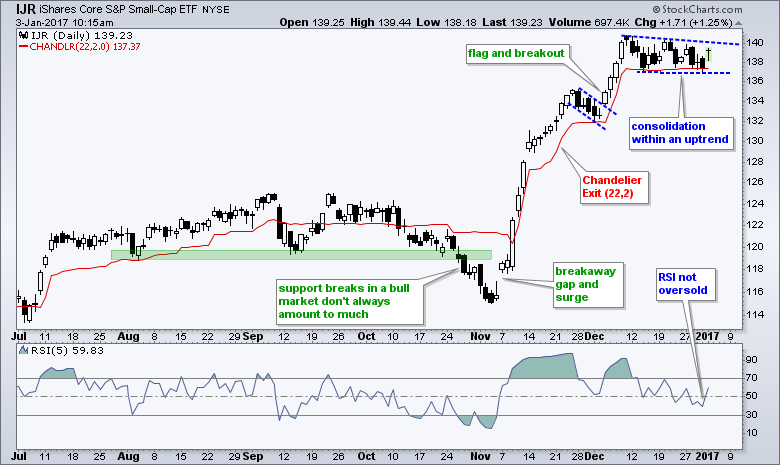
The S&P SmallCap iShares (IJR) held up quite well the last few weeks with a flat consolidation. This looks like a triangle after a sharp advance and this makes it a bullish continuation pattern. Note that IJR is near support from the mid December low right now.
Bonds are Not the Place to Be Right Now
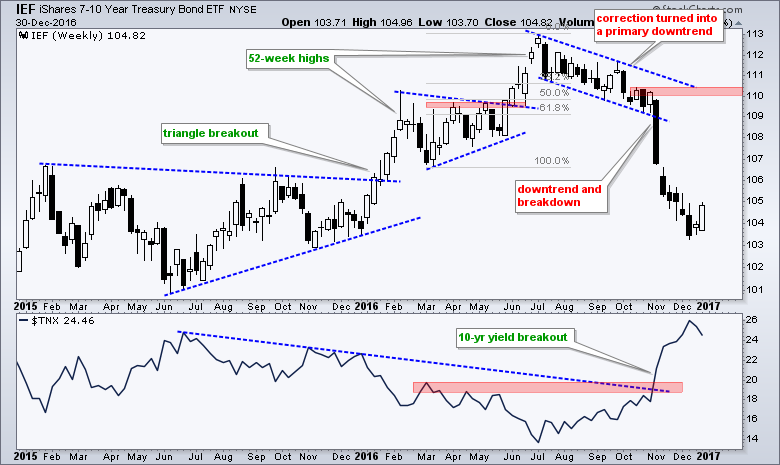
The primary trend for the 7-10 YR T-Bond ETF (IEF) is down and this means the outlook for Treasury bonds is bearish. It also means that I am ignoring bullish setups and bullish patterns because the primary downtrend is the dominant force. The IEF chart provides a good example of a secondary trend evolving into a primary trend. IEF declined with a falling channel that retraced 51-61.8%, but did not reverse in the retracement zone and instead broke down. Also notice that the 10-yr T-Yield ($TNX) broke out in November and hit a 52-week high in December.
Oil Extends Slow Uptrend
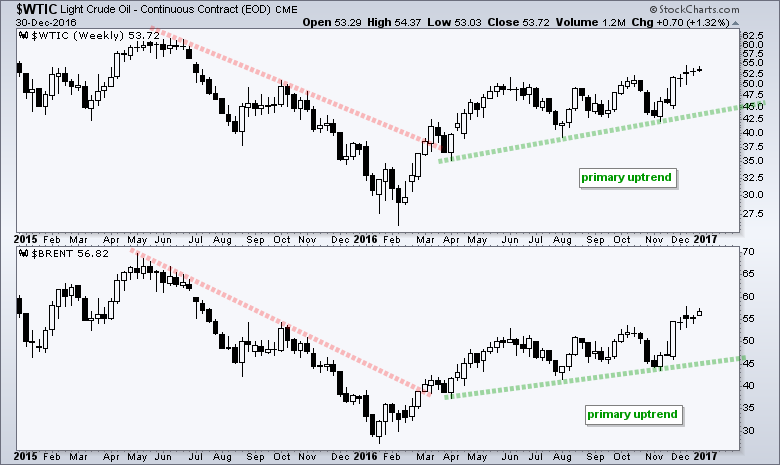
The primary trends for Light Crude Continuous Futures ($WTIC) and Brent Crude Continuous Futures ($BRENT) are up. The charts below show the continuous futures and these are only good for broad trend analysis. Support and resistance levels are not valid because these charts are stitched together from monthly futures contracts. Chartists should use the current futures contracts for tradable patterns and setups (^CLG17 and ^BG17). The chart below shows oil surging in March-April and then working its way higher the last eight months. By extension, I would be positive on XLE and XES as long as oil holds its uptrend.
Primary Downtrend for Gold
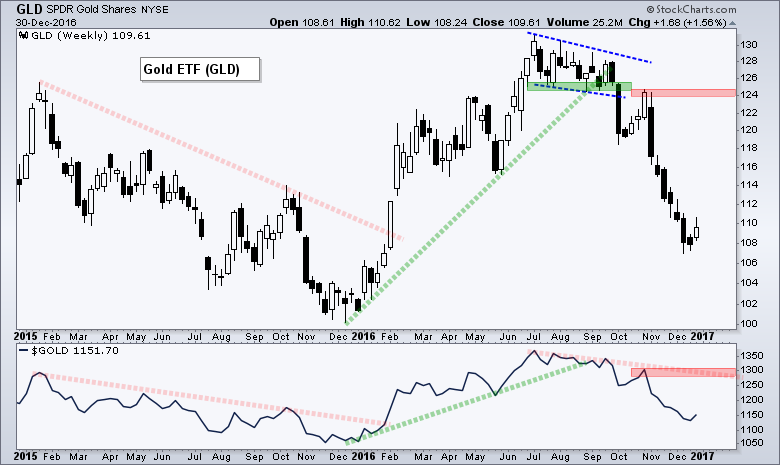
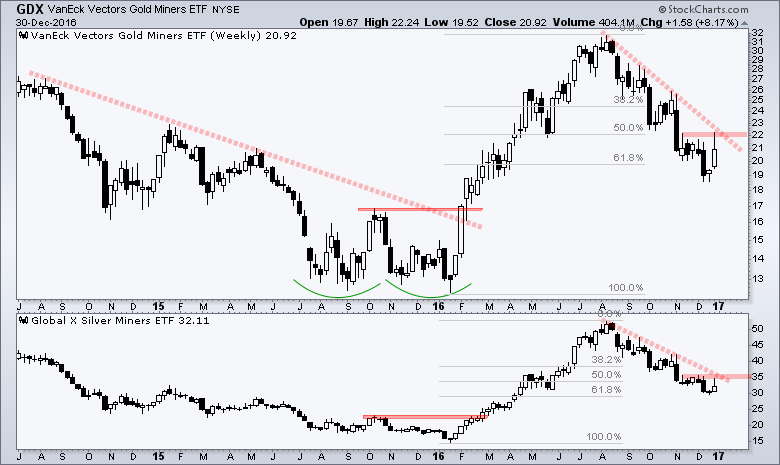
The primary trends for the Gold SPDR (GLD) and Gold Miners ETF (GDX) are down. GLD broke down with a sharp decline in early October. The pattern from July to September looked like a correction (wedge), but the pattern did not hold as GLD broke below 124 with a sharp decline. Even though gold seems oversold and ripe for a bounce, I am not interesting in playing for a bounce when the primary trend is down.
GDX is also in a downtrend, but could be at a reversal point. Notice that the current decline retraced around 61.8% of the prior advance and the ETF bounced last week. This bounce, however, was not enough to reverse the overall downtrend. A follow through breakout at 22 is needed before taking this reversal seriously.
Strong Dollar Weighs on Bullion
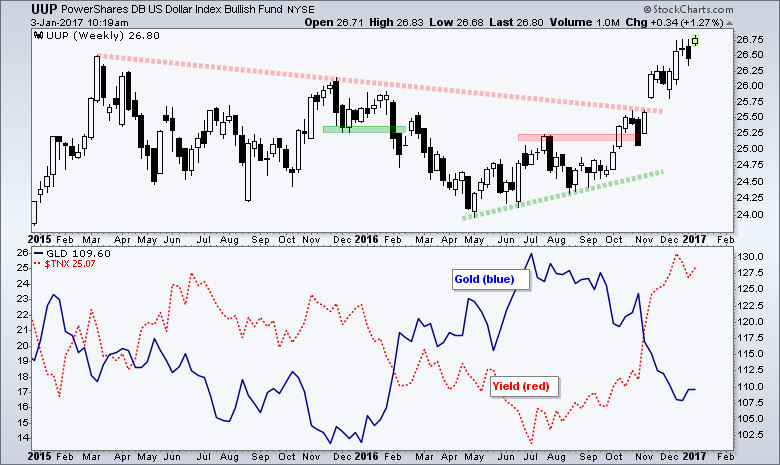
The US Dollar ETF (UUP) started 2016 on a weak note, but firmed in spring and advanced the rest of the year. The ETF finished at its highest level since 2008 and the overall trend is clearly up. We can argue about overbought conditions, but there is little argument on the overall trend. The rise in Treasury yields is helping the Dollar strengthen and this is bearish for gold.
Webinar Video
In addition to the charts above, I also covered the following in the webinar video.
- Tight Consolidations Extend for XLI and XLF
- XLY and XLK Remain in Clear Uptrend
- XLB and XLE Rest after 52-week Highs
- Staples, Healthcare and Utilities Still in Downtrends
- HACK with Bullish Consolidation
- FAN Bounces off Key Retracement Zone
- XME Corrects after Surge
- Biotech ETFs Continue to Struggle
- IHF and IHI Stall
******************************************************
Spotting Pullbacks and Upturns within an Uptrend using RSI and MACD Histogram.
Defining Bull and Bear Market Environments with Breadth Indicators (plus video).
Backtesting Different Moving Average Pairs with SPY, QQQ and IWM.
ETF Master ChartPack - 300+ ETFs organized in a Master ChartList and in individual groups.
Follow me on Twitter @arthurhill - Keep up with my 140 character commentaries.
****************************************
Thanks for tuning in and have a good day!
--Arthur Hill CMT
Plan your Trade and Trade your Plan
*****************************************


