
Weekly Performance Review
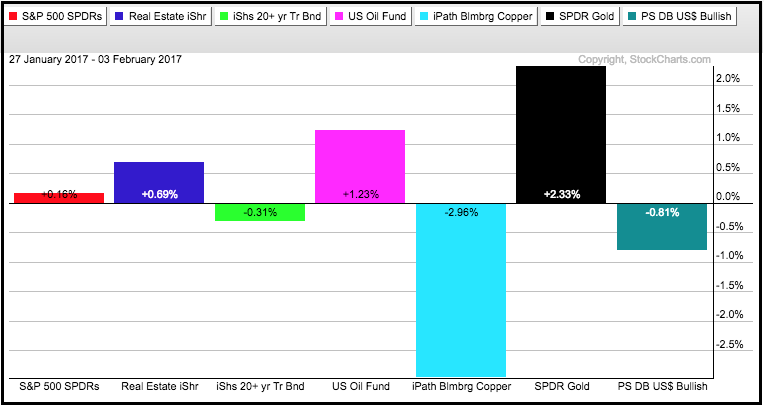
There was a lot of pushing and shoving in the markets this week. Stocks started the week with a modest move lower and finished the week with a modest move higher. The end result was a .16% gain for the S&P 500 SPDR. The 20+ YR T-Bond ETF (TLT) and the US Dollar ETF (UUP) edged lower. As a result, the Gold SPDR (GLD) surged over 2% and the USO Oil Fund (USO) added over 1%. Copper was not on the same page though. The Copper ETN (JJC) fell around 3%.
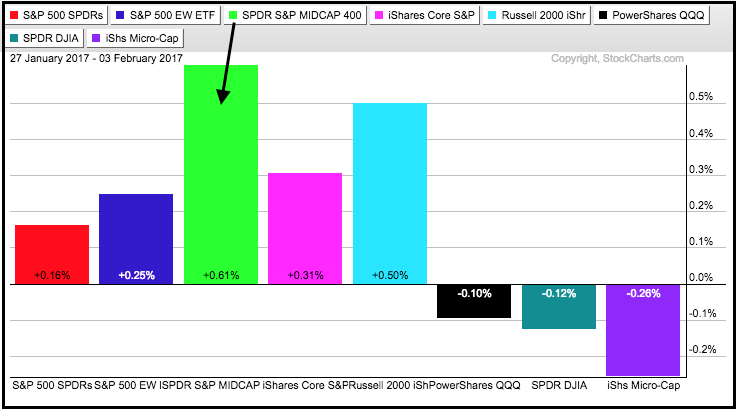
 As reflected by the fractional gain in SPY, the major index ETFs ended the week mixed. The S&P MidCap SPDR (MDY) and Russell 2000 iShares (IWM) led with modest gains, while the Nasdaq 100 ETF (QQQ) and Dow Diamonds (DIA) lagged with small losses.
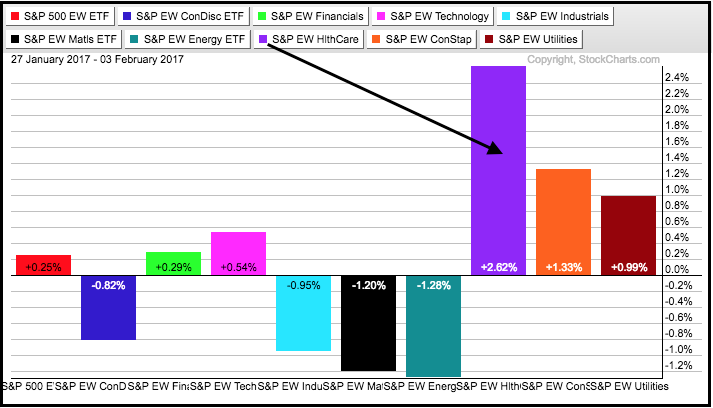
 Healthcare was the big winner this week as the EW Healthcare ETF (RYH) surged over 2.5% and led the equal-weight sectors. Utilities and staples were also higher on the week as the market adopted a somewhat defensive posture. As far as splits are concerned, the EW Consumer Discretionary ETF (RCD) and EW Industrials ETF (RGI) finished down for the week, while the EW Finance ETF (RYF) and EW Technology ETF (RYT) finished up.
 Many pundits, including yours truly, are bullish, but noting that stocks are overbought and ripe for a pullback. Even though I never like it when too many of us pundits line up on the same side, it is what it is. This means the market is between a rock and a hard place. The long-term trend is up and this favors further gains over the next three to six months. How (and if) we get there is another question. Short-term, stocks are a bit extended and ripe for a correction.
There is a lot of cover this week so here are some of the highlights:
- S&P SmallCap iShares (IJR) remains within corrective pattern.
- Healthcare sector perks up with expansion of new highs.
- Energy sector finishes the week strong with surge in AD Percent.
- Gold moves back into potential reversal zone.
- TLT shows the true colors for the bond market and remains bearish.
Revisiting the January Barometer
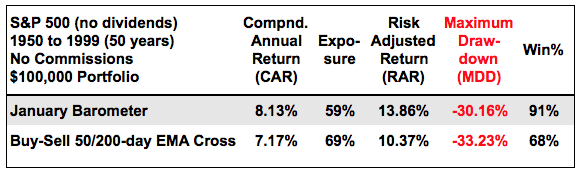
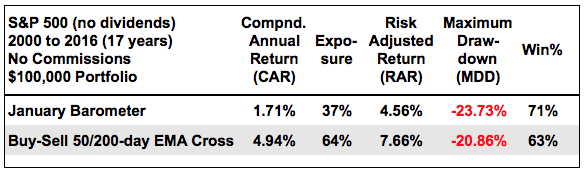
I tested the January Barometer on January 7th with a System Trader article. Perhaps I was a bit early because January was still in full swing. Actually, I was not too early because my conclusion was to ignore the January Barometer and focus on price action. To recap, the January Barometer suggests that the year closes higher when January closes higher. To properly test this, I measured performance from February to December WHEN January closed higher. January is used to trigger the signal and February is used for the entry. The table below shows the results for the January Barometer and the Golden EMA Cross for the S&P 500. The January Barometer worked well from 1950 to 1999 and outperformed the Golden EMA Cross on all metrics. Note that buy-and-hold returned 7.57% per annum during this timeframe.
 Market conditions changed in 2000 with the dot-com bubble bursting and two bear markets. There were bear markets from 1950 to 1999, but there were also some roaring bull markets during this timeframe. My point is that the performance for the January Barometer changed dramatically over the last 17 years. The January Barometer underperformed the Golden EMA Cross and buy-and-hold, which returned 2.47% per year. The Compound Annual Return for the January Barometer was measly 1.71% and the Maximum Drawdown was 23.73%. In contrast, the Golden EMA Cross returned 4.94% during a difficult 16-year period and the Maximum Drawdown was around 21%.
 As far as I am concerned, the Golden EMA Cross is one of the most consistent long-term timing strategies we can use for the S&P 500. I came to a similar conclusion when testing the Best Six Months Strategy. I pretty much take the same line as Greg Morris did when he published his article entitled "New Year Nonsense". We cannot build a trading strategy based on seasonal patterns. We can, however, build a trading strategy based on trends and trend indicators. The trend is the dominant force at work and trend direction overrides any seasonal pattern. We need to filter out unnecessary noise and focus on what is really important.
Programming Note
Using ETFs for analysis, today's Weekly Review & Outlook will cover the broad market, the sectors, bonds, yields, gold, oil and the Dollar. This is a regular feature that will be posted on Friday or Saturday to offer the weekend chartists a thorough overview of market trends and conditions. I will take a step back by looking at one year bar charts and focusing on the bigger trends at work. I will also highlight patterns and setups within these trends when appropriate. I am still developing the format and coverage - and your feedback is always welcome (see comments section at bottom).
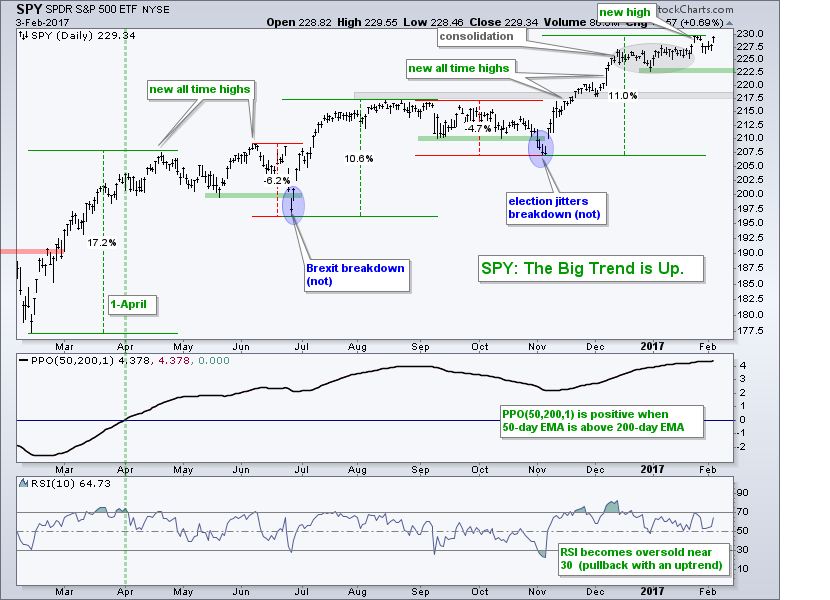
SPY Holds above Consolidation Break
The S&P 500 SPDR (SPY) remains in a long-term uptrend with new highs through November, December and January. Most recently, the index consolidated in the 223-228 area (gray oval) and broke out of this consolidation with a surge above 229. There was a dip on Monday and then a bounce on Friday to keep SPY above the consolidation breakout. Admittedly, it is difficult to forecast the short-term because SPY remains extended on the upside (+11% from the early November low to the late January high). Stocks could grind higher with a very choppy advance or we could see some sort of correction. The big trend, however, is not in question. It is up. The green line marks another one of those alleged "support" levels (see green lines in late July and early November). A break below 222.5 would certainly seem negative on the chart, but it would likely push RSI(10) to the 30 area and provide the next opportunity. This is better known as a pullback within an uptrend.
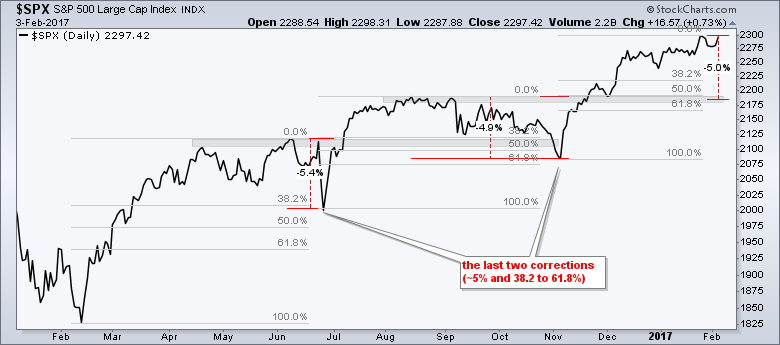
As noted last week, timing a pullback within a bigger uptrend is a difficult task. First, the bigger up trend is the dominant force. Second, this up trend can override a pullback at any moment. The last two corrections were around 5% and retraced 38.2-61.8% of the prior advance. There is nothing magical about these numbers. They are merely BROAD guidelines based on prior corrections. A correction could retrace 30%, 53% or even 67% and the decline could be 4% or 7%. Nobody knows. Heck, we are not even in the midst of a correction yet so talk of a correction is purely, gasp, speculation. Having said that, my base case for a correction is to the 2180 area. Note that the last ~5% correction ended with early November low, about three months ago.
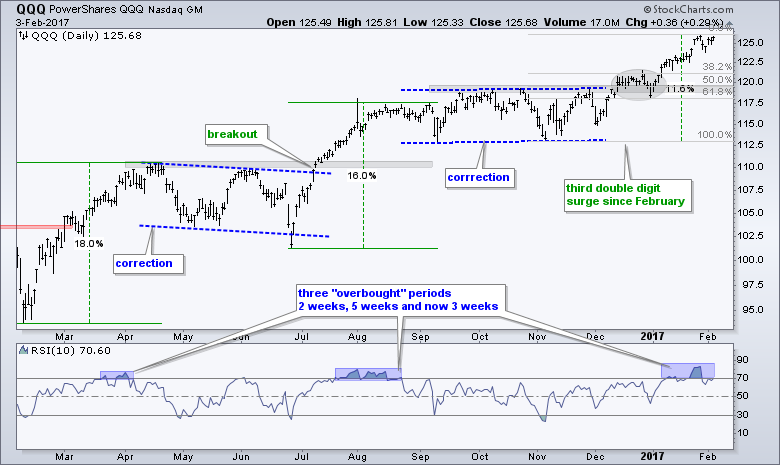
QQQ remains Extended and Bullish
The Nasdaq 100 ETF (QQQ) advanced over 10% from the early November low to the recent high and RSI first exceeded 70 on January 10th. Thus, RSI has been near "overbought" territory for three weeks. This does not guarantee a pullback, but QQQ is looking a little frothy. Should a pullback unfold, I would mark first support in the 119-120 area. Broken resistance, the oval consolidation and the 50-61.8% retracement combine to mark support here.
Small-caps Bounce with Falling Channel
The S&P SmallCap iShares (IJR) is in a long-term uptrend and a short-term downtrend, which is viewed as a correction. The blue trend lines mark four corrections over the last ten months. These lasted from three to five weeks and the ETF fell 6 to 8%. They "officially" ended with upside breakouts. The current correct is seven weeks old and IJR fell around 4.5% from high to low. A daily close above 69.50 would break the upper trend line and officially end this correction.
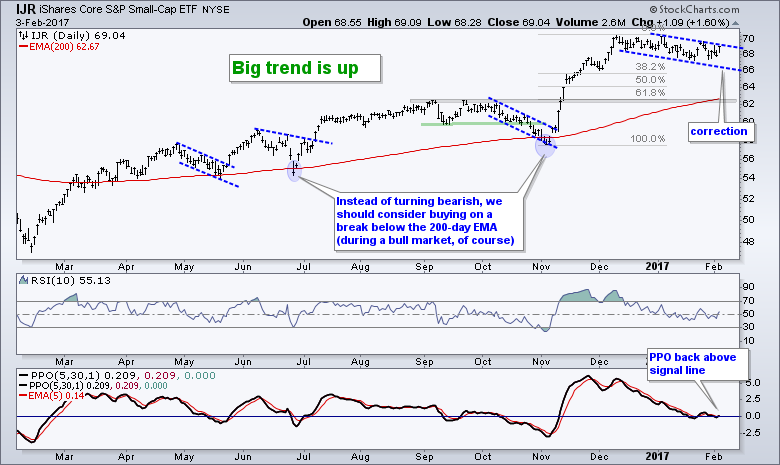 Note that the prior three corrections broke the 200-day EMA and this break was more of an opportunity than a threat. The length and the duration of a correction are hard to estimate because each one occurs under different circumstances. Note that a 4 to 7 percent correction in SPY would likely mean a 6 to 10 percent correction in IJR because small-cap stocks have higher betas. This puts the correction range from 63.5 to 66, which is around the 50% retracement line. The table below shows the sector weightings for IJR. Financials and Industrials are the top two sectors and they account for over 36% of the ETF.
Using Breadth to Identify a Sector Breakout
In Thursday's commentary, I featured a bullish breadth signal in the healthcare sector as High-Low Percent surged above +10% for the first time since August 1st. Today I will show a breadth chart for the Energy SPDR (XLE) and add a sector table. You can read more about these indicators in these three articles: AD Percent, High-Low Percent, and %Above 200-day EMA.
First, the top windows show XLE and the EW Energy ETF (RYE) above their rising 200-day EMAs. Perhaps more importantly, both pulled back the last seven weeks and are near these EMAs. Hmm....looks like a pullback within an uptrend from here. The middle window shows the 10-day EMA of Energy AD Percent ($XLEADP) dipping below -30% for a bearish signal.
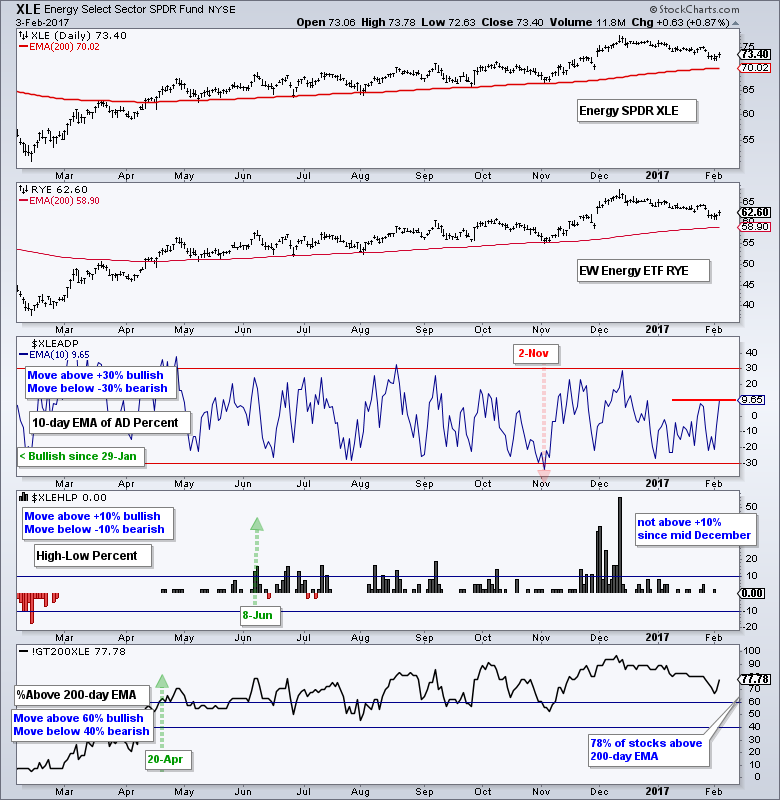
Despite one bearish signal, note that XLE High-Low% ($XLEHLP) and Energy %Above 200-day EMA (!GT200XLE) remain on bullish signals. Thus, the breadth indicators are still net bullish (2 of 3). AD Percent is the most volatile of the breadth indicators and this is why I use the other two indicators for confirmation. With two of the three still bullish and XLE in a long-term uptrend, I am now watching the 10-day EMA of AD Percent for a surge above +10% (red line). It also got there on Friday. Such a breakout may signal that the correction is ending and the bigger uptrend is resuming. Note that you can re-create this chart for any sector by substituting the sector symbol ($XLEADP becomes $XLKADP).
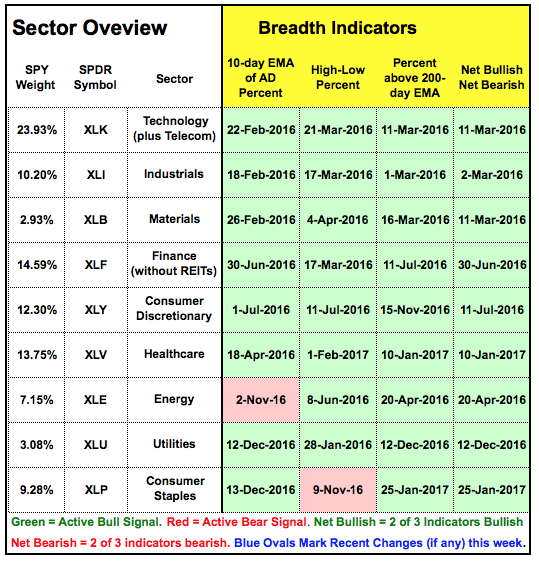
Breadth Indicators are Net Bullish for All Nine Sectors
The table below shows the breadth indicators and their signals for the nine sectors. Green is for a bullish signal, red is for a bearish signal and each box shows the date of the signal. Most importantly, the last column shows when the indicators turned net bullish or net bearish. All are currently net bullish. The top three (tech, industrials and materials) have been net bullish since March. Finance and consumer discretionary have been net bullish since summer. Healthcare turned net bullish earlier this month and energy has been net bullish since April 2016. Note that I am not adding XLRE to my sector table because we do not have breadth indicators yet.
Healthcare Continues to Improve
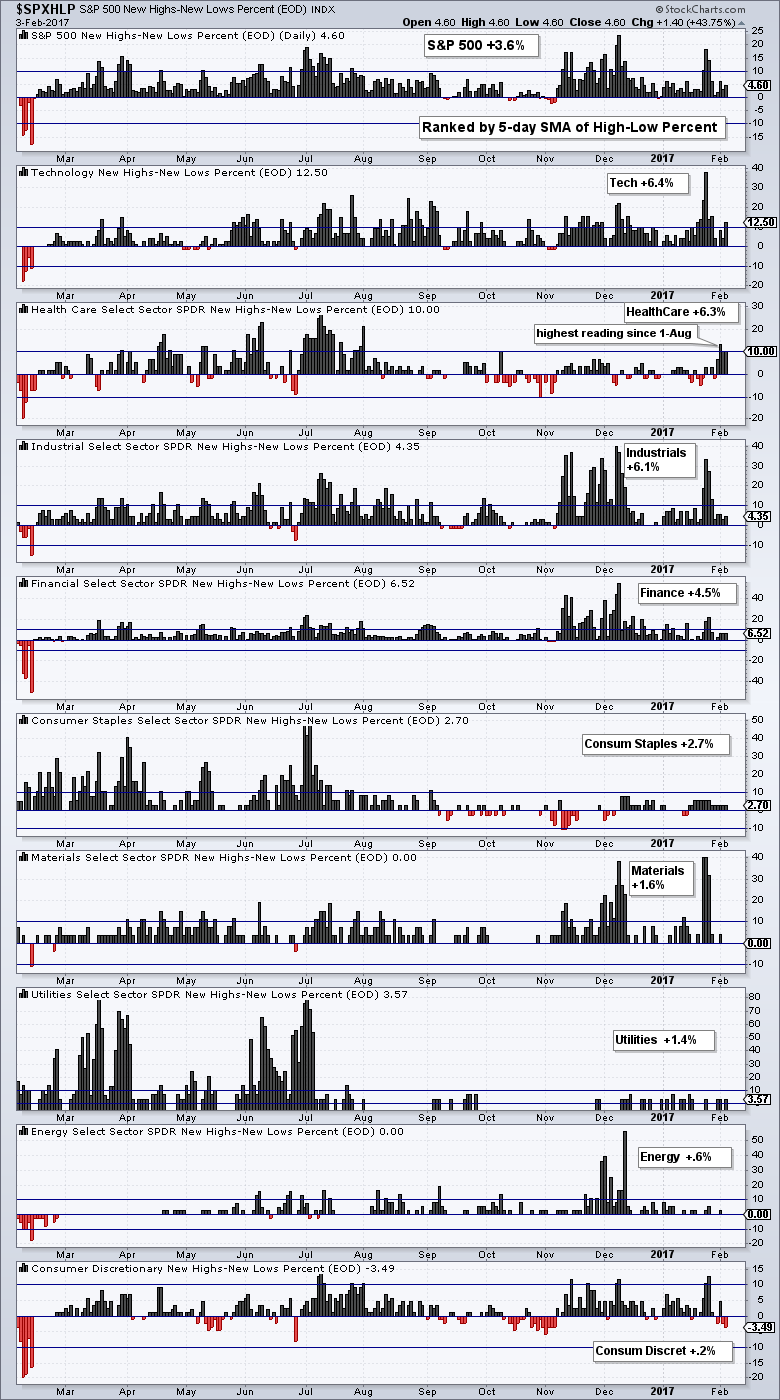
Of note, I am seeing strength within the healthcare sector this week. The table below shows High-Low Percent for the S&P 500 and the nine sectors. The sector High-Low Percent charts are sorted by the 5-day SMA of High-Low Percent. This SMA is not shown on the charts, but I am showing the value for each sector. Tech is leading because the 5-day SMA of XLK High-Low% ($XLKHLP) is at +6.4%. Notice that healthcare is second because the 5-day SMA of Healthcare High-Low% ($XLVHLP) is at 6.3%. High-Low Percent hit 13.3% on Wednesday and this was the highest reading since August 1st. Consumer discretionary is clearly the weakest sector for internal metrics because High-Low Percent was negative three of the last five days.
Tech, Finance, Industrials and Materials Lead
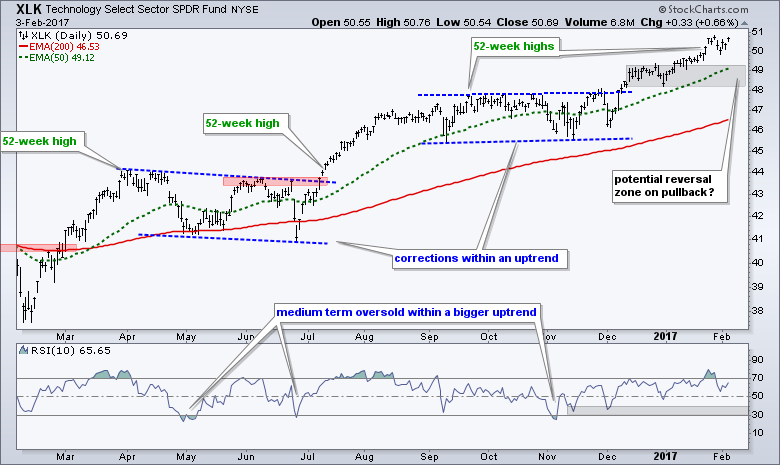
The Technology SPDR (XLK) has the strongest chart because it is the closest to a 52-week high. This chart reflects the challenge with the current market. The long-term trend is clearly up, but the ETF is up over 10% from the early November low and getting a little frothy. This is not bearish. It does, however, warrant a little patience when looking for new long positions. This means it is time to wait for a pullback or corrective period to unfold.
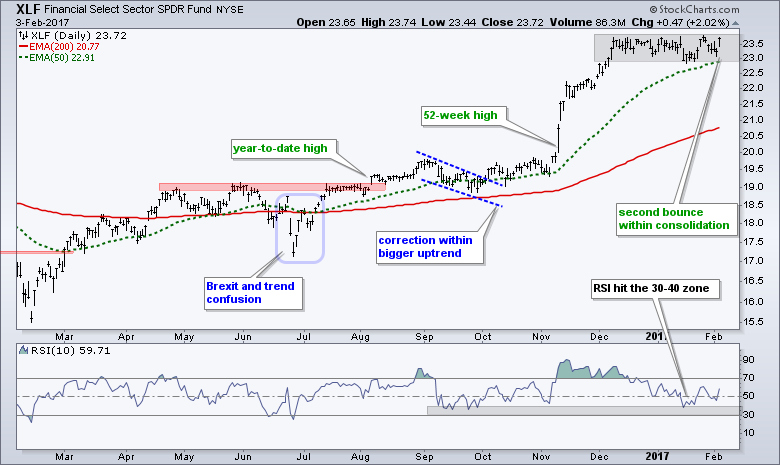
The Finance SPDR (XLF) got another pop within the consolidation. This is the second pop within as many weeks. The long-term trend is unequivocally up and this favors an upside breakout. Note that corrections can involve price, time or both. A sideways consolidation represents a time correction.
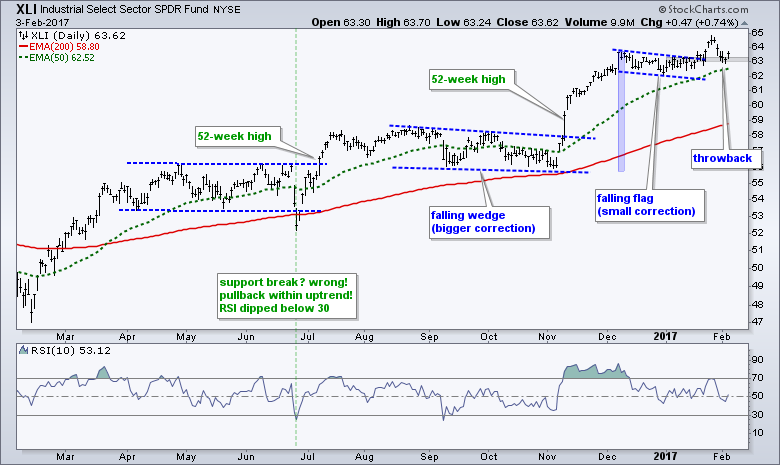
 The Industrials SPDR (XLI) is in a long-term uptrend and recently broke flag resistance. The breakout zone around 63 becomes the first support zone to watch. Notice that the ETF fell back to this area with a classic throwback. A throwback is a small pullback that returns to the breakout zone.
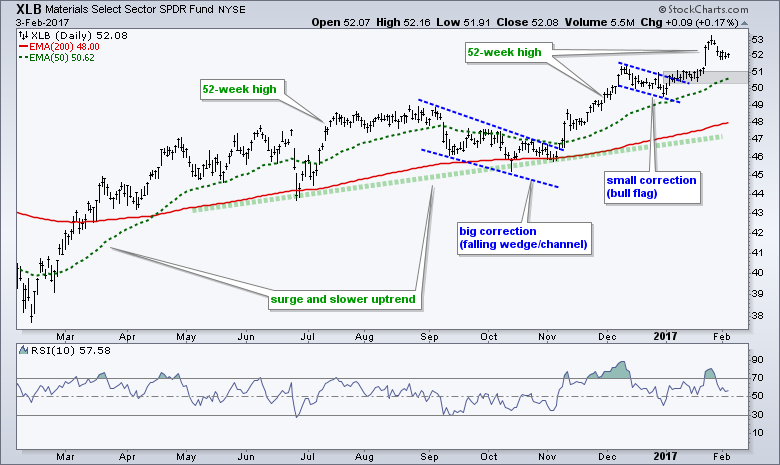
 The Materials SPDR (XLB) surged to a new high last week and then fell back a little this week. Technically, the ETF could fall back even more and perhaps test the breakout zone around 51. This is just short-term speculation though. The big and little trends are clearly up.
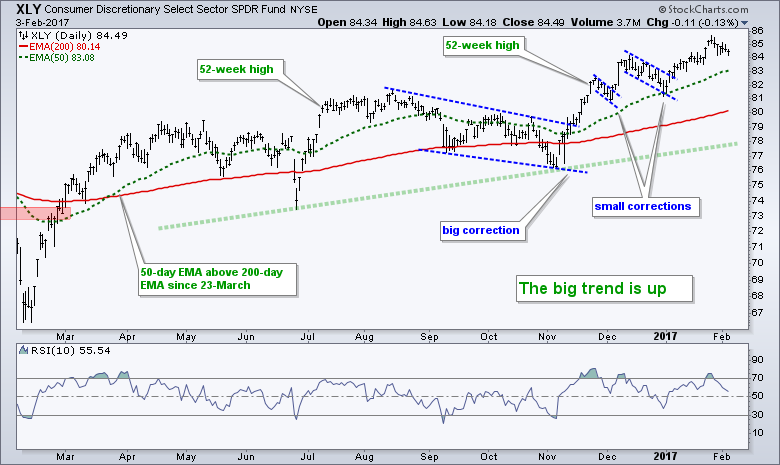
 Even though XLY High-Low% ($XLYHLP) is weak, the market-cap driven Consumer Discretionary SPDR (XLY) hit a new high last week and remains in a long-term uptrend. The ETF fell back this week, but this short decline is not enough for a bullish setup or a mean-reversion opportunity because RSI remains near 55. At this point, XLY is in kind of a "no man's land". The long-term trend is up, but the pullback is not enough to entice me for new long positions.
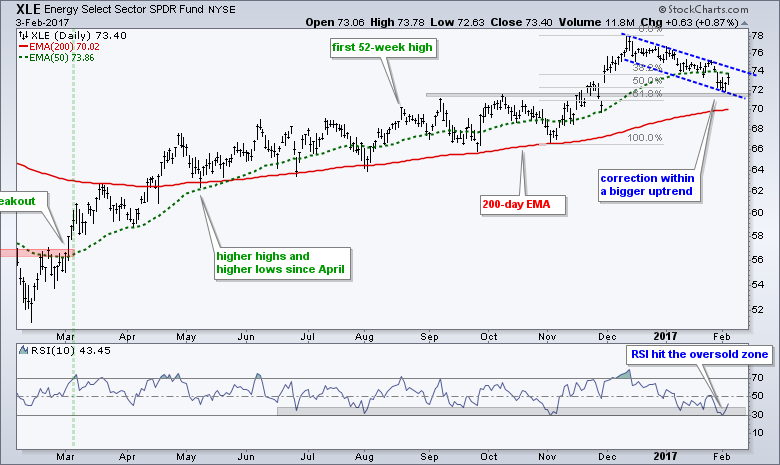
Energy SPDR Hits Key Retracement
The Energy SPDR (XLE) continues to be of interest because it is correcting within a bigger uptrend. Notice that RSI moved into the 30-40 zone for the third time in the last few weeks. This is the oversold zone that puts me on alert for a potential upside move. On the price chart, XLE formed a falling flag and moved to 72 during the week. Also notice that this decline retraced 50-62% of the prior advance and returned to the breakout zone. This is a good spot for a bounce and breakout.
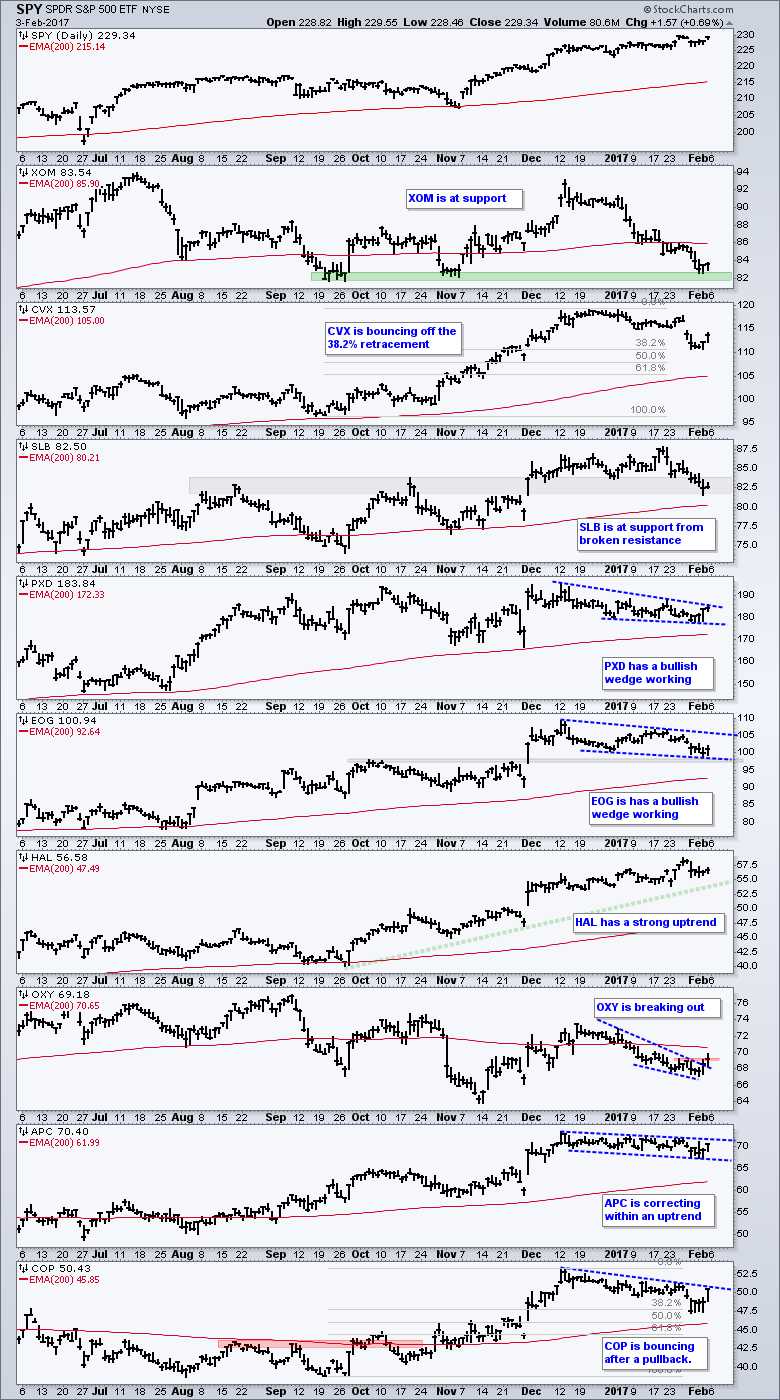
 A sector is only as good as the sum of its parts (component stocks). The next chart shows SPY and the top nine stocks for XLE. XOM and SLB are in support zones. PXD and OXY are breaking out of corrective patterns. APC and EOG remain in corrective patterns.
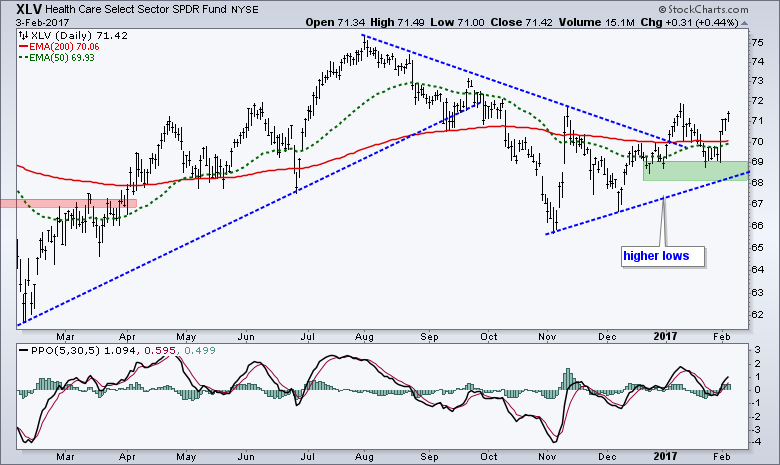
Glass Turns Half Full for Healthcare
My love-hate relationship with the HealthCare SPDR (XLV) is back to love. This has been one of the harder sectors to pinpoint over the last few weeks. At this point, I see a successful support test in the 68.5 area and a breakout surge this week. XLV is back above its 200-day EMA (red) and the 50-day EMA is close to crossing above the 200-day EMA. I will mark support in the 68-69 area.
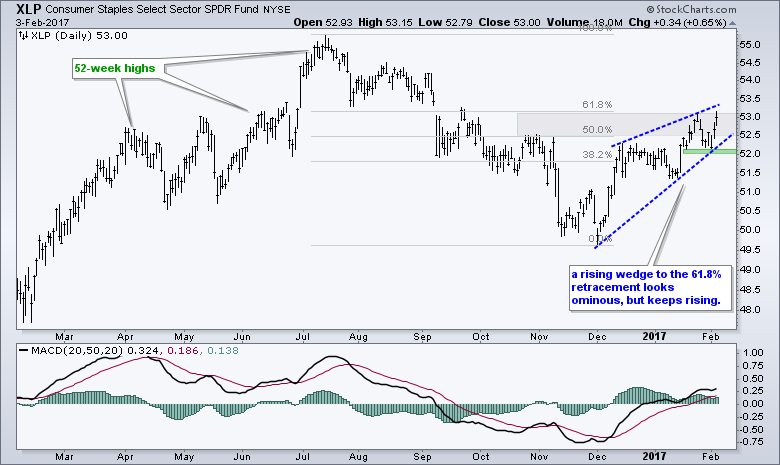
Staples and Utilities Battle Key Fib Retracement
The Consumer Staples SPDR (XLP) put in another strong performance this week and remains in an uptrend. Even though I am wary of this move because the 61.8% retracement looms, I have to respect the upswing as long as support at 52 holds and MACD (20,50,20) holds above its signal line. Note that these MACD settings are designed to capture the current advance. Yes, it is totally curve-fitted to capture the move since early December.
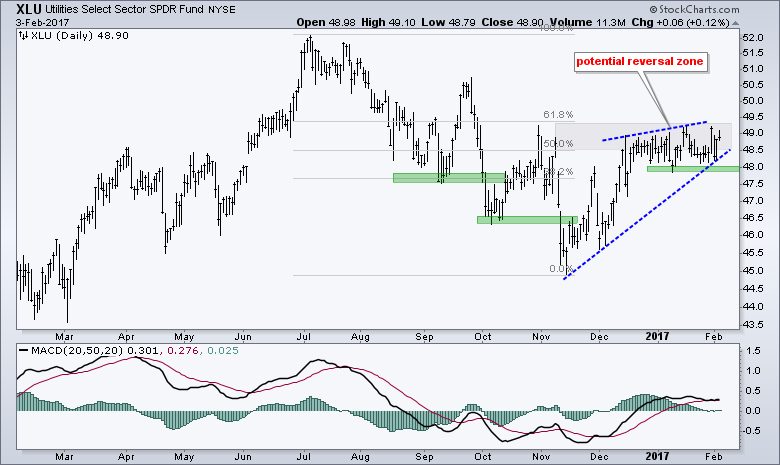
 I am also not that enamored with the Utilities SPDR (XLU). First, we are in a bull market and this favors offensive sectors, not defensive sectors. Second, I think the 10-yr yield is in a long-term uptrend and this is negative for utilities (and staples). The price chart is the same as with XLP. A rising wedge to the 61.8% retracement defines the uptrend with support at 47.8.
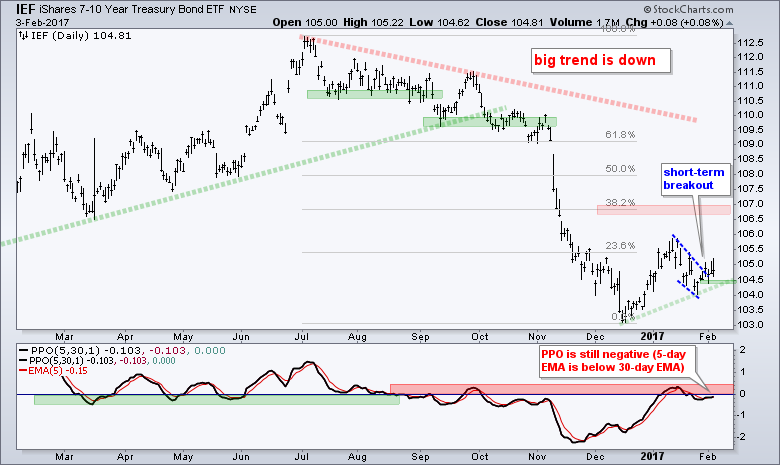
IEF Bounces, but TLT Remains Subdued
The 7-10 YR T-Bond ETF (IEF) got a modest bounce this week, but I think the long-term trend is down and it will override this bounce. On the price chart, IEF, broke out of a small wedge and I will mark support at 104.4 now. I would not play a small upside breakout when the bigger trend is down. Instead, a break below 104.4 would provide the first sign that this bounce is ending and the bigger downtrend is resuming.
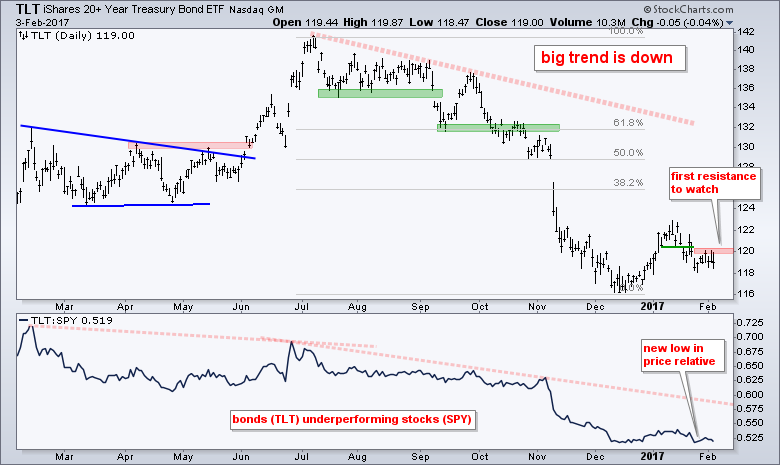
 I will be watching the 20+ YR T-Bond ETF (TLT) for clues. Notice that TLT did not bounce this week and remains below the short-term support break. TLT consists of longer dated Treasuries and it is more sensitive to interest rate changes than IEF. This is called "duration" and the good folks at BlackRock explain it well. A break above 120.5 in TLT would signal a short-term upturn that would negate the break down.
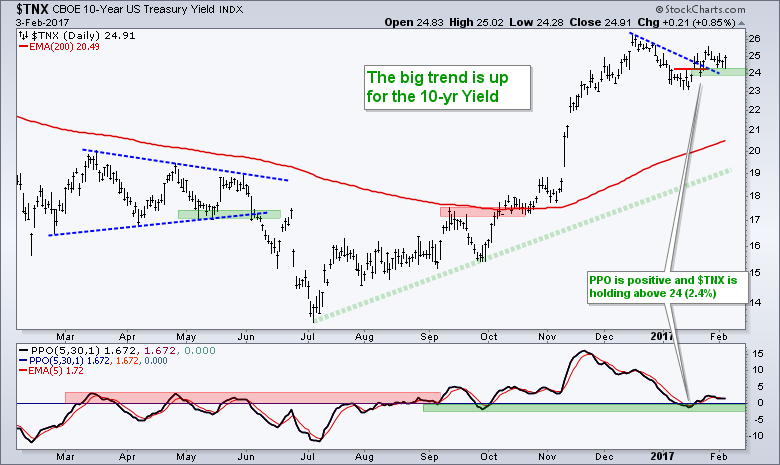
 The next chart shows the 10-yr T-Yield ($TNX) breaking out last week and falling back this week. I would have expected the yield to move higher after non-farm payrolls, but it fell back instead. A break below 23.9 (2.39%) would suggest a failed breakout and that the 10-yr yield is moving lower.
Gold Moves back into the Reversal Zone
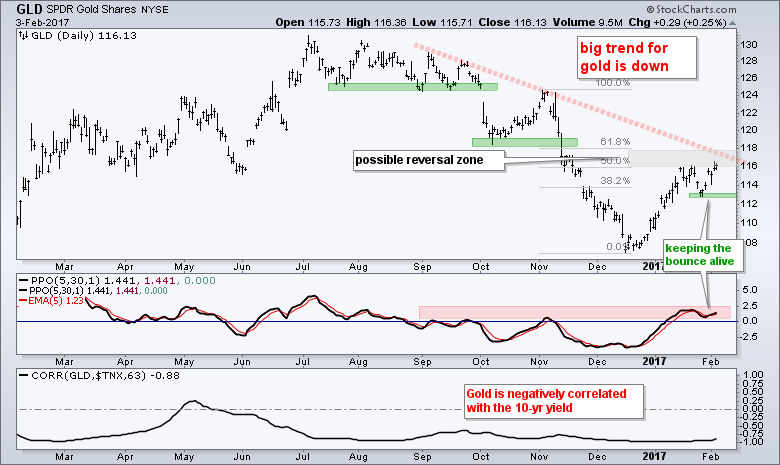
The Gold SPDR (GLD) had a good week with a 2+ percent bounce, but this does not change my overall opinion. The long-term trend is down and the bounce from 107 to 116 is viewed as a counter-trend move. Once again, this bounce is at its moment-of-truth with the 50-61.8% retracement zone in play. The late January low establishes first support. A support break and PPO move below zero would signal a trend reversal here. I will analyze GDX on Tuesday, but note that the correlation between GLD and GDX is very very high.
Oil Remains Dull, but in an Uptrend
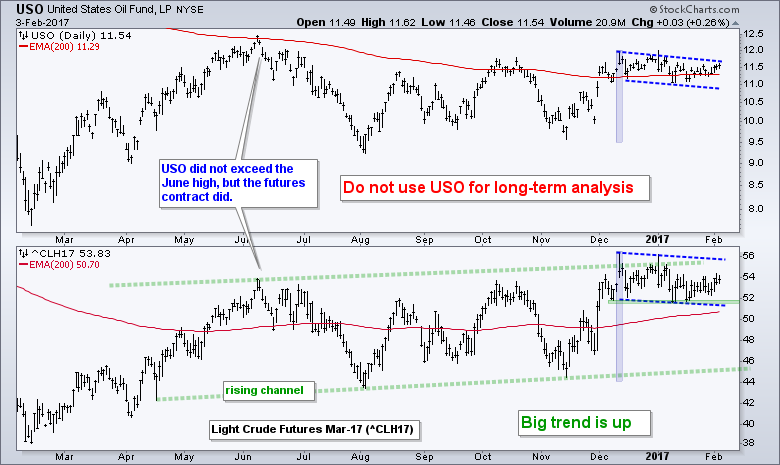
Oil bounced with a small move off support from the January lows. The lower window shows March Crude (^CLH17) hitting the 52 area in mid January and edging higher the last two weeks, and I do mean edging. Overall, the big trend is up because March Crude hit a 52-week high in mid December. The short-term trend is technically down, but this looks like a bull flag.
Dollar Extends Correction
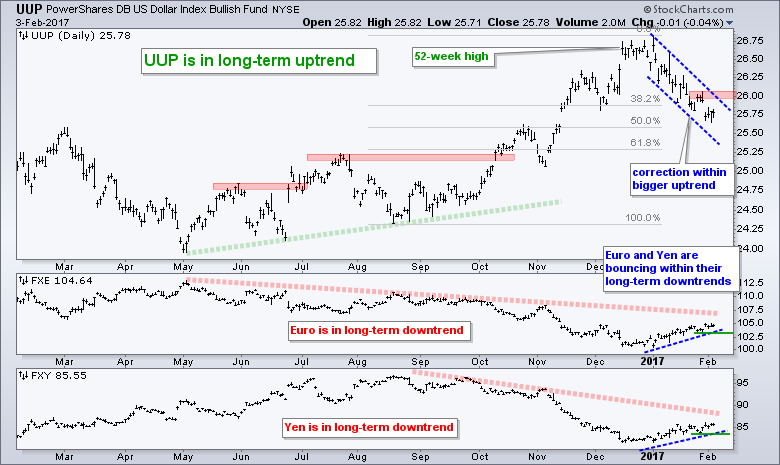
The US Dollar ETF (UUP) fell on Tuesday and never got up. Again, my overall assessment remains the same. The big trend is up and the decline in 2017 is viewed as a correction within this bigger uptrend. This decline has now retraced around 50% with a falling channel of sorts. A break above 26.1 would reverse this slide and signal a continuation of the bigger uptrend. Gold could maintain its bid as long as UUP remains in this channel.

****************************************
Thanks for tuning in and have a good day!
--Arthur Hill CMT
Plan your Trade and Trade your Plan
*****************************************


