.... Small-caps Hold Breakout, but Still Lag
.... A Classic Throwback for Nucor
.... Oil Remains Stuck in Consolidation
.... Watch the Big Three (XOM, CVX, SLB) for Clues on XLE
.... Two Oil Refiner Stocks (MPC, VLO)
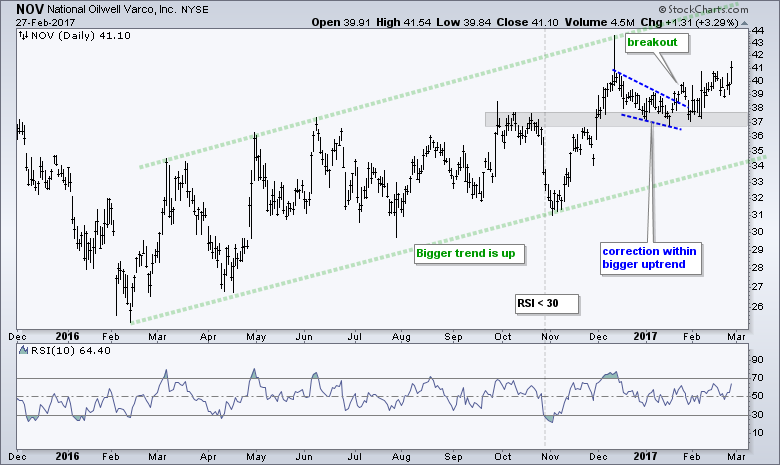
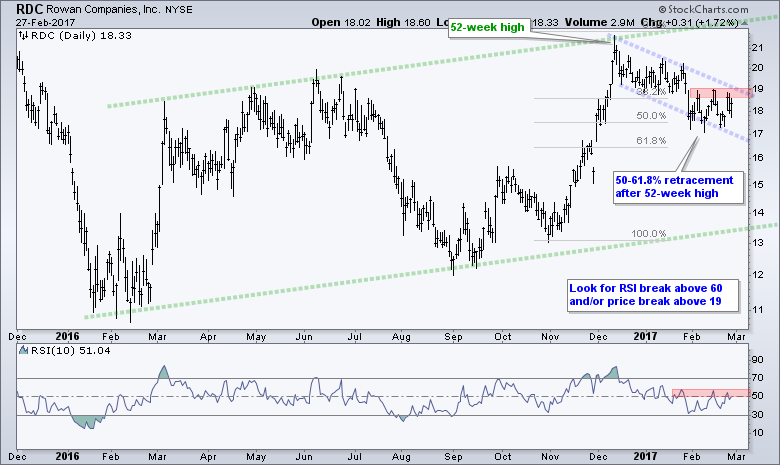
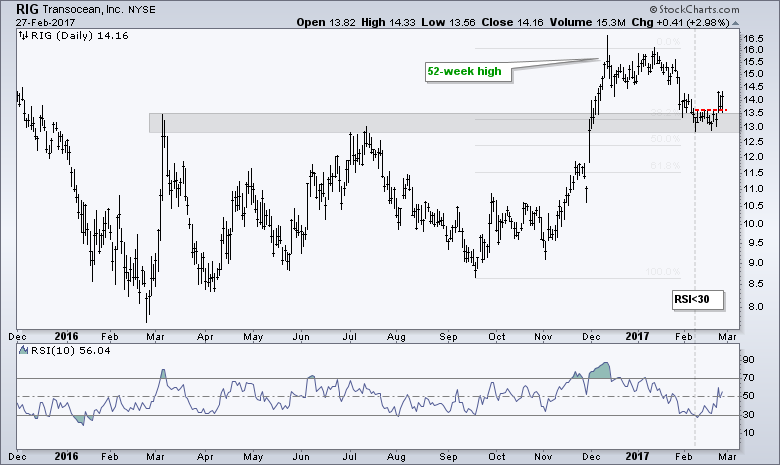
.... Four Oil & Gas Equipment and Services Stocks (NE, NOV, RDC, RIG)
.... Fibonacci Retracements are Not Science (JBLU, SKYY, UAL)
.... The Squeeze Play is on for Ford
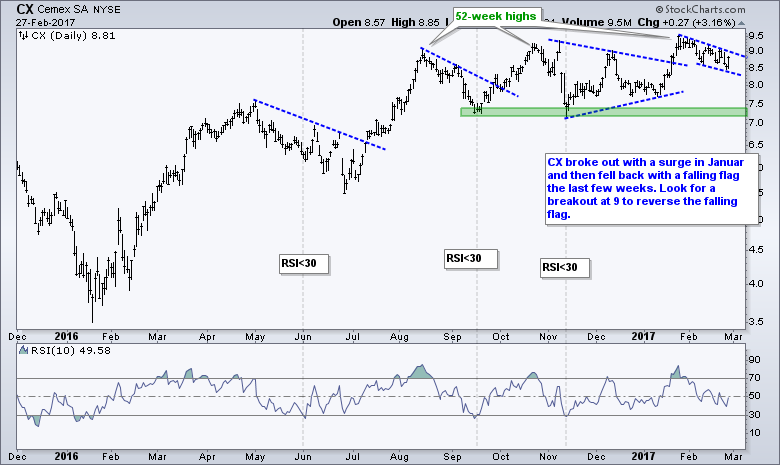
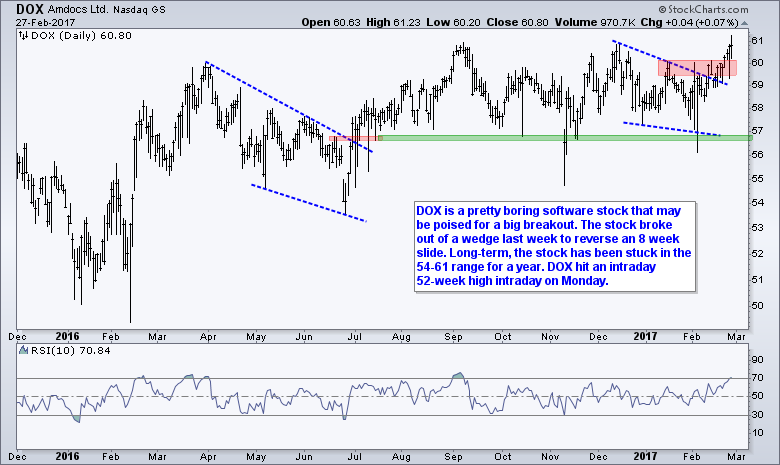
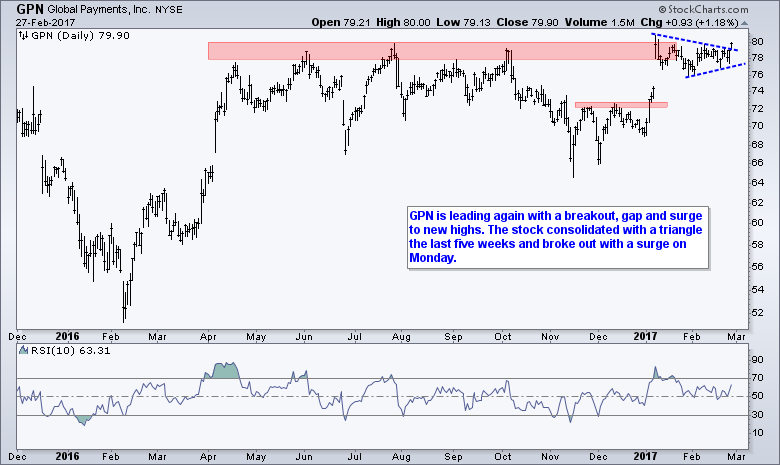
.... Four More Bullish Charts (NAVI, CX, DOX, GPN) ....
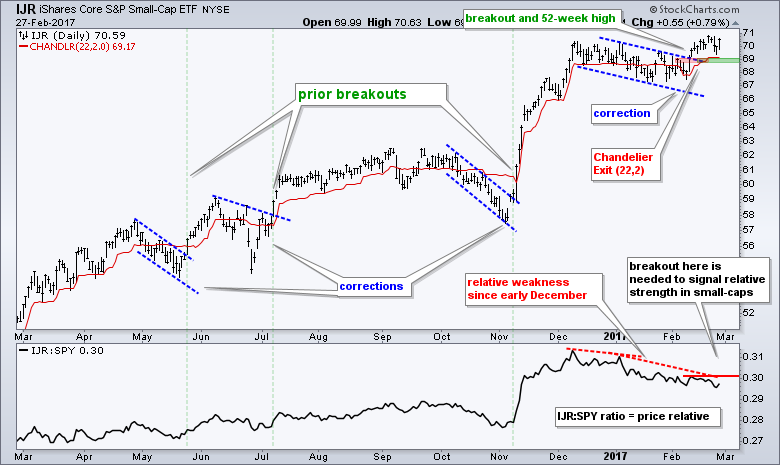
Small-caps Hold Breakout, but Still Lag
Just when you are about to give up on small-caps, they surprise and take the lead - for a day at least. The S&P SmallCap iShares (IJR) broke out of a corrective pattern two weeks ago and looked as if it might start outperforming again. The breakout is holding, but the price relative continues to sink. The indicator window shows the IJR:SPY ratio peaking in early December and hitting a 2017 low last week. Chartists should watch the February high in this price relative for a breakout that would signal relative strength in small-caps. On the price chart, IJR continues to hold the breakout and a close below 68.8 would call for a re-evaluation.
Even though the market looks ripe for a correction, the trends are clearly up and the trend is the dominant force at work. President Trump speaks tonight and this could trigger violent moves in certain sectors or industry groups, or even the market overall. However, I do not know which way because I do not know what he will say or how the market will react.
Programming note: I am settling into a new rhythm here in 2017. Tuesday will focus on stocks, Thursday will focus on the System Trader Articles and Friday-Saturday will feature the Weekly Market Review & Outlook, which will focus on ETFs. Note that stocks are still extended when measured using the S&P 500, Dow Industrials or Nasdaq 100.
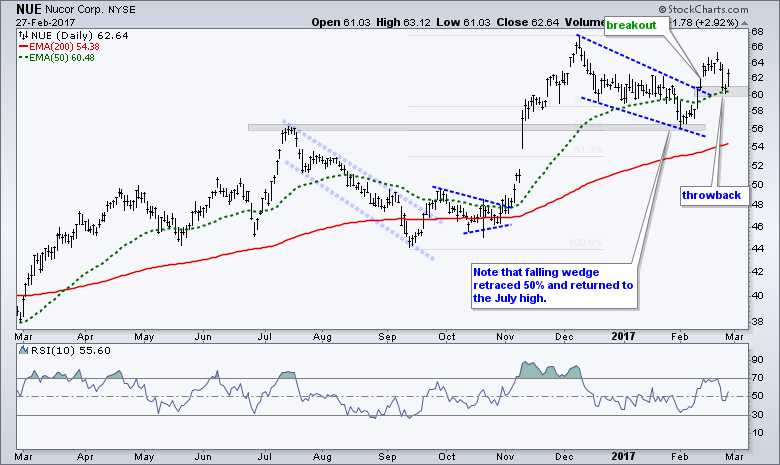
A Classic Throwback for Nucor
Nucor (NUE) and Schnitzer Steel (SCHN) were featured on February 14th after their breakouts. Both fell back to their breakout zones last week and this looks like a classic "throwback". I am not featuring SCHN today because the company reports earnings next week. The chart below shows NUE breaking out of the channel/wedge around 60-61 and this zone turning into support (gray zone) as the stock bounced on Monday.
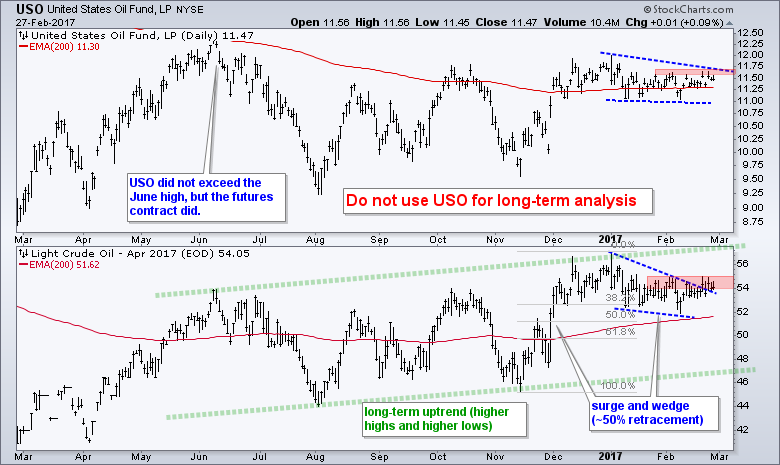
Oil Remains Stuck in Consolidation
The next nine stocks come from the energy sector, which may be a bit overkill because they are positively correlated. First and foremost, chartists should watch the price of oil for clues on XLE, XES, XOP and energy-related stocks. They will rise if April Crude (^CLJ17) breaks above $55 and the USO Oil Fund (USO) breaks above 11.75. Such moves would break falling wedge resistance and signal a continuation of the November-December advance.
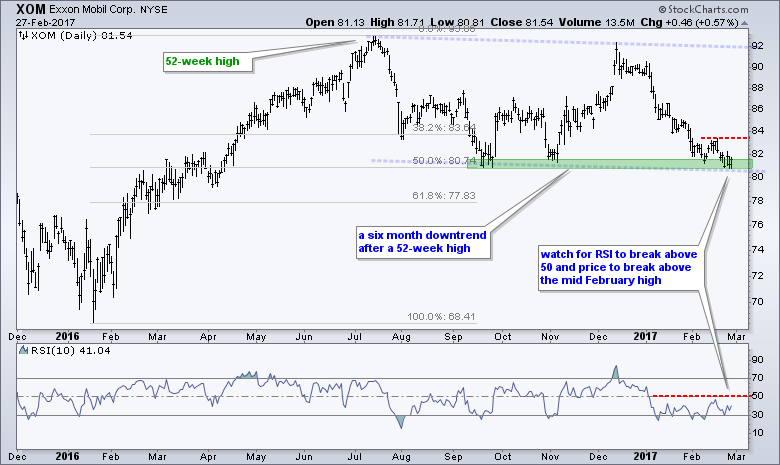
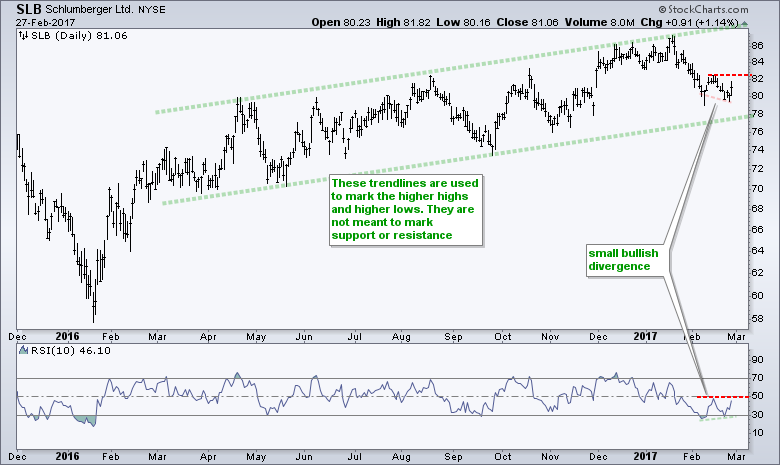
Watch the Big Three (XOM, CVX, SLB) for Clues on XLE
Chartists interested in XLE should watch XOM, CVX and SLB because these three account for around .39% of the ETF. The first chart shows XOM, which is perhaps the weakest of the big energy stocks. The stock formed a lower high in December and is currently testing the September-November lows. A sustainable bounce is proving futile so far. Watch for RSI to break above 50 for a momentum breakout. Watch for price to break above the mid February high to reverse the downswing within the bigger falling channel.
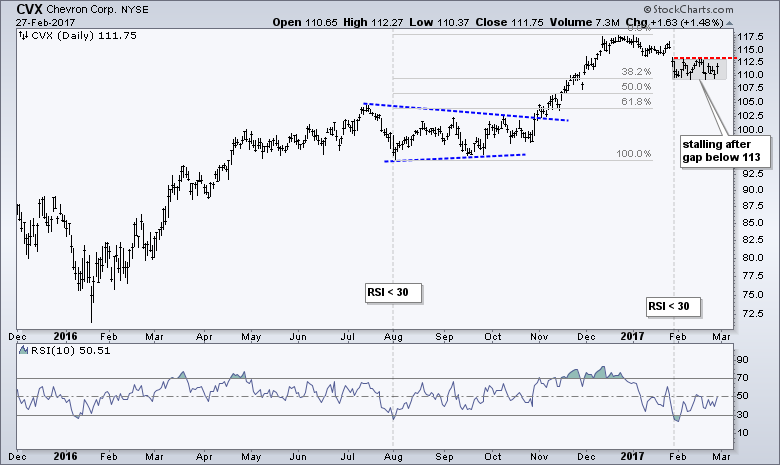
Chevron (CVX) is holding up a lot better than XOM. The stock hit a 52-week high in December and the recent decline retraced around 38% of the August-December advance. The stock gapped below 113 on 27-Jan and consolidated the last few weeks. Look for a break above 113 to revive the uptrend and a break below the consolidation lows to signal further weakness. The indicator window shows RSI moving below 30 at the end of January. Thus, the oversold signal is there for a mean-reversion trade.
Schlumberger (SLB) is in a long-term uptrend with higher highs and higher lows since March. I drew trendlines to mark a rising channel, but I do not view these as support or resistance. They just help define the overall trend, which is clearly up. SLB is at an interesting juncture because it pulled back within this uptrend and RSI dipped below 30 twice. Also notice that a small bullish divergence formed in RSI over the last few weeks. An RSI break above 50 would be bullish for momentum. Note that I use divergences sparingly because most bullish divergences occur in downtrends and most bearish divergence occur in uptrends.
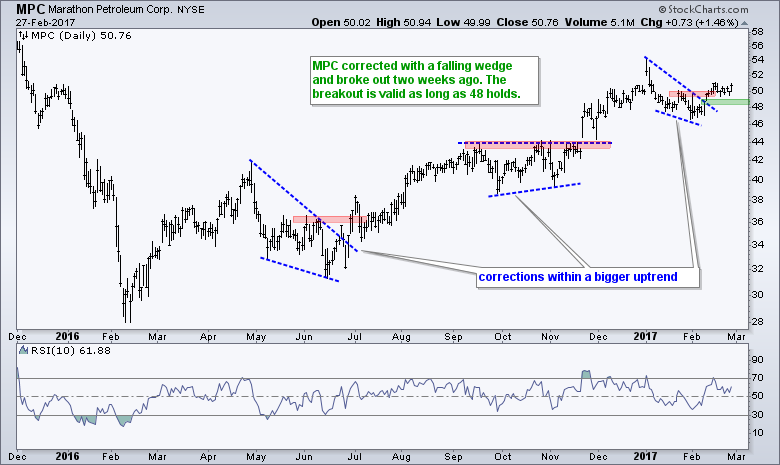
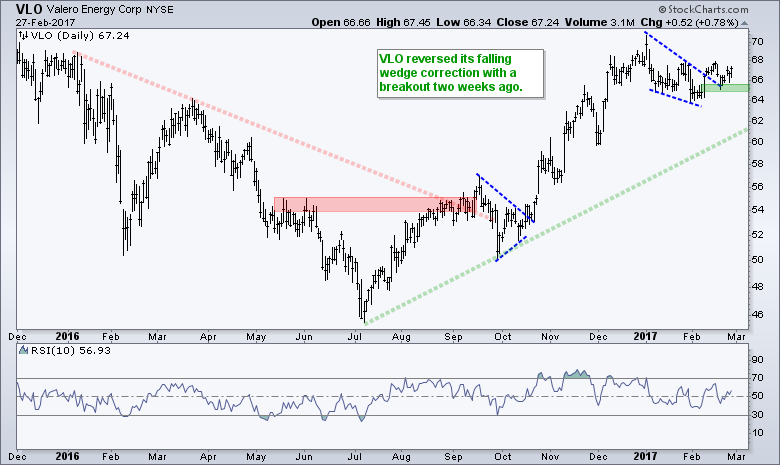
Two Oil Refiner Stocks (MPC, VLO)
The next two stocks are part of the oil refining group or the downstream portion of the oil business. These stocks are less dependent on the price of oil. MPC and VLO are clearly in long-term uptrends. They corrected with falling wedges this week and broke out two weeks ago.
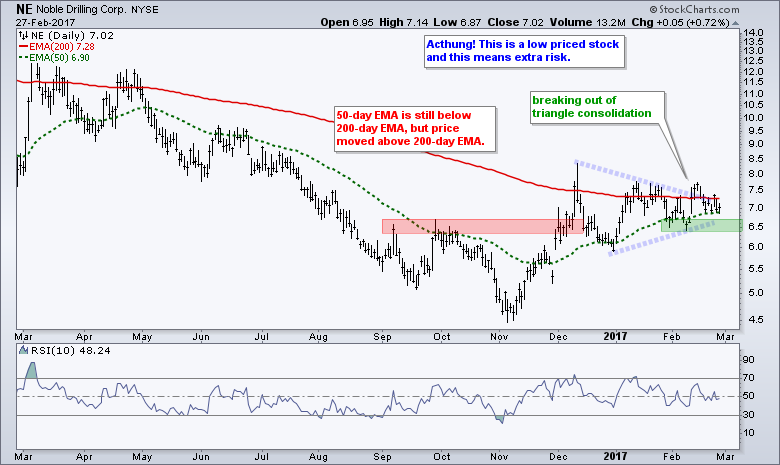
Four Oil & Gas Equipment and Services Stocks (NE, NOV, RDC, RIG)
The next four stocks are part of the Oil & Gas Equipment & Services SPDR (XES). In contrast to the refiners, these stocks are perhaps the most highly correlated with the price of oil. Demand for equipment and services increases with the demand for drilling, which is dependent on the price of oil.
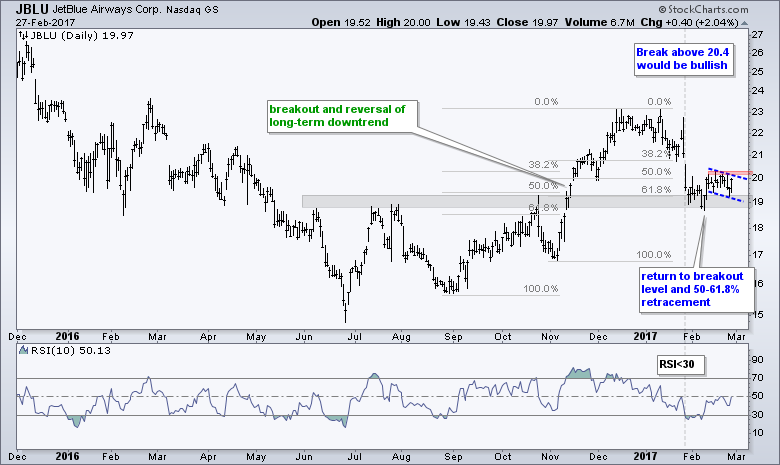
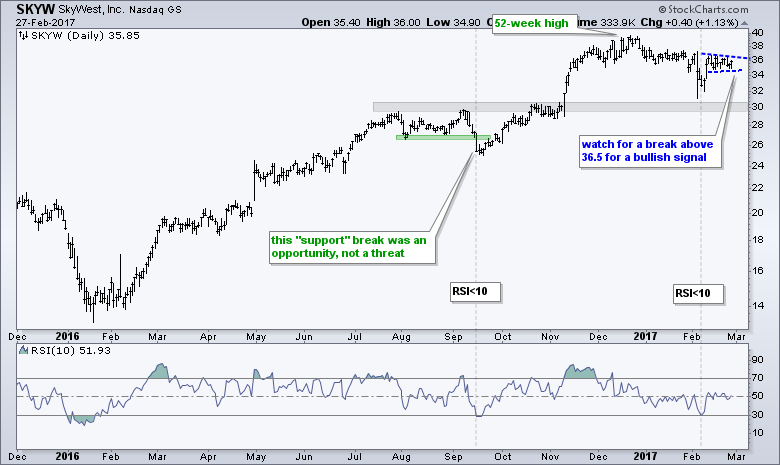
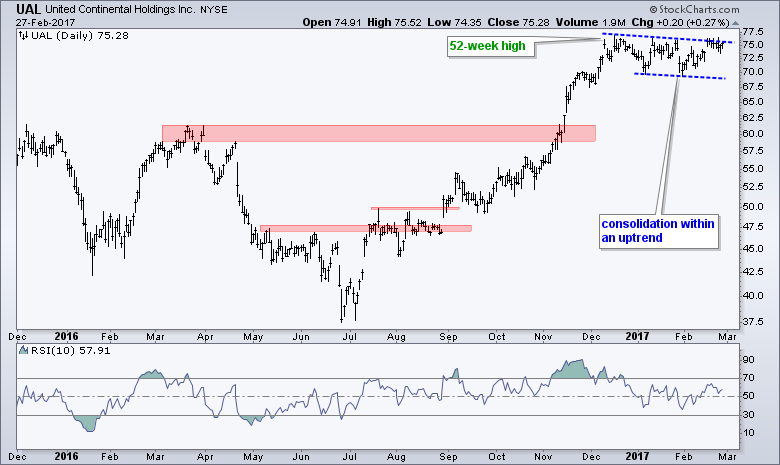
Fibonacci Retracements are Not Science (JBLU, SKYY, UAL)
The next three stocks come from the airline group, which is strong because the Airline ETF (JETS) hit a 52-week high in mid February. The first one, JetBlue (JBLU), highlights the challenge with drawing Fibonacci retracements. The high is usually easy to spot, but picking the prior low is not as easy. On the JBLU chart, I drew the Fibonacci Retracements from the late August low and from the early November low. It does not really matter in most cases because I am using the Fibonacci Retracements Tool to get a "general idea" of how far the pullback has extended. Pullbacks can extend 35%, 39%, 44%, 51% or 67%. They can also extend 36%, 42%, 57% or 63%. You get the idea. It is not an exact science. I am not using the Fibonacci Retracements Tool to pick a buy point. Instead, it is just a tool to tell me the extent the current pullback. Pullbacks within bigger uptrends represent opportunities. Thus, I start watching closely when a stock retraces 38% to 62% of the prior decline and RSI(10) enters the 30-40 area.
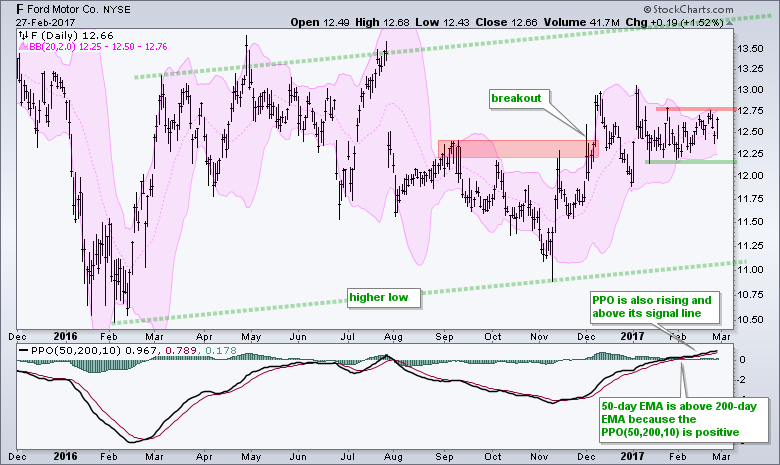
The Squeeze Play is on for Ford
The Ford chart is quite a mess, but I do see an overall uptrend and a Bollinger Band squeeze as the range narrows. First, the green lines define a wide uptrend with the higher low in early November. Second, the stock surged in November-December and broke a clear resistance zone. Even though Ford fell back below the breakout, I would not consider this a "failed" breakout just yet. Notice that the stock is just consolidating around the breakout zone with a narrowing range. The Bollinger Bands also contracted and this means Ford could make a move soon. A breakout at 12.8 would be bullish, while a break below 12.1 would be bearish.
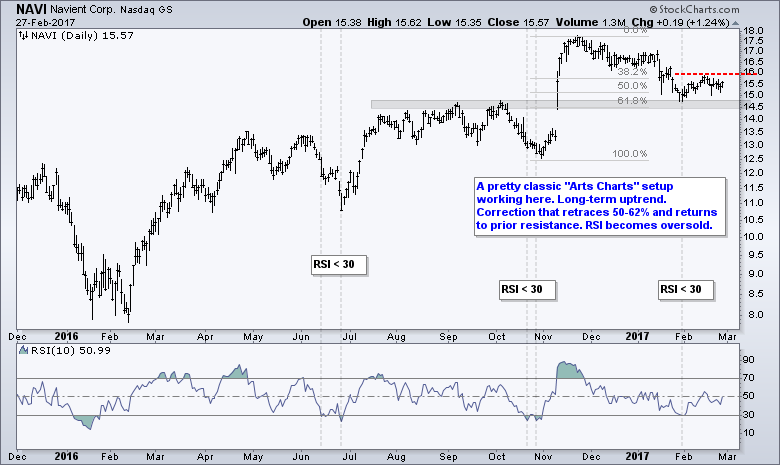
Four More Bullish Charts (NAVI, CX, DOX, GPN)
******************************************************
Spotting Pullbacks and Upturns within an Uptrend using RSI and MACD Histogram.
Difference between EMA and SMA - Using %Above 200-day EMA for Breadth Analysis.
Backtesting Different Moving Average Pairs with SPY, QQQ and IWM.
ETF Master ChartPack - 300+ ETFs organized in a Master ChartList and in individual groups.
Follow me on Twitter @arthurhill - Keep up with my 140 character commentaries.
****************************************
Thanks for tuning in and have a good day!
--Arthur Hill CMT
Plan your Trade and Trade your Plan
*****************************************