.... Introduction
.... Review of the Testing Period
.... Universe, Timeframe and Data
.... Stock Market and Portfolio Benchmark
.... Trend-Timing System using the PPO
.... Different Faces of Momentum
.... Market Filter, Trend Filter and Momentum
.... Scanning Code Sample
.... Testing Four Momentum Indicators
.... Equity Line and Drawdown Chart
.... Conclusions
Introduction
Last week I presented a trend-timing system and a momentum-rotation system using the nine sector SPDRs. Today I will expand the data set to 58 ETFs and backtest from 2007 until 2017. I will look at results for buy-and-hold, trend-timing using the PPO(10,40,1) and four different momentum-rotation systems. Note that these systems are not designed to run straight out of box. These articles are designed to help us understand different systems and prepare for the inevitable drawdowns. help in our development as systematic traders. Past performance does not guarantee for future performance.

Reviewing the Testing Period
The test period extends from 28-May-2007 to 28-February-2017, almost 10 years. I selected this period because I was able to find 58 ETFs with data back to 2006. I am sure there are more, but I settled on this group for its diversity. Several of these ETFs started trading in mid 2006 so I started the test in mid 2007 to insure enough data for 40-week EMAs.
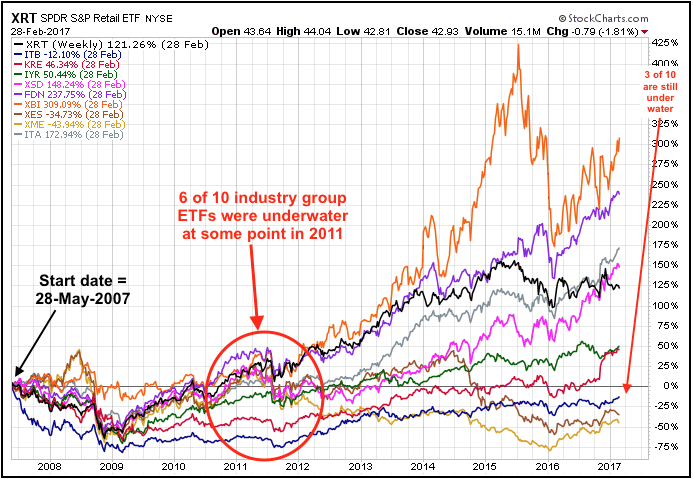
It is important to first get an idea of the broad market environment during the testing timeframe. The PerfChart below shows the Performance of 10 industry group ETFs from May 2007 until February 2017. First, note that six of the ten were underwater at some point in 2011. This tells us that the period from 2007 to 2011 (4+ years) was difficult for stocks. Second, note that three of the ten are still underwater even with the massive bull-run over the last few years.
Universe, Timeframe and Data
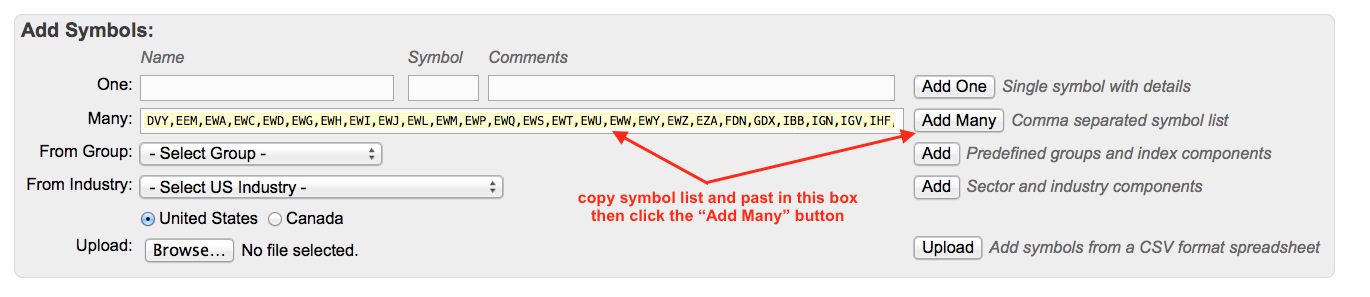
The trading universe includes the iShares international ETFs, the nine sector SPDRs, the major index ETFs (SPY, IJR, MDY, QQQ, RSP, IWM) and dozens of industry-group ETFs. I did not include any commodity or bond ETFs because this is a stock market system designed to make the most of bull runs. Below is a comma separated symbol list that readers can use to create a ChartList. Here is a link on how to create a ChartList.
DVY,EEM,EWA,EWC,EWD,EWG,EWH,EWI,EWJ,EWL,EWM,EWP,EWQ,
EWS,EWT,EWU,EWW,EWY,EWZ,EZA,FDN,GDX,IBB,IGN,IGV,IHF,IHI,
IJR,ITA,ITB,IWM,IYR,IYZ,KIE,KRE,MDY,PBJ,PSP,QQQ,RSP,SPY,VFH,
XBI,XES,XHB,XLB,XLE,XLF,XLI,XLK,XLP,XLU,XLV,XLY,XME,XOP,XRT,XSD
Stock Market and Portfolio Benchmark
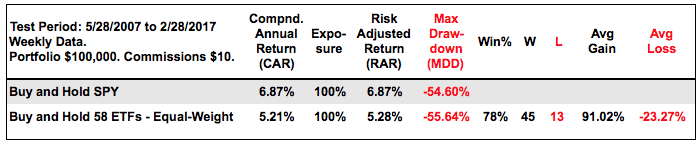
The table below shows buy-and-hold for the S&P 500 SPDR (SPY) and the 58 ETFs, which are the default benchmarks against which we can compare other systems. Investors buying and holding SPY during this period would have earned 6.87% per annum with a 54.6% Maximum Drawdown (2008 financial crisis). Investors with an equal-weight portfolio of all 58 ETFs would have fared worse. The Compound Annual Return was much lower and the Maximum Drawdown was slightly higher.
Trend-Timing System using the PPO
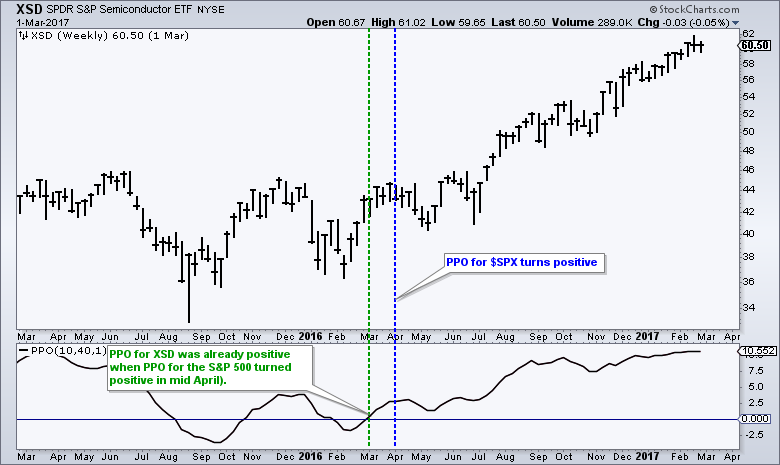
The first system is a trend-timing system that buys an ETF when the PPO(10,40,1) is already positive or turns positive, and sells when the PPO turns negative. Note that the PPO turns positive when the 10-week EMA crosses above the 40-week EMA. The system uses a market trend filter to decide when to take signals in stock-related ETFs and when to be out. Sometimes an ETF already has a positive PPO when the S&P 500 triggers. This is a form of relative strength because the ETF triggered bullish before the market. The Semiconductor SPDR (XSD) chart shows an example of an earlier signal and an extended uptrend.
The system takes buy signals when the PPO(10,40,1) for the S&P 500 is positive and does not take buy signals when the PPO is negative. Existing positions are closed when the individual ETFs trigger sell signals. The PPO system for SPY alone returned a respectable 7.6% with a 17% Maximum Drawdown and only five trades. The system using the nine sector SPDRs returned a little less, but the Maximum Drawdown was much less.
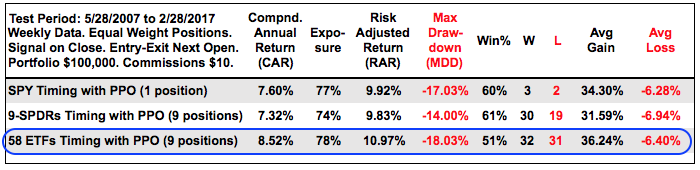
The last line shows backtest results for the PPO system using the 58 ETFs. I added a position score to this system because sometimes more than one ETF triggers a buy signal (PPO turning positive). When there are too many signals, I narrow the list by selecting the ETF(s) with the highest 26-week Rate-of-Change. The table shows that this system had the highest Compound Annual Return (8.52%) and also the highest Maximum Drawdown (18.03%), which makes sense because an increase in return is usually accompanied with an increase in risk. Notice that the Win% was around 50% with 32 winners and 31 losers. The system made money because the Average Gain was almost six times the average loss.
Different Faces of Momentum
The next four systems will test different momentum indicators. These include the 26-week Rate-of-Change, 26-week RSI, 52-week Fast Stochastics and the PPO(10,40,1). Rate-of-Change and RSI are pretty straightforward so I will just cover the latter two with chart examples. Keep in mind that you can learn more about these indicators in our ChartSchool.
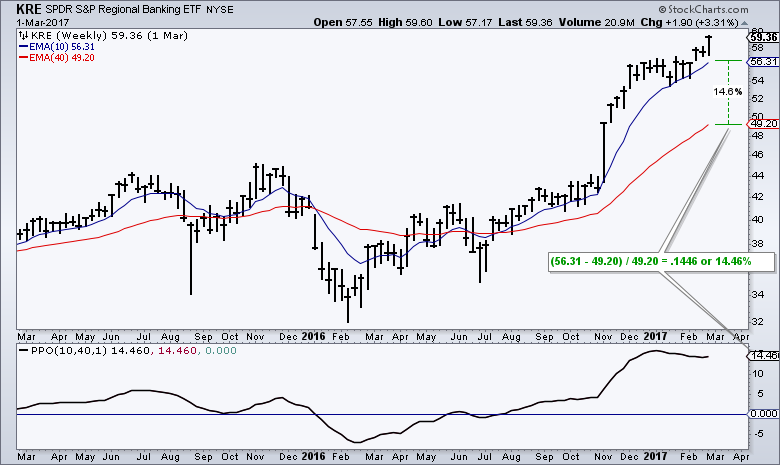
The chart below shows the Regional Bank SPDR (KRE) with the 10-week EMA, 40-week EMA and the PPO(10,40,1), which measures the percentage difference between the two EMAs. The 10-week EMA is currently 14.46% above the 40-week EMA. I used the percentage change tool to illustrate this as well, but some rounding issues forced it to show 14.60%. Basically, the further the 10-week EMA is above the 40-week EMA, the more momentum.
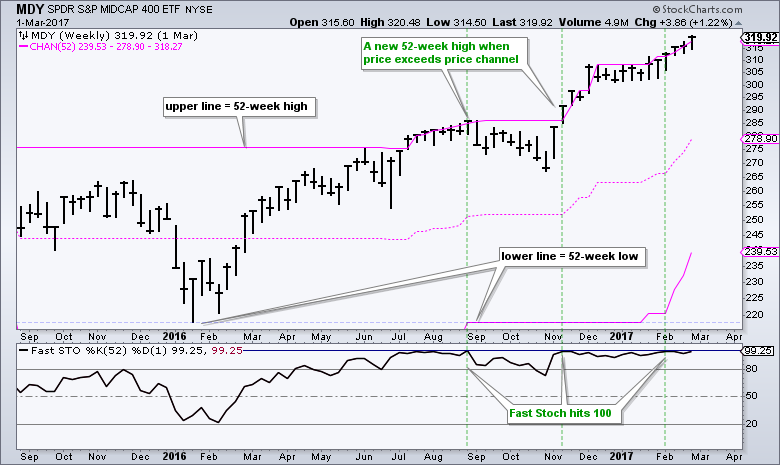
The next chart shows the S&P MidCap SPDR (MDY) with the 52-week Price Channel and the Fast Stochastic (52,1). The upper line of the Price Channel marks a 52-week high and the lower line a 52-week low. This means MDY records a new high when it exceeds the upper line. Also notice that the 52-week Fast Stochastic hits 100 at a 52-week high. Thus, we know that price is near a 52-week high when Fast Stochastic (52,1) is near 100. This is valuable information because ETFs near 52-week highs are in uptrends.
Market, Trend and Momentum
The four momentum-rotation systems have a market trend filter and an ETF trend filter, which means the PPOs for the S&P 500 and the individual ETFs must be positive before taking signals. The systems buy the nine ETFs with the highest indicator values and sell when their rank drops below the 29th spot (midpoint of the 58 ETF universe).
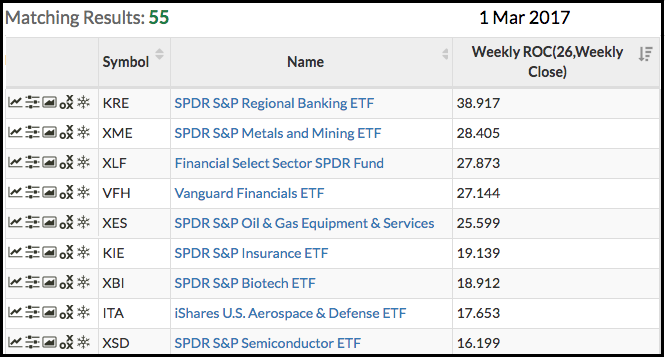
The table below shows scan results for the 26-week Rate-of-Change from March 1st. The PPO for the S&P 500 is currently positive and the PPO is positive for 55 of the 58 ETFs. I then ranked these 55 ETFs by the 26-week Rate-of-Change.
Scanning Code Sample
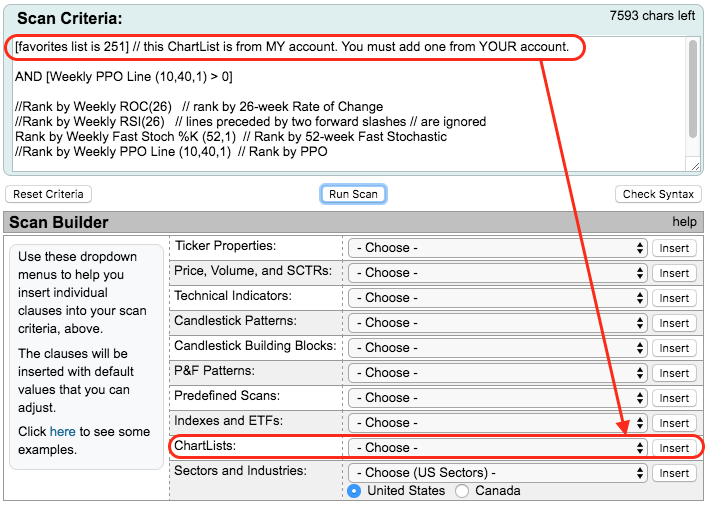
The image and text below show sample scan code. Lines proceeded by two forward slashes // are ignored. I used these to place comments after the scan code. Also notice that the last three lines were ignored because we can only rank by one indicator at a time. Add // to the first Rank line to ignore it and remove // from another line to activate it.
[favorites list is 251] // You must add a ChartList from YOUR account.
AND [Weekly PPO Line (10,40,1) > 0]
Rank by Weekly ROC(26) // rank by 26-week Rate of Change
//Rank by Weekly RSI(26) // rank by weekly RSI
//Rank by Weekly Fast Stoch %K (52,1) // rank by 52-week Fast Stochastic
//Rank by Weekly PPO Line (10,40,1) // rank by PPO
Testing Four Momentum Indicators
The results show that the two non-traditional momentum indicators performed better than the two traditional momentum indicators. The 26-week Rate-of-Change had the lowest return and a very high Maximum Drawdown. By the way, the results for 13-week ROC and 5-week ROC not good either. The PPO(10,40,1) had the third lowest return and the highest Maximum Drawdown. The Win% (58) and Average Gain/Loss (16.16%/8.51%) were respectable, but the overall results were not.
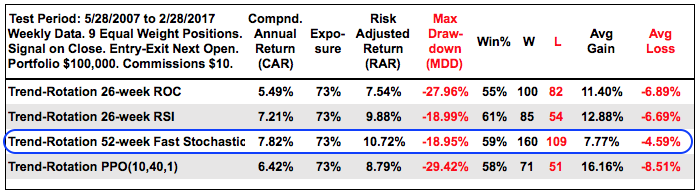 The systems using 26-week RSI and 52-week Fast Stochastic returned over 7% and the Maximum Drawdowns were below 20%, which are still a bit high. Notice that the Win% was around 60%. The Fast Stochastic system was the most active system with 279 total trades. This is not for the entire ten year period because the system was exposed just 73 percent of the time (~7.3 years). The Average Gain/Loss (7.77%/4.59%) was the worst of the group, but the system made up for it with more trades.
Equity Line and Drawdown Chart
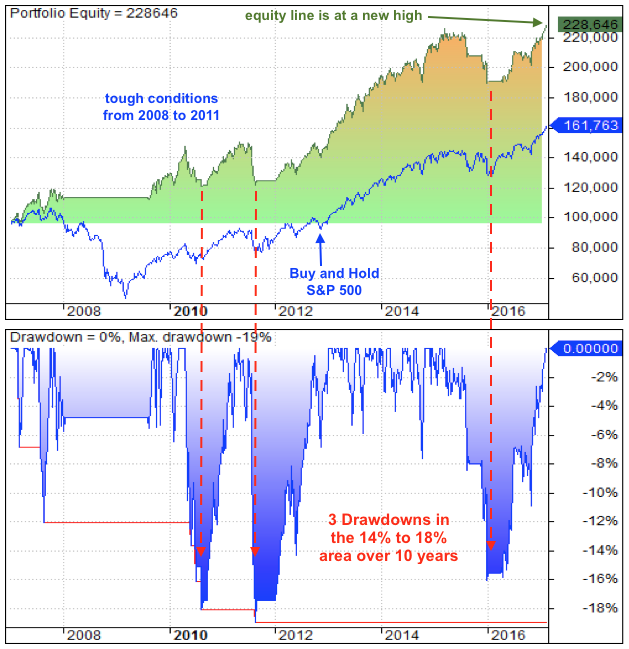
The charts below show performance for the trend-momentum system using the Fast Stochastic (52,1). The equity line reflects the tough market conditions from 2008 until 2011, the big bull run from 2012 to 2014, the deep drawdown of 2015 and the bull run in 2016. The key to momentum systems is to make more on the way up than is lost on the way down. We cannot get out at the exact top and this is why momentum systems have drawdowns. I used Amibroker software and Premium Data from Norgate for testing.
Conclusions
It is hard to beat a basic timing system for the S&P 500 SPDR. Buy SPY when the weekly PPO(10,40,1) turns positive and sell when the weekly PPO turns negative. This basic timing system also works well when using the nine sector SPDRs, which are based on stocks in the S&P 500. Thus, timing with the PPO(10,40,1) works well for the S&P 500 and its sectors. The annual returns improve when we expand the list of ETFs, but this is at the expense of higher drawdowns. The Compound Annual Return went from 7.32% to 8.52% (+1.2), but the Maximum Drawdown went from 14% to 18% (+4%). I am not sure if the added return was worth the 3 times the added risk.
I was not happy with the momentum-rotation using Rate-of-Change and the PPO for the expanded list of ETFs so I ventured out to other momentum indicators. RSI (26) and Fast Stochastic (52,1) worked quite well on the weekly timeframe so I think these systems merit further exploration in the future. I like the idea of RSI because it is a normalized indicator. I like the idea behind the Fast Stochastic because it reflects "chart" strength.
******************************************************
Thanks for tuning in and have a good day!
--Arthur Hill CMT
Plan your Trade and Trade your Plan
******************************************************
Other Articles in the SystemTrader Series:
- Introduction to Key Performance Metrics - Quantifying the Golden Cross for the S&P 500
- Golden Cross and 5 Major Indexes - EMAs versus SMAs - Do Short Positions Add Value?
- Setting up Momentum Scans, Creating ChartLists and Exporting Lists. - Differences in Major Indexes - Do Trend Filters Work?
- MACD Crosses - Rules to Reduce Drawdowns and Increase Gains - Testing PPO Strategy
- Follow me on Twitter @arthurhill - Keep up with my 140 character commentaries.


