----- Video Link ----- Art's Charts ChartList (updated 25-Feb) -----
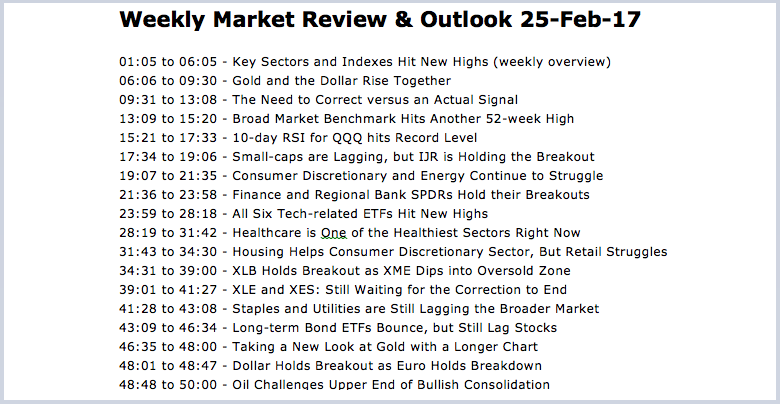
Key Sectors and Indexes Hit New Highs
The stock marked notched more new highs this week as the major index ETFs hit new highs during the week (SPY, DIA, IWM, IJR, MDY, QQQ). February is shaping up to be one heck of a month with SPY and QQQ up over 4% so far. The Russell 2000 iShares (IWM) and S&P SmallCap iShares (IJR) are lagging with gains around 2.5%. We can argue about overbought conditions and the need for a correction, but there is no argument when it comes to the trend. Call it secular, long-term or whatever, the big trend is clearly up when the major index ETFs are hitting 52-week highs.
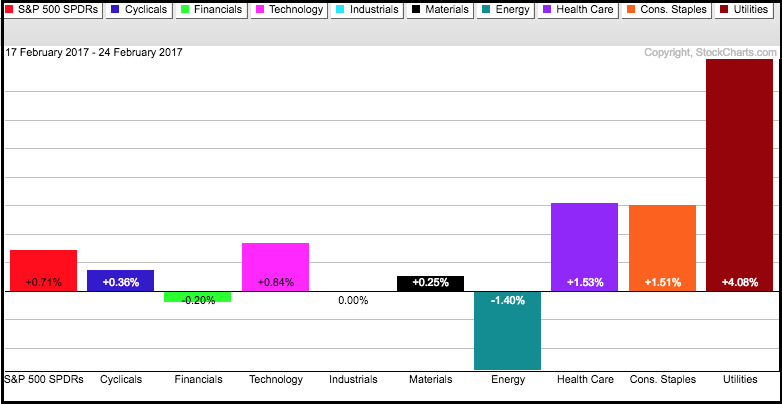
Five of the nine sector SPDRs hit new highs this week and these five sectors account for 65% of the S&P 500 (XLF, XLI, XLK, XLP, XLY). We also saw new highs in the equal-weight industrials, finance and technology sector ETFs, as well as new highs in the small-cap finance, healthcare and technology sector ETFs. The Utilities SPDR (XLU) was the best performing sector this past week with a 4% surge in just four days. I suspect that utilities surged because the 10-yr T-Yield ($TNX) fell sharply the last four days and is testing its January lows.
Gold and the Dollar Rise Together
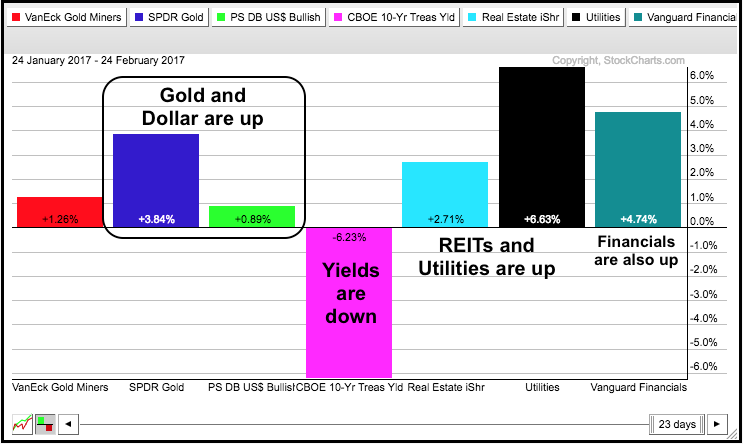
The PerfChart below highlights some interesting dynamics in the markets over the past month. Notice that Gold (blue) and the Dollar (green) are both up. This usually does not occur because the Dollar and gold are negatively correlated for the most part. The 10-yr T-Yield plunged over the past month and this put a bid into bullion. Gold and the 10-yr yield are also negatively correlated. The plunge in the 10-yr Yield helped REITs (light blue) and utilities (black). Financials (teal) were also up over the past month, but I am concerned that further declines in the Treasury Yields could weigh on this group.
The Need to Correct versus an Actual Signal
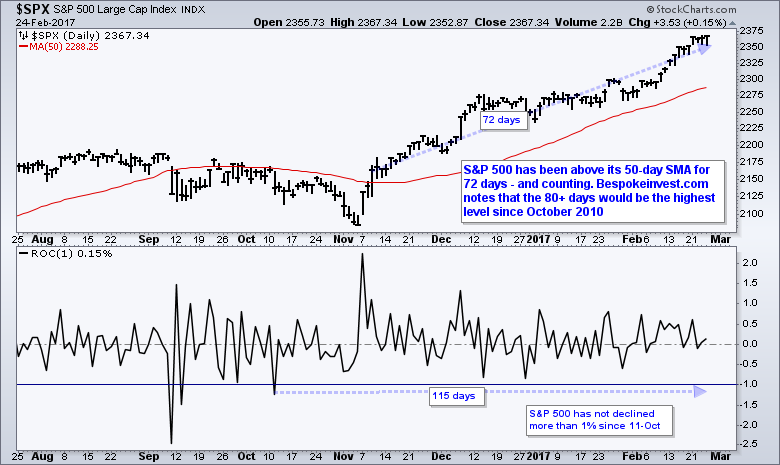
There is certainly a lot of chatter regarding the "need" to correct. We have also seen a parade of overbought indicators over the last few weeks. For example, the Dow had its longest streak of record closes since 1987. 10-day RSI for QQQ reached its highest level ever. The S&P 500 has been above its 50-day SMA for 71 days now and counting. It has also been 115 days since the last 1+ percent decline. These statistics are interesting and do indeed suggest that the market is ripe for a correction, but they do not help much with timing because the market can remain overbought. Actually selling pressure is needed to push the market lower and start a correction.
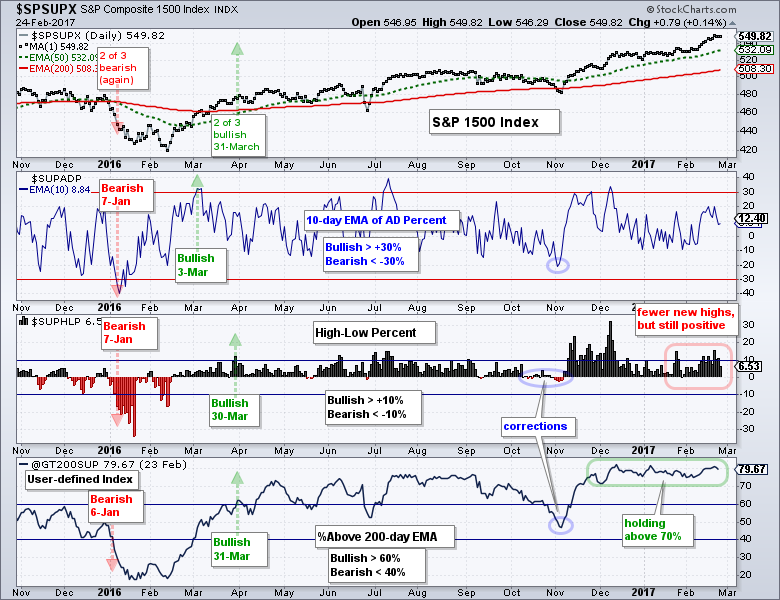
 As noted last week, there are some concerns mounting within the stock market and in the financial markets. First, new highs are not as strong as they were in November-December. Mid-caps and large-caps are doing fine, but small-caps are lagging when it comes to new highs. Second, the plunge in the 10-yr Yield and surge in bonds shows money moving into safety. Third, gold and the Dollar are up together and this is not normal. Fourth, the major index ETFs are quite extended since November and over the last four weeks. I am watching two breadth indicators for signs that a correction may be beginning.
The chart below shows the breadth indicators for the S&P 1500. There are links under this chart explaining the indicators in detail and how to create a user-defined index (@GT200SUP). There are fewer new highs, but new highs still outnumber new lows so this indicator is net positive. A dip into negative territory would show an uptick in selling pressure and could start the corrective process. The percentage of S&P 1500 stocks above the 200-day EMA moved above 70% in late November and has remained above 70%. A move below 70% would signal a modest downturn and this could mark the start of a corrective period.
 Related Links: How to create a user-defined index (@GT200SUP).
Understanding the AD Percent Indicators, the High Low Indicators and %Above 200-day EMA Indicators
Broad Market Benchmark Hits Another 52-week High
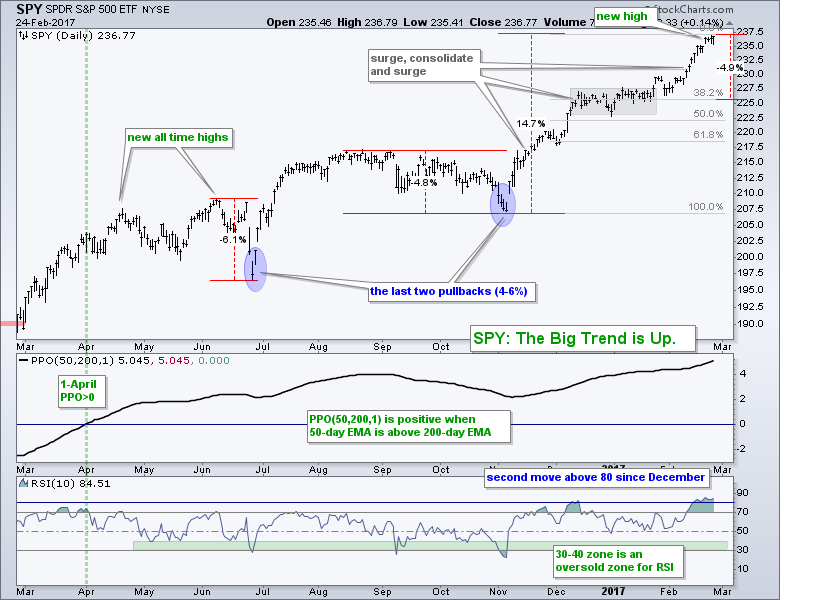
The S&P 500 SPDR (SPY) hit yet another new high this past week and has been in a long-term uptrend since April 1st, which is when the PPO(10,40,1) turned positive. This key stock-market benchmark, however, is clearly extended after a ~14 percent advance since early November and a ~4% advance in February. Timing a pullback within a strong uptrend is difficult because the uptrend is the dominant force at work. Let's just say the market (SPY) is ripe for a pullback or consolidation. A typical 5% decline would extend to the 226 area and retrace around 38.2% of the November-February advance. This would also put SPY back near the upper end of the prior consolidation (gray area).
10-day RSI for QQQ hits Record Level
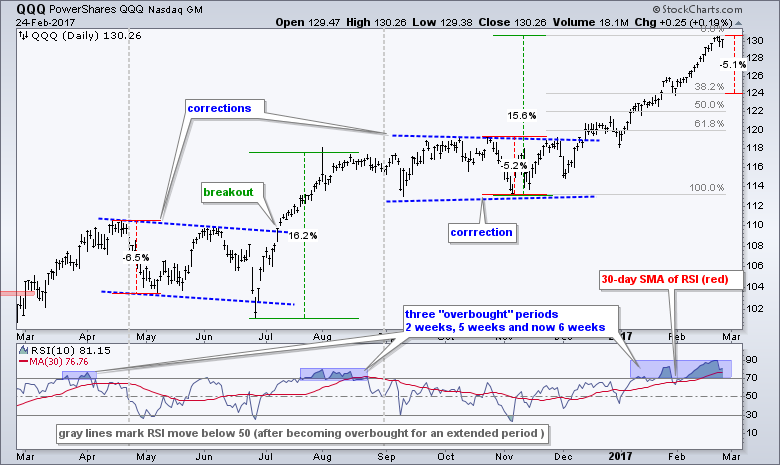
The Nasdaq 100 ETF (QQQ) hit yet another overbought milestone as 10-day RSI exceeded 90 for the first time in its history (at least as far as I can tell). Note that RSI has been near 70 or well above 70 for six weeks now and this also marks one of the longest overbought stints. The 30-period SMA of RSI(10) exceeded 75 and this is the highest level since late February 2012. A garden variety 5% pullback in QQQ would extend to the 124 area and this level also marks a 38.2% retracement of the November-February advance.
Small-caps are Lagging, but IJR is Holding the Breakout
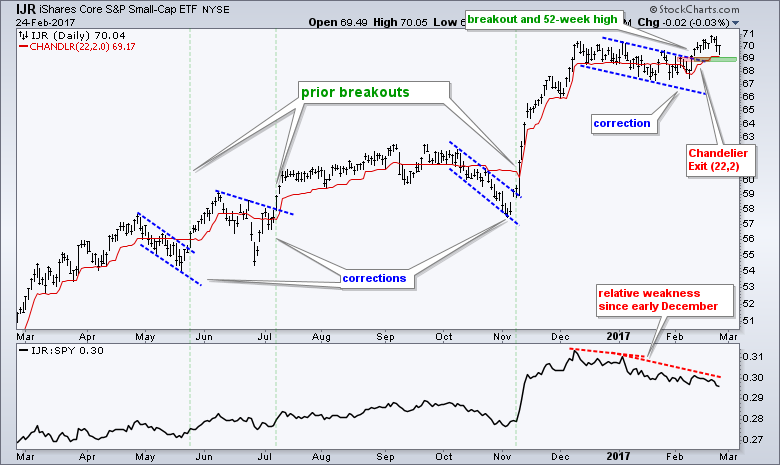
The S&P SmallCap iShares (IJR) broke out on February 9-10 and this breakout is still holding, but small-caps are still struggling as a group. The breakout zone around 69 is the first area to watch for a failure. A close below 69 would negate the breakout and trigger the Chandelier Exit. I am be concerned because IJR could not outperform SPY even with the breakout and the price relative (IJR:SPY ratio) remained in a downtrend. Small-caps have higher betas and more volatility than large-caps. They should outperform after a break out and this relative weakness could be a warning sign. Despite this concern, I will not call the breakout a failure until it actually fails.
Consumer Discretionary and Energy Continue to Struggle
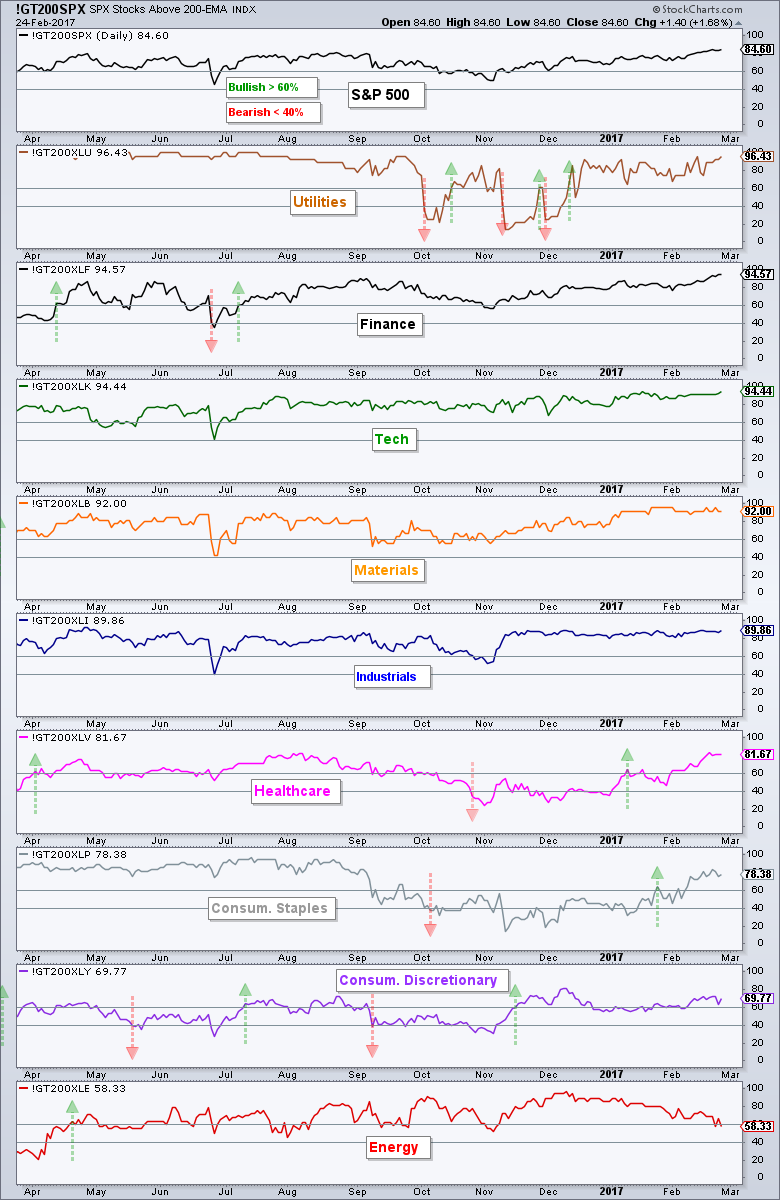
The chart below shows the %Above 200-day EMA for the S&P 500 and the nine sectors. The sectors are sorted by this indicator with the strongest at the top and the least-strong at the bottom. I am saying least strong because all are above 50%. Six are above 80%. The consumer discretionary and energy sectors are the least-strong of the nine.
Finance and Regional Bank SPDRs Hold their Breakouts
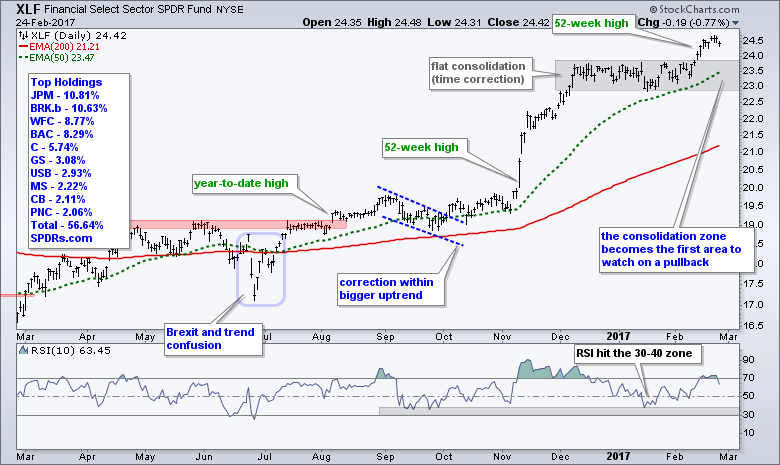
The Finance SPDR (XLF) gets top marks this week because it broke out recently and held above this breakout. The breakout zone becomes the first area to watch on a pullback. The rising 50-day EMA is also in this zone, but I would not call this support. Instead, I would view a move below the 50-day EMA as a pullback and consider it an opportunity to partake in the bigger uptrend.
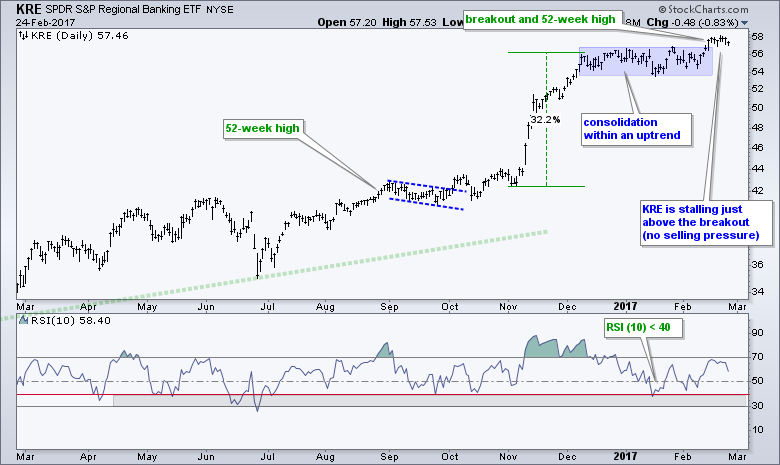
Within the finance sector, the Insurance SPDR (KIE) and the Mortgage REIT ETF (REM) hit new highs again this week and they are leading the group. These ETF charts can be seen in the Art's Charts ChartList. The Regional Bank SPDR (KRE) is a little more subdued, but the ETF is holding just above its breakout zone and remains bullish. I am a bit concerned with this week's decline in long-term Treasury yields. Further declines could weigh on banking stocks.
All Six Tech-related ETFs Hit New Highs
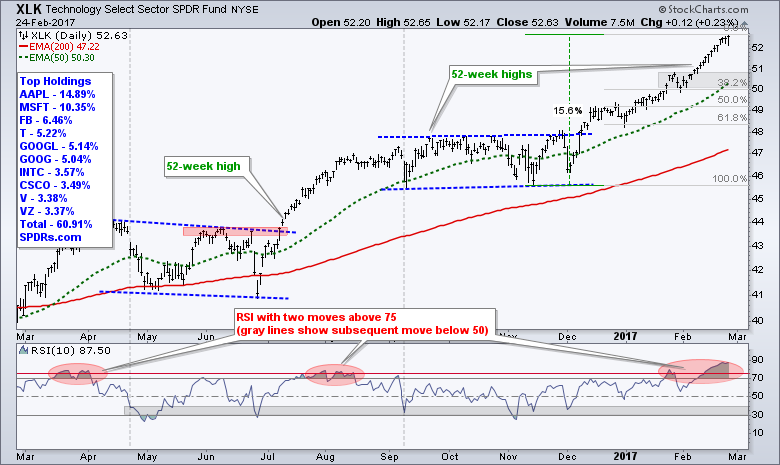
The Technology SPDR (XLK) looks just like QQQ: very strong and very overbought. Prior to Thursday's small decline, XLK was up thirteen straight days. This move pushed RSI above 85 and extended the overbought conditions. As noted last week, the two moves above 75 created an extended overbought situation for RSI. A subsequent decline below 50 would show a negative momentum shift that could signal the start of a correction. On the XLK chart, the 50-51 area is the first zone to watch on a pullback.
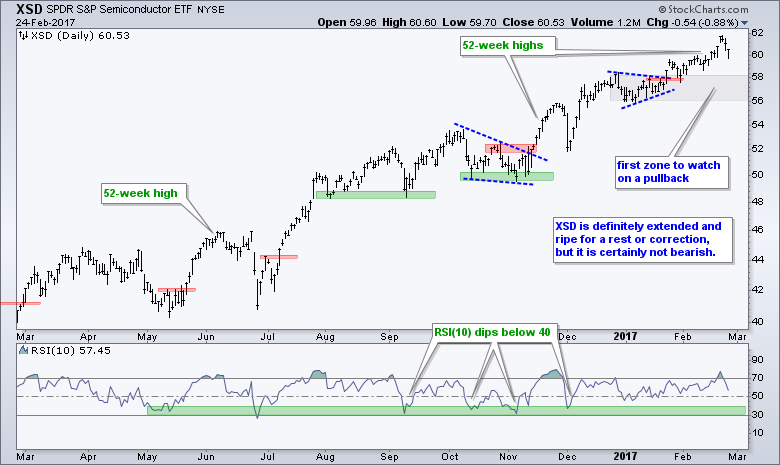
Within the technology sector, the Internet ETF (FDN), Networking iShares (IGN), Cloud Computing ETF (SKYY), Cyber Security ETF (HACK) and Semiconductor SPDR (XSD) all recorded fresh 52-week high this past week. Despite clear uptrends, all five are up sharply year-to-date and ripe for a rest. The chart below shows XSD with a slow and steady advance since early December. The triangle area becomes the first zone to watch on a pullback. The other four charts are available in the Arts Charts ChartList.
Healthcare is One of the Healthiest Sectors Right Now
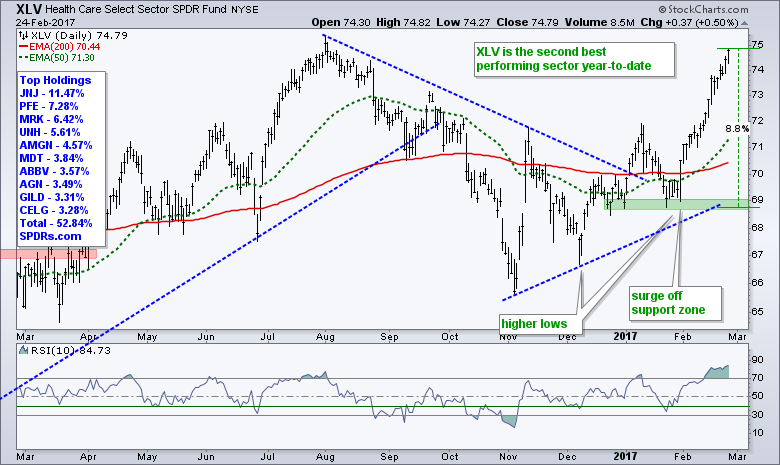
The HealthCare SPDR (XLV) surged off its support zone on January 31st and continued higher the last three weeks. This sector is on fire and is the second best performing sector in 2017 (XLK is tops). The long-term trend is clearly up with this surge and the golden EMA cross two weeks ago. However, with a ~8 percent advance in four weeks, the ETF is quite extended for the short-term and ripe for a rest. Hmmm.... seems we have heard this before.
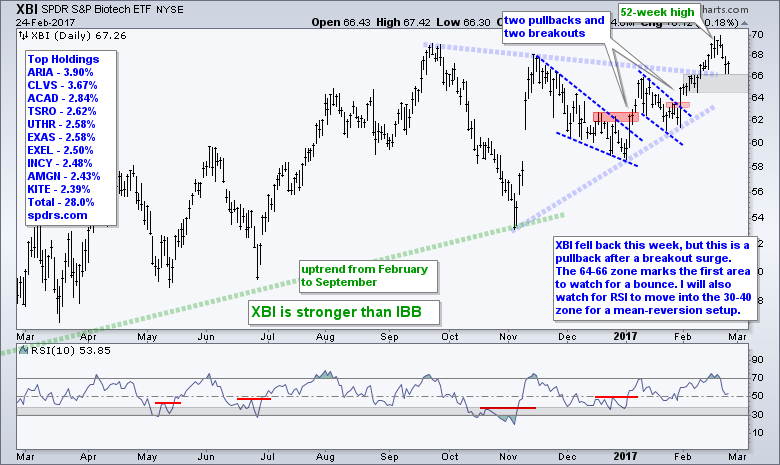
Within the healthcare sector, the Medical Devices ETF (IHI) and HealthCare Providers ETF (IHF) hit 52-week highs this past week. The Biotech SPDR (XBI) also hit a 52-week high, but the Biotech iShares (IBB) remains short of a new high. Three out of four ain't bad. The chart below shows XBI with a little pullback this week. The triangle breakout and early February stall mark the first reversal zone to watch (64-66). Chartists can also watch for RSI(10) to dip into the 30-40 zone to signal that the ETF is starting to get short-term oversold, which could set up a mean-reversion trade.
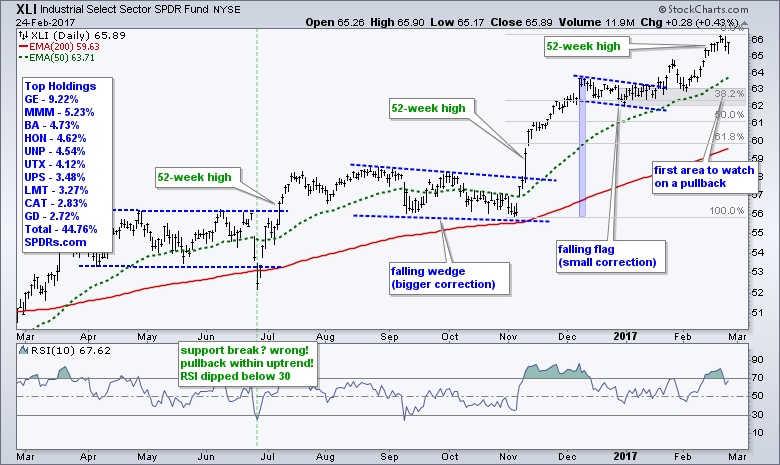
The Industrials SPDR (XLI) hit a 52-week high early in the week and then fell back. The ETF advanced over 15% from early November to mid February and is certainly entitled to a corrective period. I am not that keen on support and resistance for ETFs because they have dozens of moving parts (stocks) and the weightings change on a regular basis. Having said that, I think the 62-63 area is the first zone to watch on a pullback. This marks a 38.2% retracement and the January lows.
Retail Struggles within Consumer Discretionary Sector
The Consumer Discretionary SPDR (XLY) also hit a fresh 52-week high this week and remains in a long-term uptrend. Nevertheless, it too is quite extended after a 14% run since early November. The gray zone around 83-84 marks the first area to watch on a pullback.
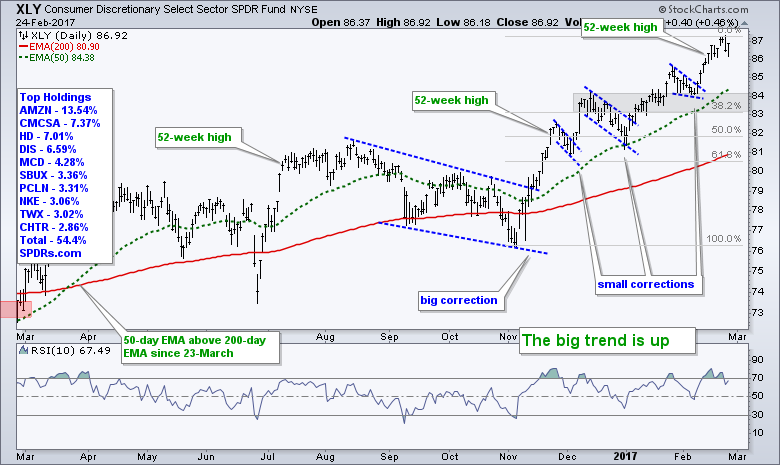
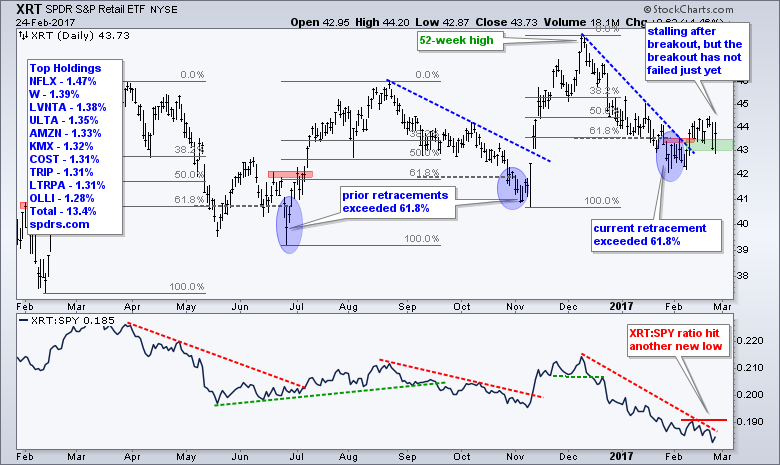
The consumer discretionary sector continues to be divided. The large-caps (AMZN, CMCSA, HD, PCLN, NKE and CHRT) are up big year-to-date and pushing XLY to new highs. Homebuilders are also doing ok with the Home Construction iShares (ITB) hitting a 52-week high this week. The trouble starts when we look at retail stocks, which are represented by the Retail SPDR (XRT). Note that this ETF contains 100 stocks and it is equally weighted for the most part. XRT broke out two weeks ago, but this breakout is under threat again as the ETF fell back below into the breakout zone. This group has been lagging since mid December and the failure to hold the breakout would be quite negative. A close below 43 would negate this breakout. The indicator window shows the price relative (XRT:SPY ratio) hitting a fresh 52-week low this week.
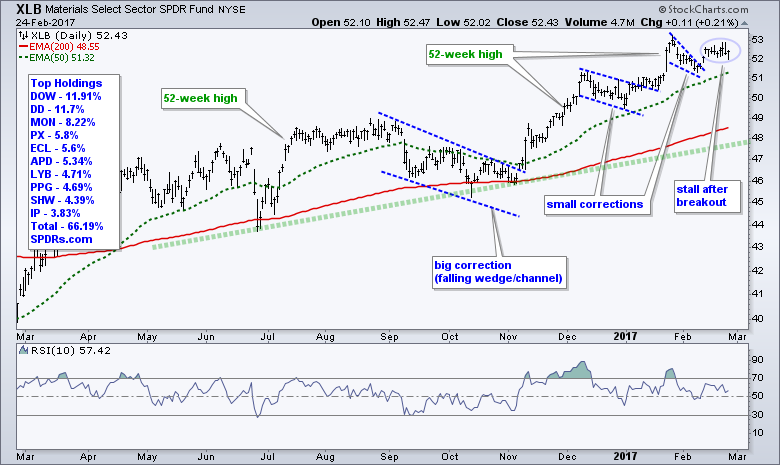
The Materials SPDR (XLB) broke out of a small wedge pattern on 10-Feb and then stalled. Technically, the breakout is holding, but I would watch this one closely because XLB did not keep pace with the broader market the last two weeks. SPY hit a new high and XLB remains below its late January high. Despite some relative weakness, I would not jump the gun and call this breakout a failure until it actually fails.
XLB Holds Breakout as XME Dips into Oversold Zone
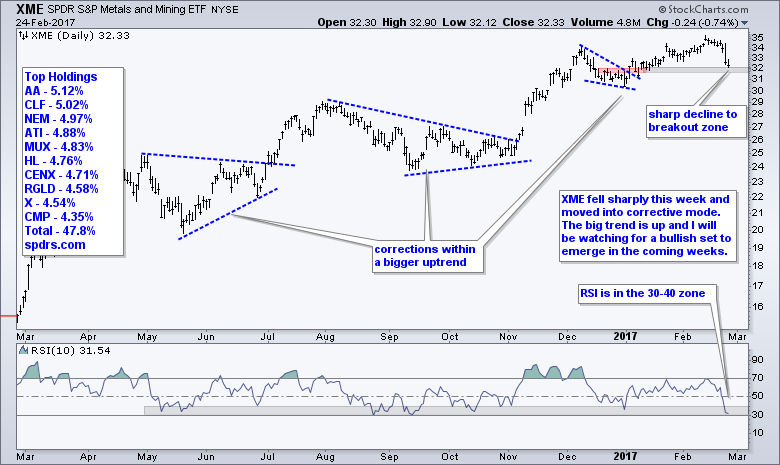
Within the materials sector, the Metals & Mining SPDR (XME) and the Copper Miners ETF (COPX) are starting to correct. Both are in long-term uptrends because their recorded 52-week highs in February. A corrective process is underway because they are more than 5% below these 52-week high now. Instead of support, I will be watching RSI(10) to signal short-term oversold conditions with a dip into the 30-40 zone. XME is already at this juncture because RSI(10) moved into the 30-40 zone and the ETF the near the breakout zone.
XLE and XES: Still Waiting for the Correction to End
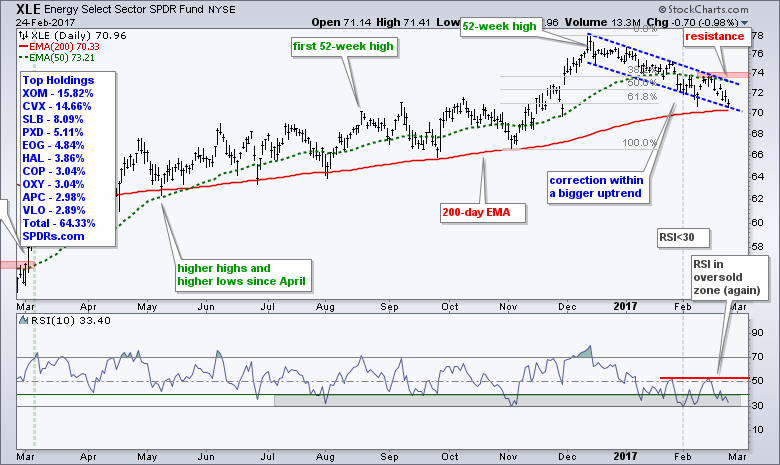
The Energy SPDR (XLE) hit a 52-week high in early December and then corrected with a falling channel the last ten weeks. The early February high marks resistance at 74 and a breakout here is needed to reverse the slide. The ETF has now retraced around 61.8% of the prior advance and is trading just above the rising 200-day EMA. RSI is also floundering in the oversold zone (30-40). This is still a good spot for a reversal so I will keep watching oil and the sector closely.
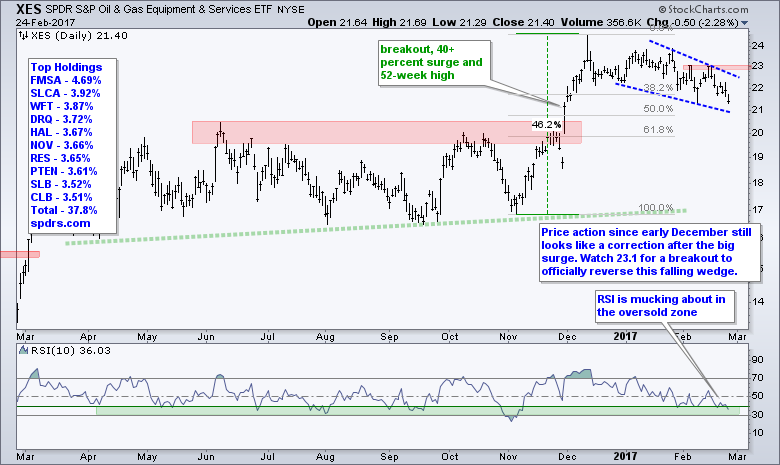
The Oil & Gas Equip & Services SPDR (XES) also hit a 52-week high in December, stalled and then pulled back. The falling wedge defines this correction with resistance marked at 23.1. RSI is also in the oversold zone and, once again, I will be watching this ETF closely next week.
Staples and Utilities are Still Lagging the Broader Market
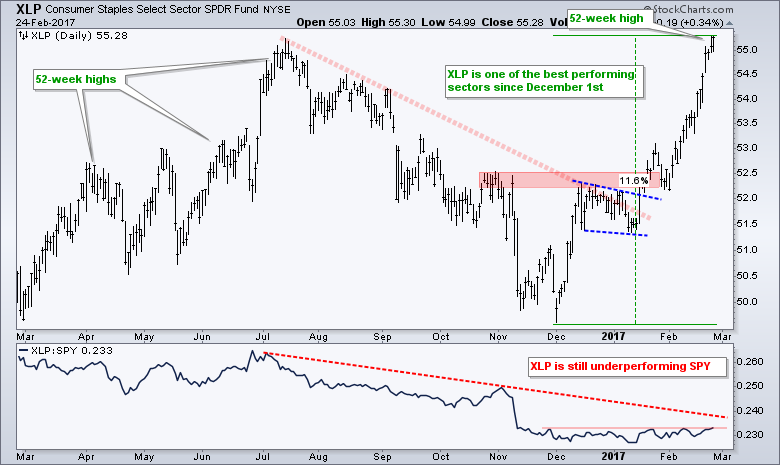
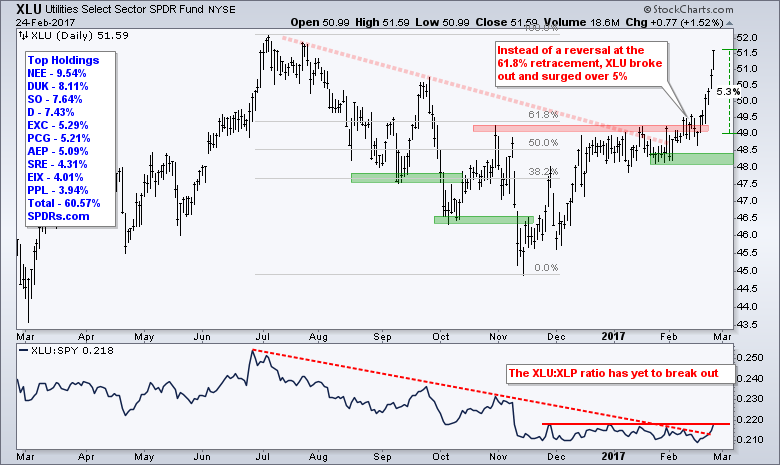
The Consumer Staples SPDR (XLP) and the Utilities SPDR (XLU) have been on a tear in February, but they are still lagging the S&P 500 SPDR (SPY) over the last few months. XLP broke out in mid January and surged over 10% in five weeks. The Utilities SPDR (XLU) broke out over the last two weeks and surged around 4% the last six trading days. That is a huge move for utility stocks. I missed these breakouts because I was positioning for a bull market and focusing on the offensive sectors. I also thought long-term Treasury yields would rise, but they are poised to break consolidation support. The price relatives shown at the bottom of each chart offer the only consolation. The XLP:SPY ratio and the XLU:SPY ratio have been trending down since July and flat since December. We have yet to see any sustained outperformance from utilities and staples.
Long-term Bond ETFs Bounce, but Still Lag Stocks
The 7-10 YR T-Bond ETF (IEF) and 20+ YR T-Bond ETF (TLT) remain in consolidation patterns. IEF is in a downtrend since summer and an uptrend since mid December. A rising wedge defines this uptrend with support at 104.3. A break below 104.3 would reverse this rise and signal a continuation of the bigger downtrend.
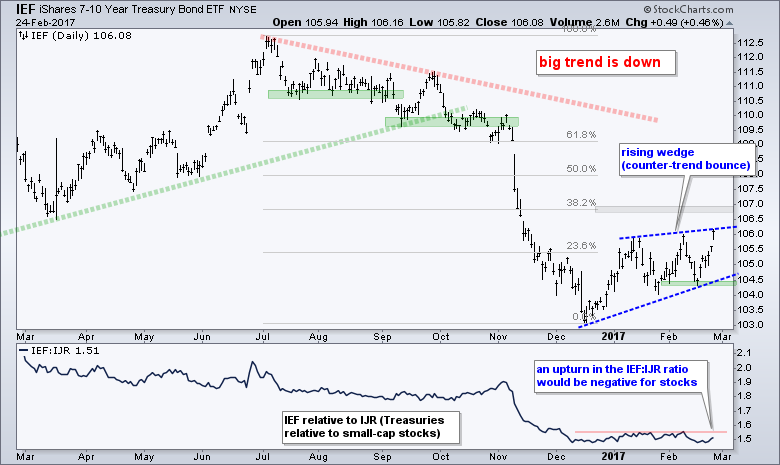
The indicator window shows the IEF:IJR ratio flattening out over the last two months. This ratio rises when IEF outperforms IJR and a break above the red line would signal relative strength in IEF (Treasury bonds versus small-cap stocks). This could be negative for stocks and signal the start of the elusive correction.
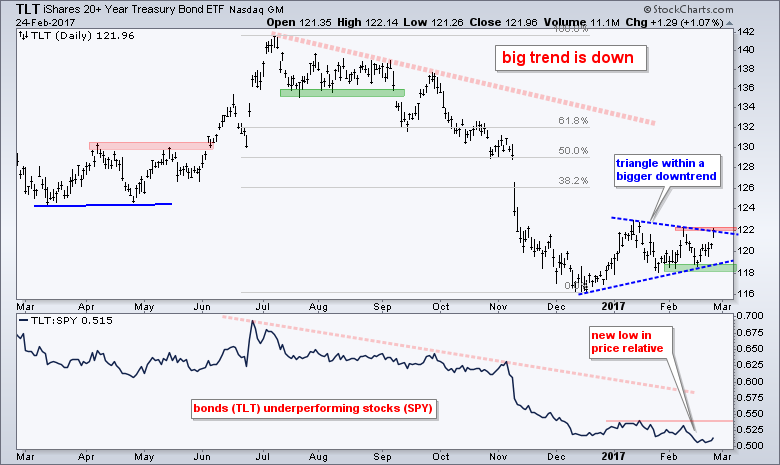
TLT remains within a triangle consolidation and I view this as a consolidation within a bigger downtrend. However, I have seen upside breakouts in these patterns before and chartists should always be prepared for the unexpected. An upside breakout at 122.3 would be bullish and argue for further strength, perhaps to the 126-130 area. Such a move would mean money is moving into bonds and this could be negative for stocks and banks, and positive for gold.
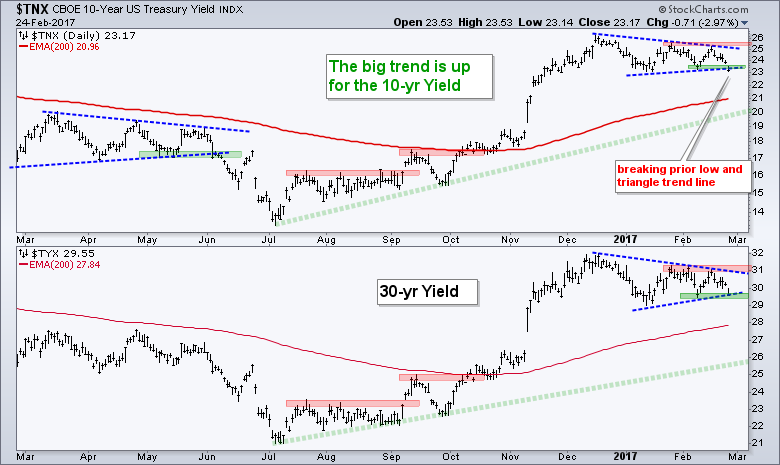
The 10-yr T-Yield ($TNX) and the 30-yr T-Yield ($TYX) fell and are testing their early February lows. I normally view a triangle after a sharp advance as a bullish continuation pattern, but sometimes the break goes the other way.
Taking a New Look at Gold with a Longer Chart
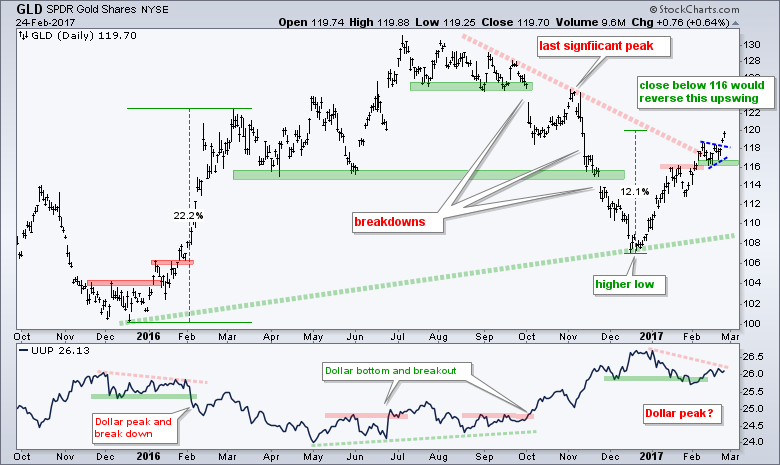
The Gold SPDR (GLD) continues to serve me crow pie so I am going back to the drawing board on this chart. First, I extended the chart to October 2015 for more perspective. Notice that GLD surged over 20% from mid December to early March. This surge occurred as the Dollar peaked and broke down. The subsequent decline from 130 to 108 was quite drastic, but GLD managed to hold above the December low. A higher low could mean a long-term uptrend. GLD is currently up over 10% since mid December and recently broke out of a pennant formation. This breakout is bullish and I am leaving support at 116 for now.
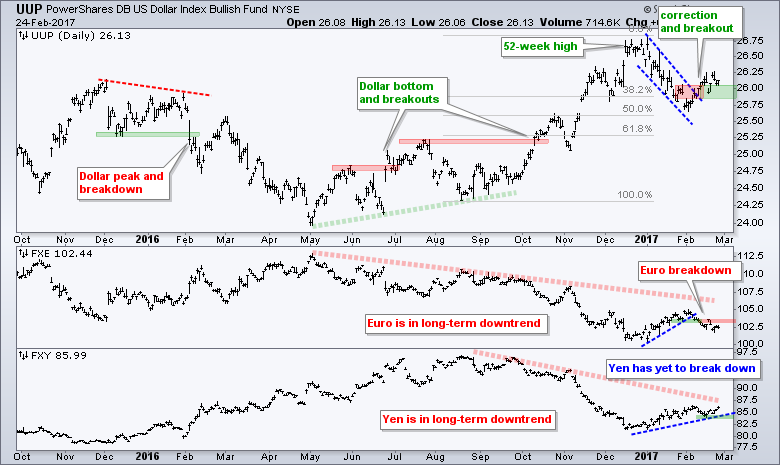
Dollar Holds Breakout as Euro Holds Breakdown
The US Dollar ETF (UUP) bottomed from May to August and broke out with a big move in October. After hitting a 52-week high in December, UUP pulled back with a 50% retracement into early February. It looks like this correction ended with the channel breakout two weeks ago. Also notice that the Euro ETF (FXE) broke down. I would be bullish on the Dollar as long as its holds above 25.80 (green zone). A break below this level would suggest a failed breakout and call for a reassessment.
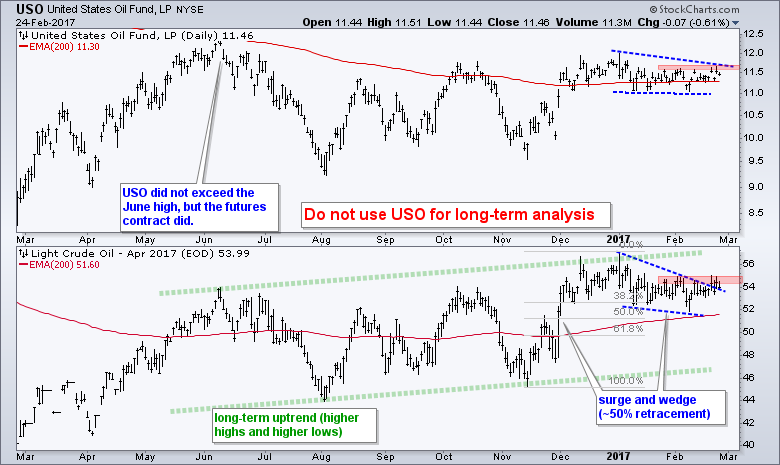
Oil Challenges Upper End of Bullish Consolidation
There is no change in my oil analysis, which is based on the April Crude Futures Contract (^CLJ17). The green trend lines mark higher highs and higher lows to define the long-term uptrend, which is at least nine months. Oil surged to the 56 area in mid December and then corrected with a falling wedge. It looked as if oil would break the falling wedge with a surge this week, but stalled around 54-55. Look for a move above 55 to trigger a clean breakout. Such a move could also trigger breakouts in XLE, XES and XOP.
 ******************************************************
Spotting Pullbacks and Upturns within an Uptrend using RSI and MACD Histogram.
Difference between EMA and SMA - Using %Above 200-day EMA for Breadth Analysis.
Backtesting Different Moving Average Pairs with SPY, QQQ and IWM.
ETF Master ChartPack - 300+ ETFs organized in a Master ChartList and in individual groups.
Follow me on Twitter @arthurhill - Keep up with my 140 character commentaries.
****************************************
Thanks for tuning in and have a good day!
--Arthur Hill CMT
Plan your Trade and Trade your Plan
*****************************************


