----- Webinar Video ----- Art's Charts ChartList -----
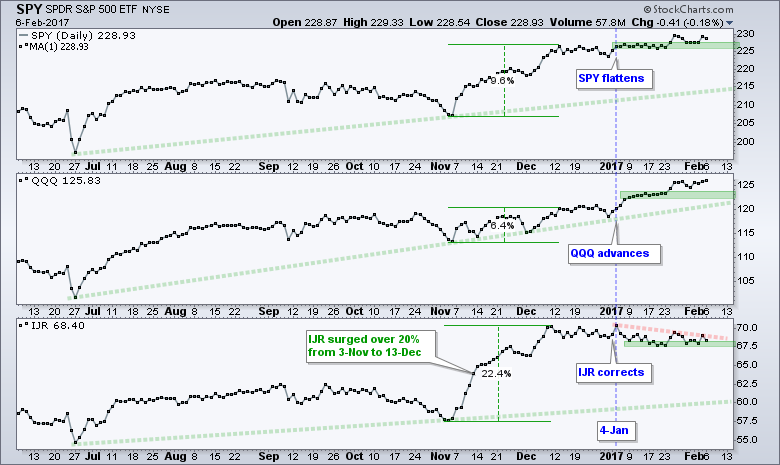
Today I will start out with simple close-only charts for SPY, QQQ and IJR. Close-only charts filter out the intraday noise and gaps that may occur between sessions. These charts show us just how dull the market has been since early January (blue vertical line). SPY traded flat for 13 days and then edged above 228. QQQ worked its way higher with a steady advance. IJR corrected with a small decline (~4%). The short-term (a few weeks) may seem mixed, but the long-term trends are clearly up. On a closing basis, QQQ recorded a new high on Monday (yesterday), SPY recorded a new high on January 25th (8 days ago) and IJR recorded a new high on January 4th (22 days ago). The green zones mark closing level support zones that chartists can watch for the first signs that a correction may be starting (SPY-225, QQQ-122 and IJR-67). Selling pressure has been extremely limited this year and breaks below these levels would show an uptick in selling pressure.
QQQ Continues to Lead
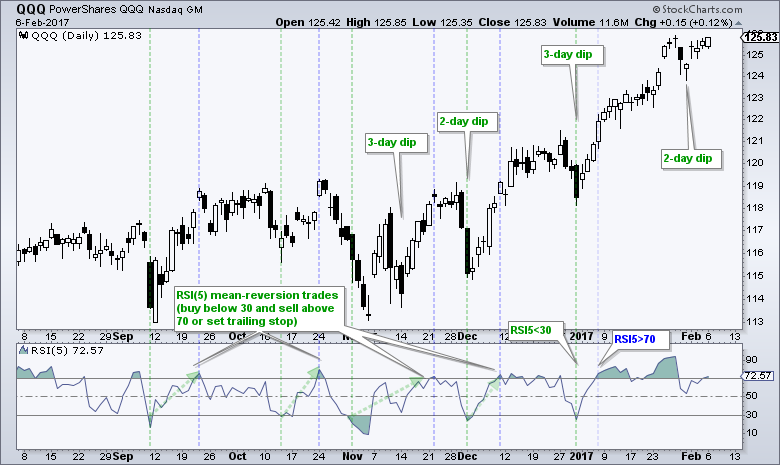
Now let's add some noise by looking at the individual candlestick charts over the last six months. Short-term, QQQ is in no-man's land. The trend is clearly up, but the ETF looks extended and I am waiting for the next bullish setup. This could be a falling flag and/or an RSI dip below 30. Notice that the dips have been limited to 2-3 days since the election. The first three dips were quite sharp, but last week's dip was rather shallow. The lesson here: dips within a bigger uptrend are opportunities, not threats.
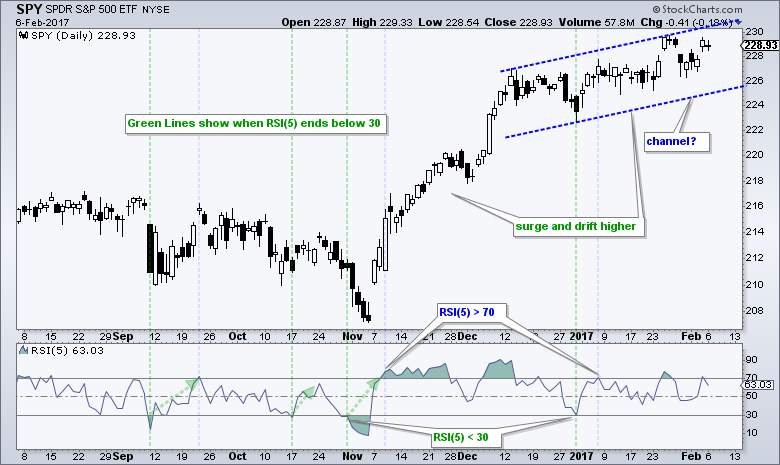
The S&P 500 SPDR (SPY) continues to drift higher. The ETF surged around 9% from 4-Nov to 13-Dec and then embarked on a choppy advance. Even though the advance slowed the last two months, buying pressure is still outpacing selling pressure. Like QQQ, SPY is in somewhat of a no-man's land because the big trend is up and I am waiting for a short-term pullback.
Even though SPY and QQQ seem extended and ripe for a corrective period, the S&P SmallCap iShares (IJR) is currently within a correction. It is not overextended and it could even be ripe for an upside breakout. IJR surged over 20% to the 9-Dec high and then corrected with a ~4% pullback the last seven weeks. A breakout at 69.2 would signal an end to this correction.
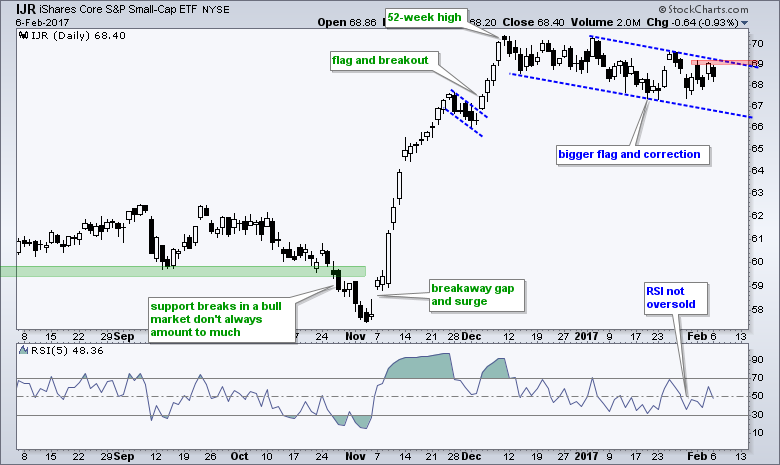
Small-cap Breadth Signal Triggers
Even though RSI(5) did not become oversold for IJR during this pullback, the Small-Cap %Above 20-day EMA (!GT20SML) did become oversold and turned up. The chart below shows the percentage of stocks above the 20-day EMA for the S&P 500, S&P MidCap 400, S&P Small-Cap 600 and Nasdaq 100. In a bull market environment, such as now, I look for dips below 30% to signal a pullback and subsequent surges above 50% to signal an upturn. The green shaded ovals show the dips below 30% and the green arrows show the subsequent moves above 50%. The indicator is not perfect, but it does offer a mean-reversion alternative to RSI(5).
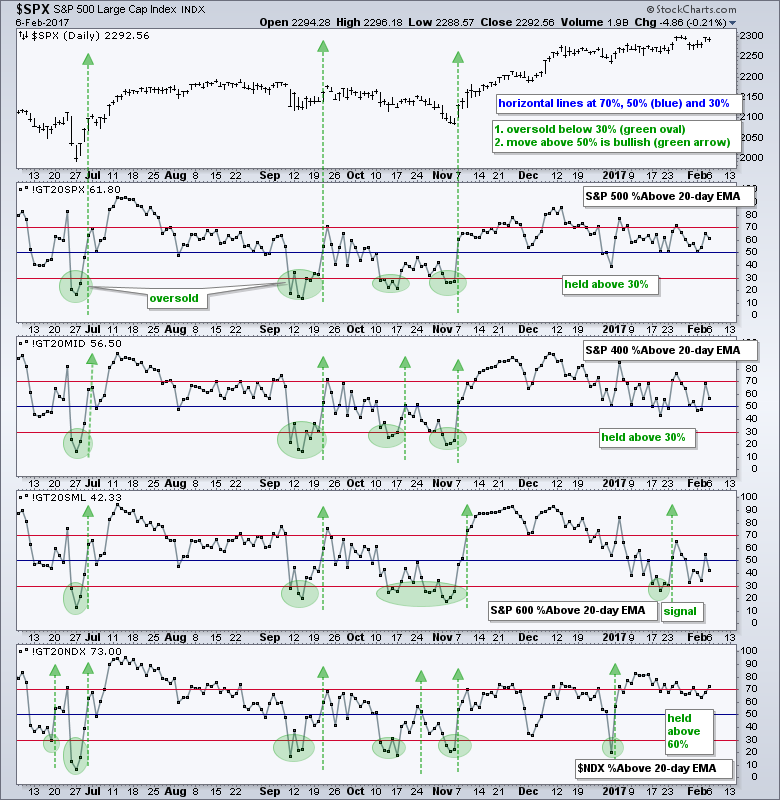
Three things stand out on this chart. First, S&P 500 %Above 20-day EMA (!GT20SPX) and MidCap %Above 20-day EMA (!GT20MID) did not dip below 30% in January and held up the best. Second, Small-Cap %Above 20-day EMA (!GT20SML) dipped below 30% on 19-Jan and surged above 50% on 24-Jan. Thus, IJR is on a short-term bull signal right now. A move back below 30% would negate this signal. Third, Nasdaq 100 %Above 20-day EMA (!GT20NDX) held above 60% the last three weeks. This is testament to underlying strength within the Nasdaq 100.
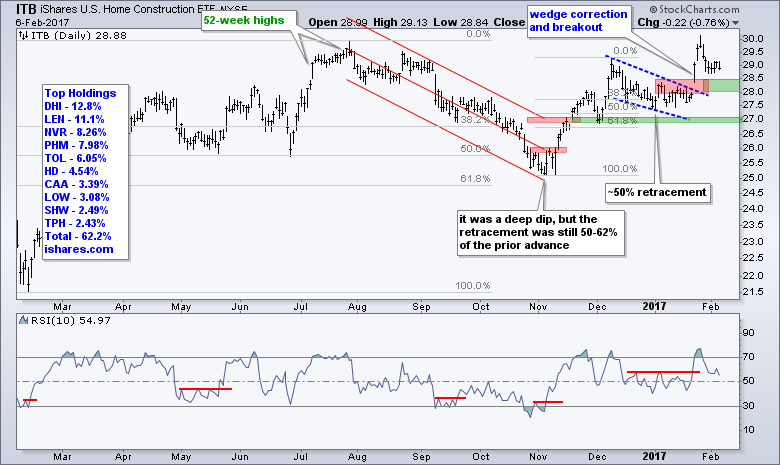
Home Construction Holds Breakout as Retail Lags
The Home Construction iShares (ITB) broke out of a wedge correction in late January and then fell back below 29 last week. The broken resistance zone and gap mark the first support zone to watch on a pullback.
The Retail SPDR (XRT) remains a major drag within the consumer discretionary. Overall, I still view the long-term trend is up because of the higher highs and higher lows over the past year. Notice that XRT rebounded after over-shooting the 61.8% on the last two declines. A break above 44.2 would reverse the seven week decline.

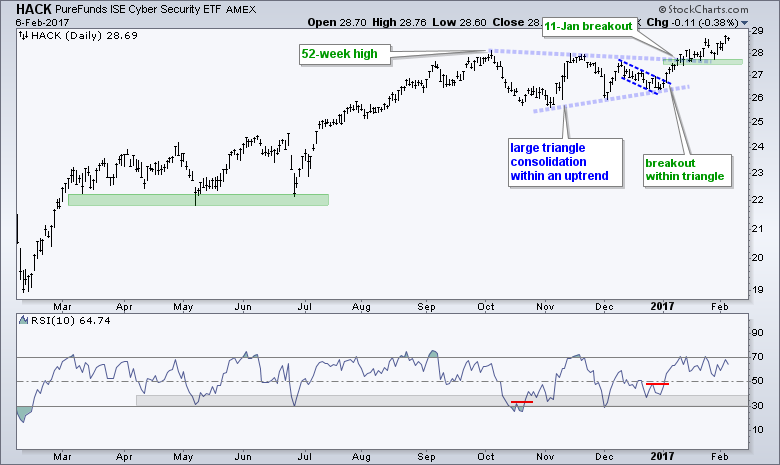
Hacking and Networking Lead Technology
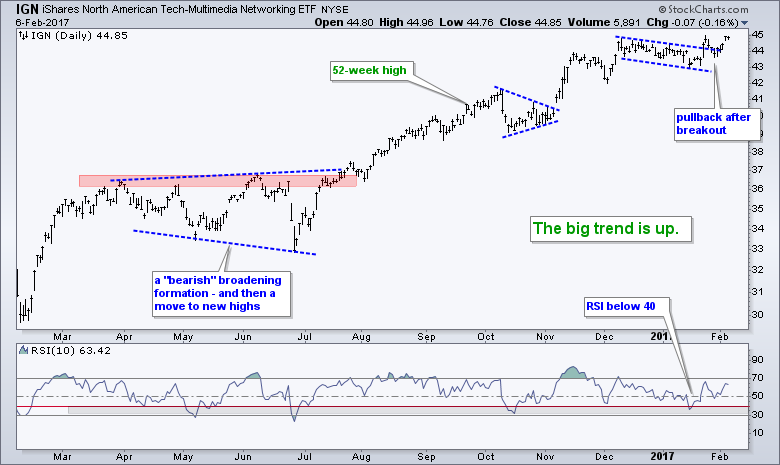
Technology is the strongest of the nine sectors and I am highlighting two tech-related ETFs today. The Cyber Security ETF (HACK) and the Networking iShares (IGN) continue to lead the market with new highs. HACK hit a new high on Friday and IGN recorded a new closing high on Friday. On the price chart, HACK broke out of a triangle on 8-January and worked its way higher after the breakout. IGN broke out of a flag, dipped back below 44 and bounced the last five days. There is nothing weak about this chart.
Bank-related ETFs Remain Stuck in Consolidations
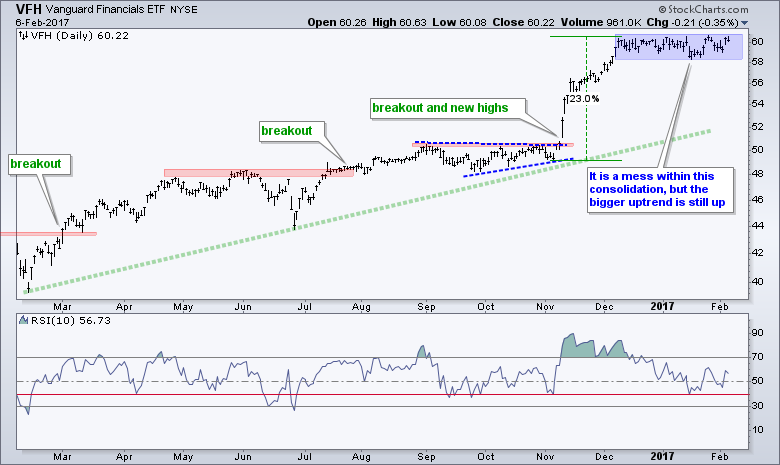
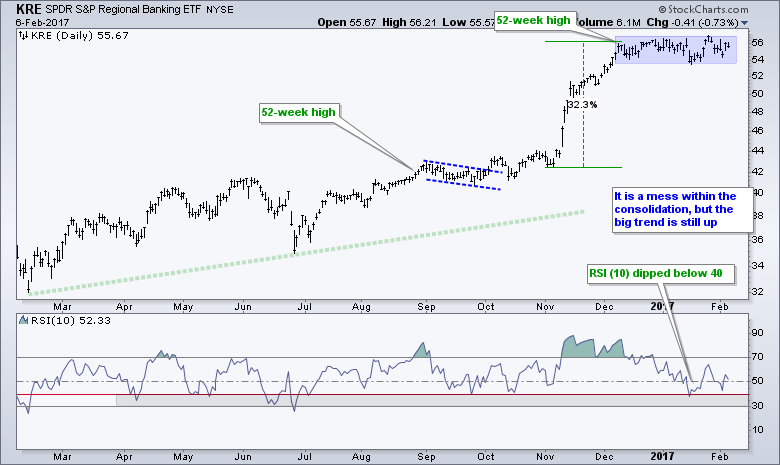
The Vanguard Financials ETF (VFH) and Regional Bank SPDR (KRE) remain stuck in trading ranges. Note that VFH surged over 20% and KRE surged over 30% from early November to early December. Both ETFs have since been consolidating with tight ranges. These consolidations reflect a stalemate between buying pressure and selling pressure. Keep in mind that the bigger trends are up and this favors new highs in the coming months. Playing the consolidation, however, is a different challenge. I expect an upside breakout. Even though a downside break would seem negative, I think this would likely trigger a short-term oversold situation that could lay the groundwork for the next leg higher. I realize this may seem confusing, but the main takeaway is that the long-term trend is up and we should expect more bullish resolutions than bearish resolutions.
Defense ETF Breaks Out of Wedge
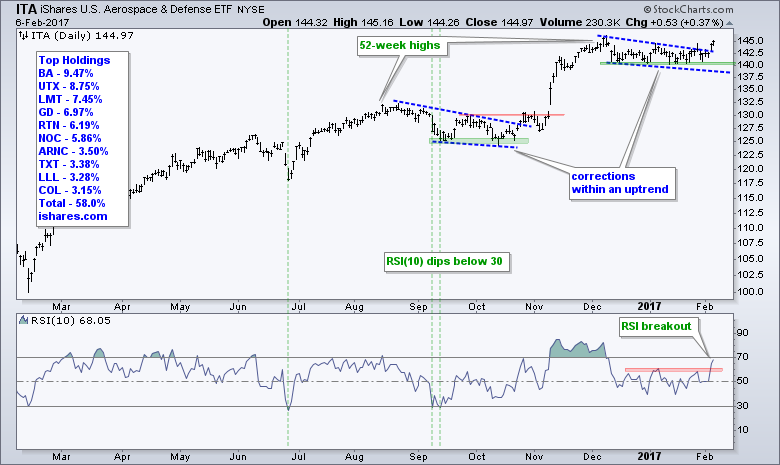
The iShares Aerospace & Defense ETF (ITA) is breaking out of its falling wedge and this is helping the industrials sector. The ETF hit a 52-week high in early December, corrected with this wedge and broke out over the last two days. This breakout signals a continuation of the bigger uptrend and chartists can mark support at 140. The indicator window shows RSI breaking out of its one month range.
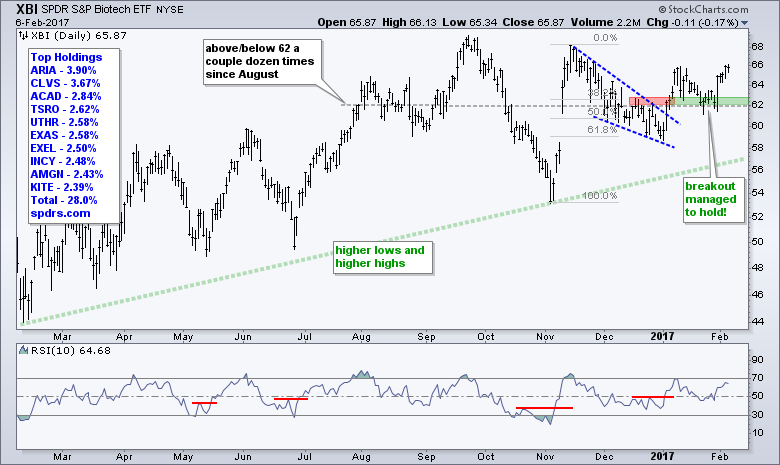
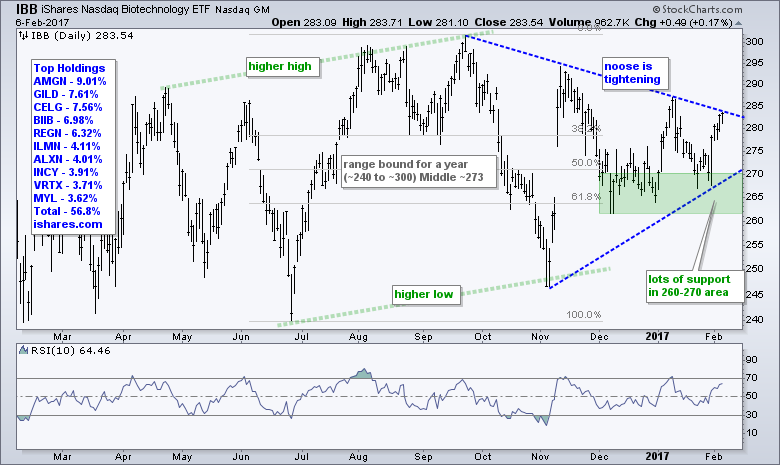
The Noose Tightens on the Biotech ETFs
The Biotech iShares (IBB) and the Biotech SPDR (XBI) are not the best performing industry group ETFs, but they are up year-to-date and showing some upside leadership. XBI is up 11.29% year-to-date and IBB is up +6.84%. The first chart shows XBI, which is more-or-less an equal-weight ETF, holding its early January breakout and surging off the support zone. This chart is bullish unless XBI fails to hold support and closes below 62.
IBB, which is weighted by market cap, found support in the 260-270 area in December-January and surged the last five days. The ETF has gone nowhere for the past year, but I do see a higher high in September and a higher low in early November. The ETF has since formed a narrowing range the last three months and the most recent surge off support argues for an upside breakout (unless, of course, it fails).
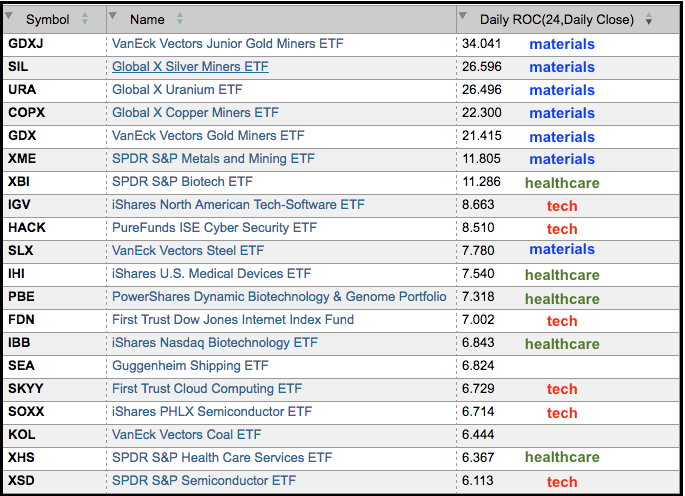
Ranking Industry Group ETF Performance
The table below shows a scan that ranks a ChartList of industry group ETFs by the 24-day Rate-of-Change, which captures the year-to-date gain. Three sectors stand out on this table: materials, healthcare and technology.
The scan code is shown below. First, you must create a ChartList with the ETFs you want in the scan. Second, you must select this ChartList when creating the scan. I selected my group-ETF-stockindustry ChartList, which is favorites list number 34.
[favorites list is 34] // group-ETF-stockindustry
Rank by ROC(24)
Video Food for Thought
Investors pile into commodities. Commodity assets under management have risen to their highest level since 2014. Is this a buy signal or a warning sign? Chad Morganlander of Washington Crossing Advisors and Bill Baruch of iiTrader, discuss with Brian Sullivan.
Dwyer: Recession in sight but not until 2020. Tony Dwyer, Canaccord Genuity chief market strategist, discusses why a correction is coming for the market, and why to buy the dip.
Reforming Dodd-Frank may take longer than expected. CNBC's Steve Liesman reports on potential conflicts that could slow down President Trump's plan to review and reform Dodd-Frank.
******************************************************
Spotting Pullbacks and Upturns within an Uptrend using RSI and MACD Histogram.
Difference between EMA and SMA - Using %Above 200-day EMA for Breadth Analysis.
Backtesting Different Moving Average Pairs with SPY, QQQ and IWM.
ETF Master ChartPack - 300+ ETFs organized in a Master ChartList and in individual groups.
Follow me on Twitter @arthurhill - Keep up with my 140 character commentaries.
****************************************
Thanks for tuning in and have a good day!
--Arthur Hill CMT
Plan your Trade and Trade your Plan
*****************************************


