.... Oil Bounces within Corrective Pattern
.... Measuring the Correlation between Oil and Energy ETF
.... XLE, XES and XOP Correct Along with Oil
.... Focus on Gold for Precious Metals ETFs
.... Watching the Wedge and Fib Retracement in Gold
.... 14 Bullish Stock Charts ....
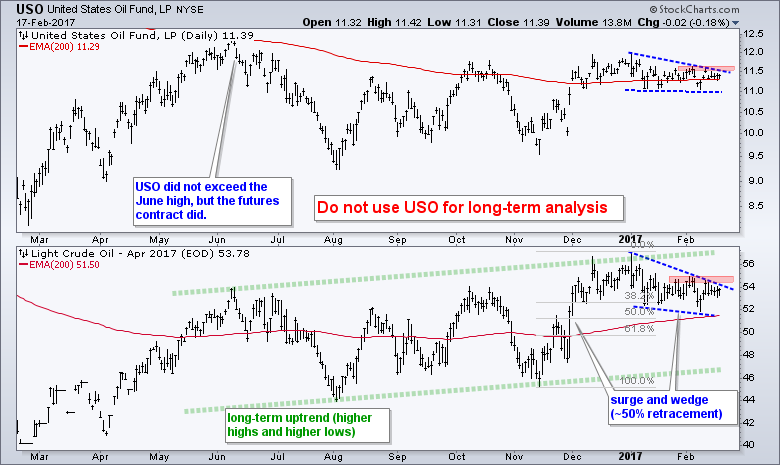
Oil Bounces within Corrective Pattern
I will start off today with oil because Dollar futures are down this morning and oil futures are up over 1%. The chart below shows the USO Oil Fund (USO) in the top window for reference and April Crude Futures (^CLJ16) in the bottom window for analysis. USO can be used for short-term trading, but not for long-term investing or analysis. First and foremost, April crude is in a long-term uptrend with higher highs and higher lows over the past year. Second, crude surged to the mid 50s in December and then pulled back with a falling wedge this year. I view this as a correction within a bigger uptrend and expect a bullish resolution to the pattern. A breakout at 55 would do the trick and signal a continuation of the bigger uptrend.
Measuring the Correlation between Oil and Energy ETFs
Chartists interested in oil-related ETFs and stocks should analyze the chart for oil because of the high positive correlation. The chart below shows weekly closes for Light Crude Continuous Futures ($WTIC) and the Correlation Coefficient for four ETFs. I also added the correlation for Natural Gas Continuous Futures ($NATGAS). The black line is the 13-week Correlation Coefficient and the green line is the 26-week SMA. Correlation Coefficients are not used for timing purposes. They simply reflect the relationship between two symbols. Positive numbers (>0) indicate that the two symbols tend to move in the same direction. A negative correlation means the two symbols move in opposite direction. Correlations fluctuate over time, but there is sometimes a clear relationship at work and we can use this to compliment our chart analysis.
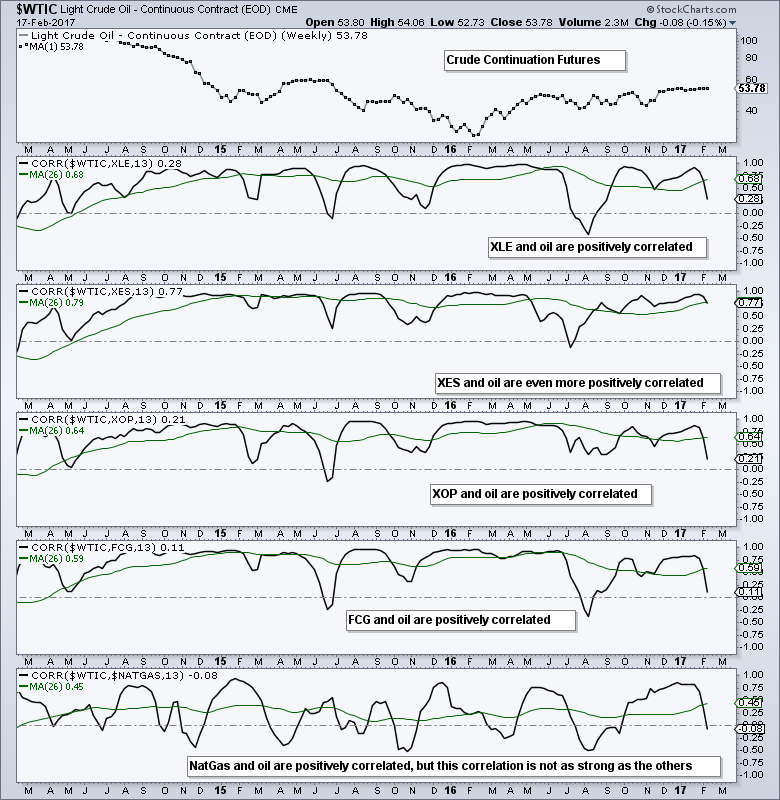
Unsurprisingly, the Energy SPDR (XLE), Oil & Gas Equip & Services SPDR (XES), Oil & Gas E&P SPDR (XOP) and FirstTrust Natural Gas ETF (FCG) have strong positive correlations with the price of oil. XES has the strongest correlation and would most benefit from a breakout in oil. Notice that oil and natural gas are positively correlated for the most part. This positive correlation, however, is not near as strong as the positive correlation between XES and $WTIC.
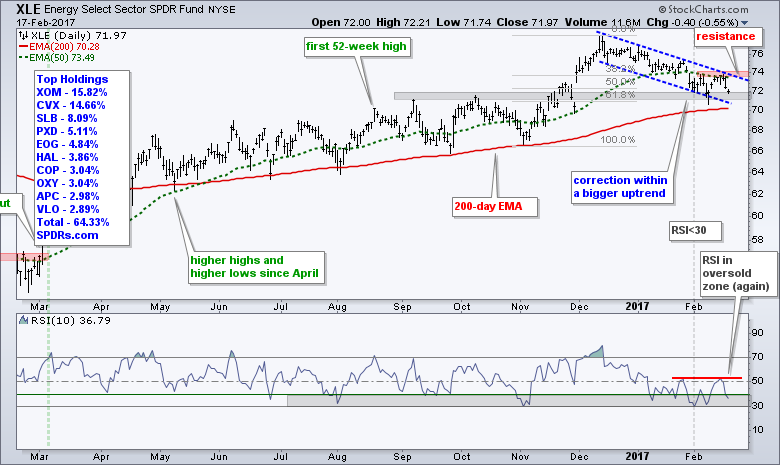
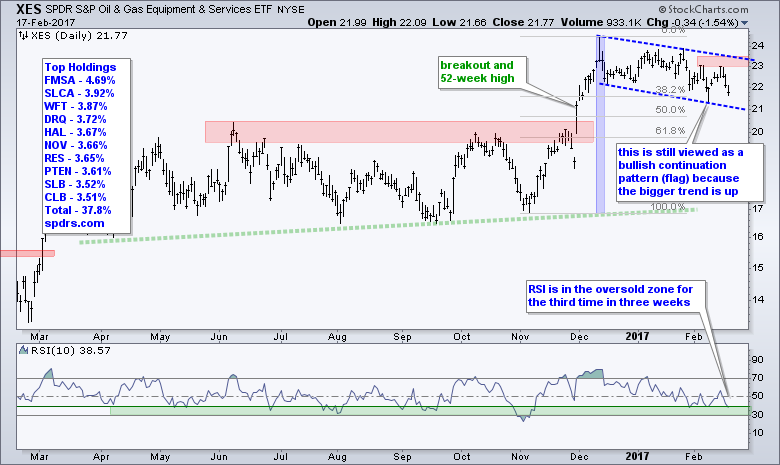
XLE, XES and XOP Correct Along with Oil
Chartists can expect energy-related ETFs to move higher if oil moves higher. My analysis for XLE, XES and XOP is essentially same. These three are in long-term uptrends because they recorded 52-week highs in December. All three corrected over the last two months and I expect a bullish resolution at some point. The red zones mark resistance for these corrections and breakouts would "officially" reverse these two month downtrends. The indicator windows shows 10-day RSI moving into the 30-40 zone multiple times since mid January. I view this as an oversold zone and part of a mean-reversion setup, which means I am on high alert for a bounce and breakout on the price chart.

Focus on Gold for Precious Metals ETFs
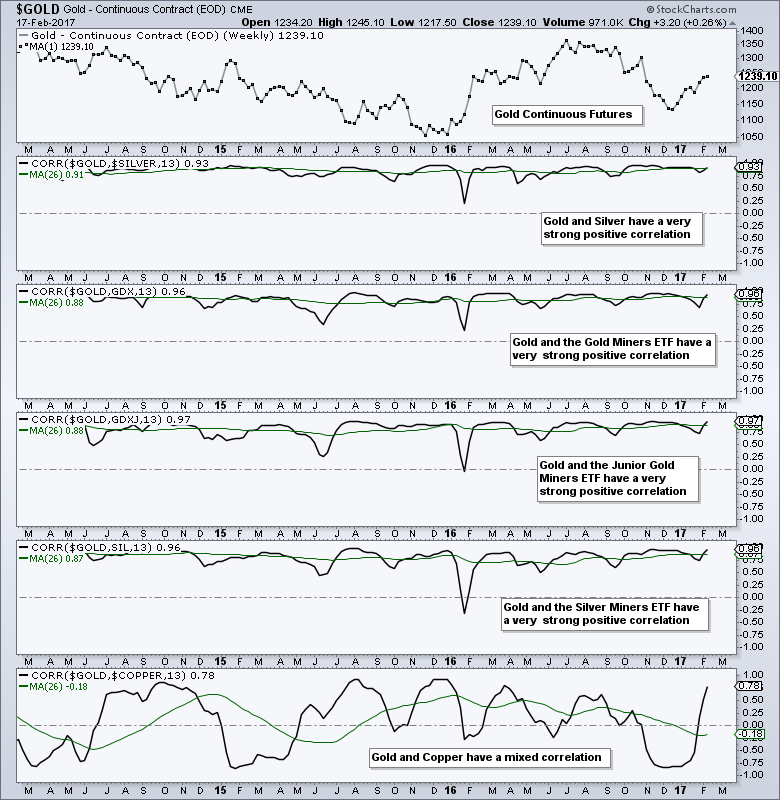
The next chart shows weekly prices for Gold Continuous Futures ($GOLD) and four Correlation Coefficients. Notice that the Silver Continuous Futures ($SILVER), Gold Miners ETF (GDX), Junior Gold Miners ETF (GDXJ) and Silver Miners ETF ($SIL) have a very strong positive correlations with gold. These correlations are so strong that chartists can pretty much ignore these charts and simply focus on gold. One can be bullish on these four when gold is bullish and bearish on these four when gold is bearish.
Watching the Wedge and Fib Retracement in Gold
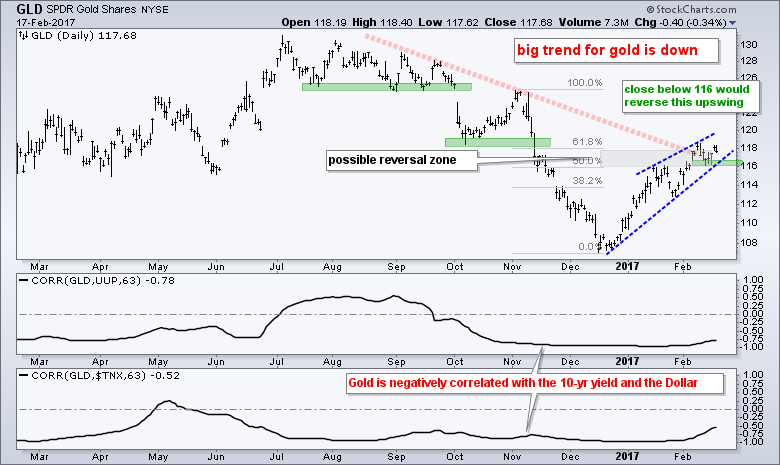
I am negative on gold because the long-term trend is down and the advance to 118 is viewed as a counter-trend move. In other words, I think it is a bear market rally. Notice that the Gold SPDR (GLD) retraced around 61.8% of the prior advance with a rising wedge. The pattern and the retracement amount are typical for bear market rallies. The wedge trend line and last week's low mark first support at 116. A close below this level would provide the first sign of a trend reversal. Chartists should also watch the Dollar and the 10-yr Yield because gold is negatively correlated to these two.
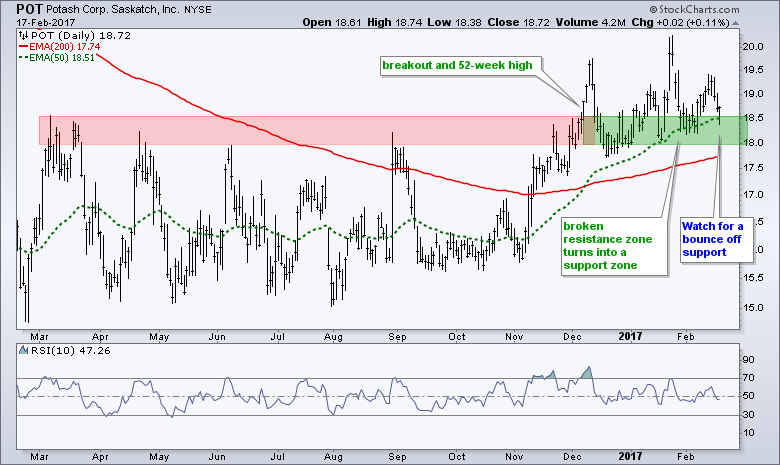
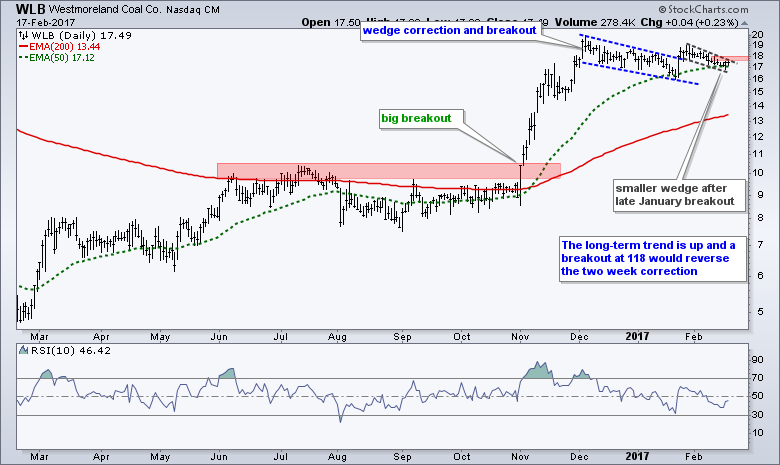
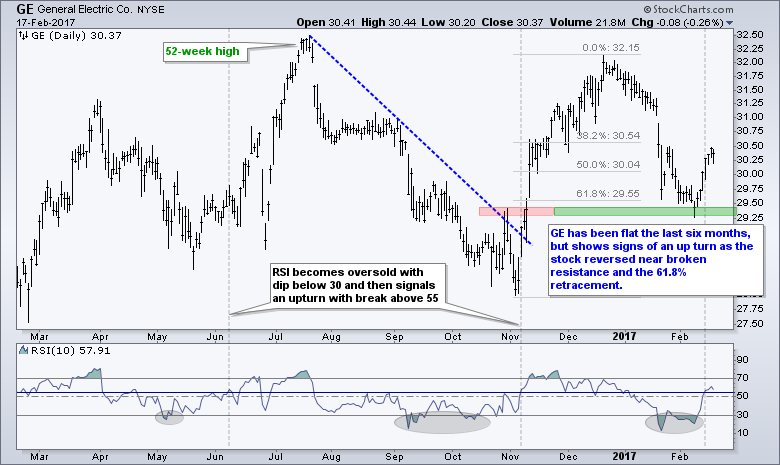
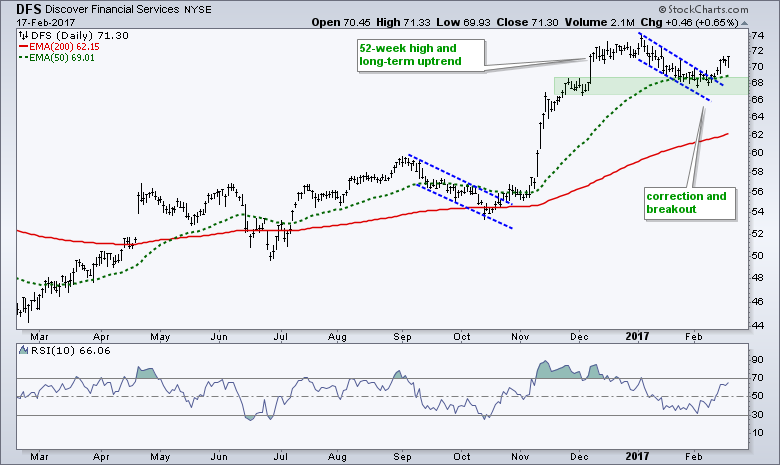
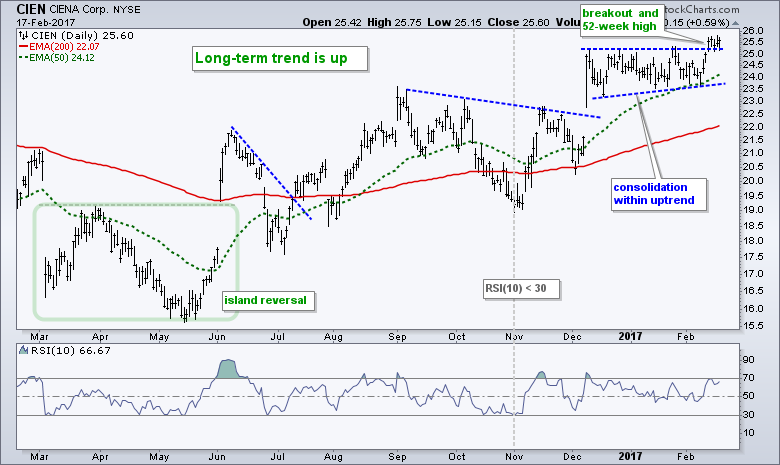
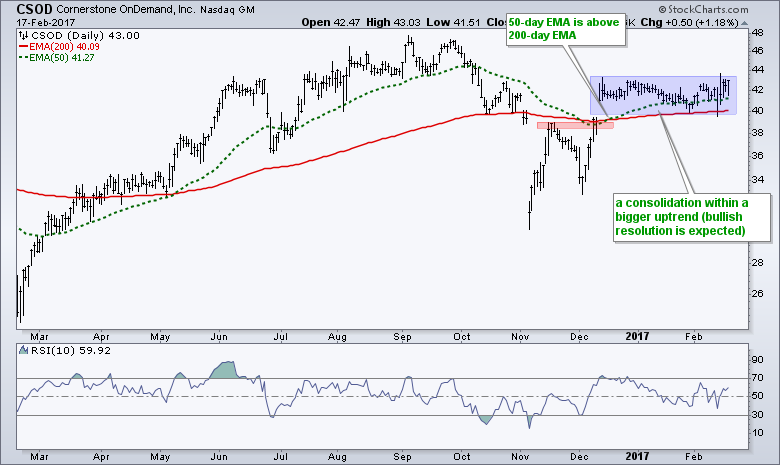
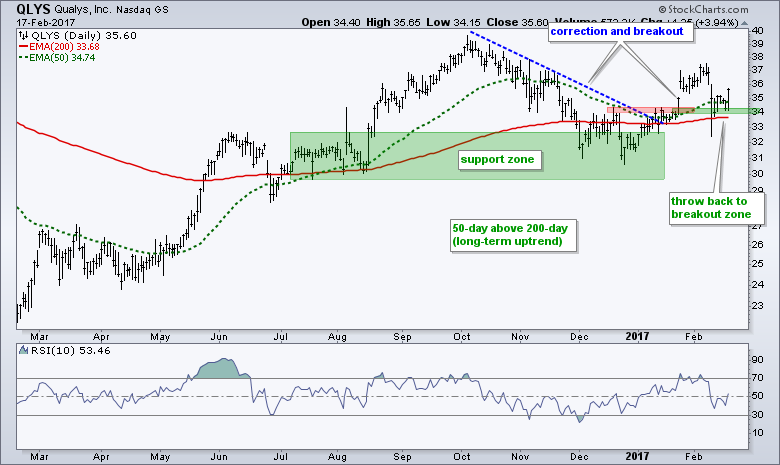
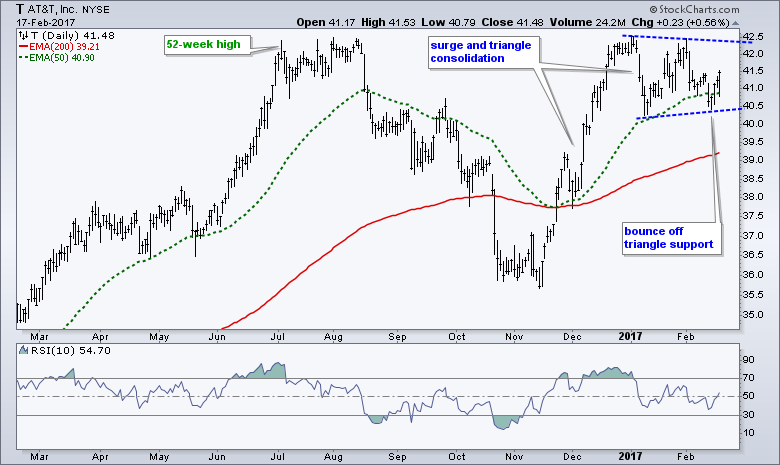
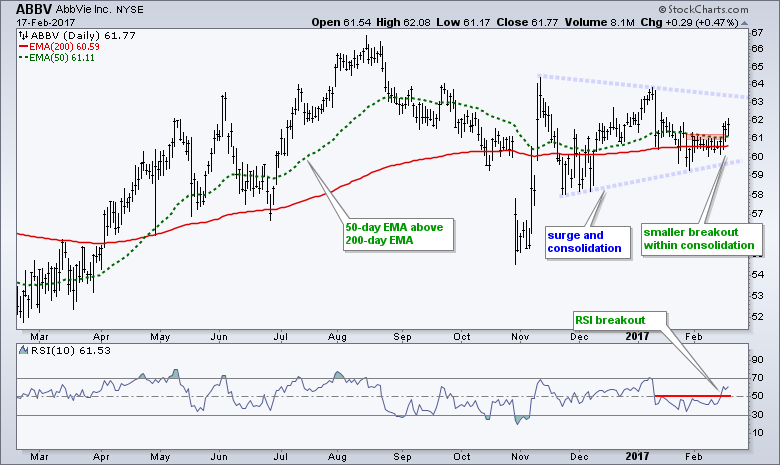
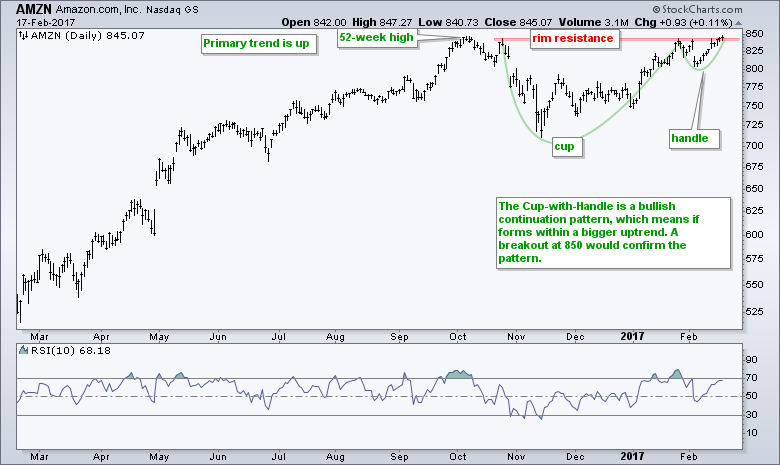
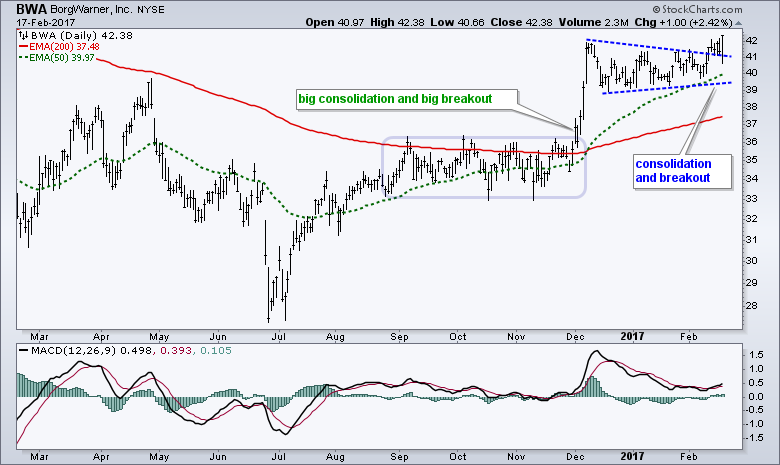
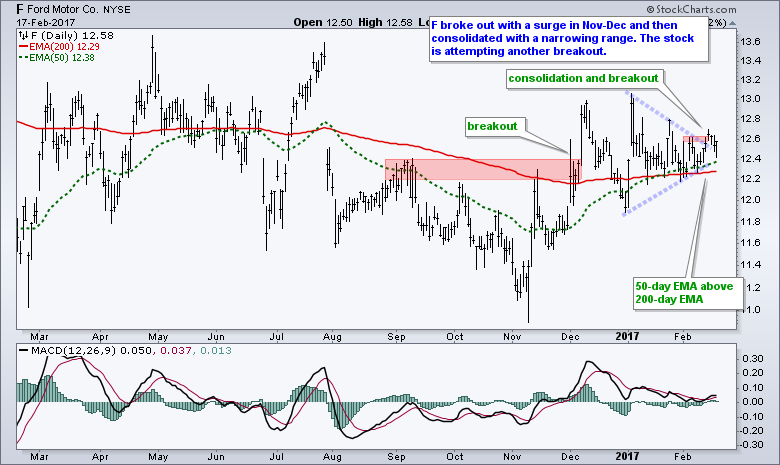
14 Bullish Stock Charts
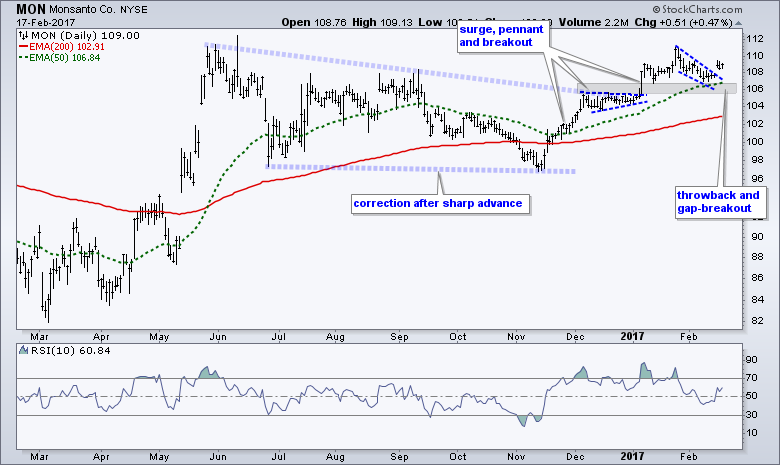
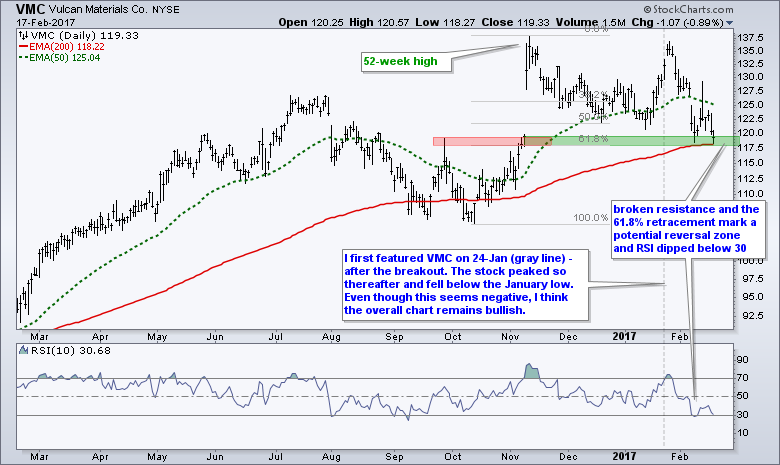
The next chart highlight stocks with bullish setups. Even though the stock market seems extended, the trends are clearly up and bullish setups are preferred. It is as simple as that. Look for bullish setups in a bull market and stay out of the market during a bear market. As noted in the Saturday's Weekly Market Review & Outlook, the long-term trends are up for SPY, QQQ and IJR. The industrials, technology and finance sectors are leading. Healthcare is perking up and showing leadership this year. I am also watching retail and housing, which were featured last Tuesday.
 ******************************************************
Spotting Pullbacks and Upturns within an Uptrend using RSI and MACD Histogram.
Difference between EMA and SMA - Using %Above 200-day EMA for Breadth Analysis.
Backtesting Different Moving Average Pairs with SPY, QQQ and IWM.
ETF Master ChartPack - 300+ ETFs organized in a Master ChartList and in individual groups.
Follow me on Twitter @arthurhill - Keep up with my 140 character commentaries.
****************************************
Thanks for tuning in and have a good day!
--Arthur Hill CMT
Plan your Trade and Trade your Plan
*****************************************


