----- Video Link ----- Art's Charts ChartList (updated 18-Feb) -----
Programming Note: The Art's Charts Chartlist has been updated with 30 annotated charts covering the industry group ETFs. The outline above is for the video and I cover many of these industry group ETFs in the video.
Big Sectors Push Market to New Highs
It was another record week in the stock market with most major index ETFs hitting fresh 52-week highs. Stocks were deemed overbought two weeks ago and just became even more overbought. Small-caps were missing from the new high parade in early February, but joined in as the S&P SmallCap iShares (IJR) and Russell 2000 iShares (IWM) hit new highs this past week. Three of the four equal-weight sector ETFs hit new highs (industrials, finance and tech), while four of the five sector SPDRs hit new highs (industrials, finance, technology and consumer discretionary). These four sectors are the offensive sectors and it bodes well for stocks when these sectors hit new highs.
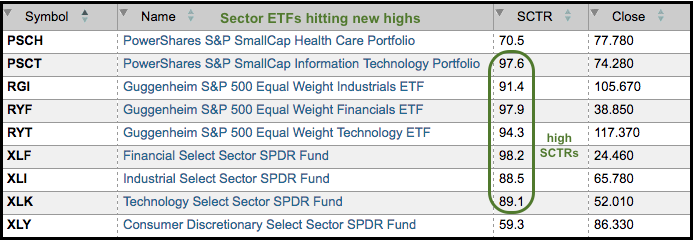 The table above highlights the sectors hitting new highs and the SCTRs for seven of those sectors. Notice that the SCTRs for technology, industrials and finance are 88 or higher. These three sectors account for around 46% of the S&P 500 SPDR. Throw in renewed strength in the healthcare sector and more than 50% of the stock market is strong, very strong.
Industrials, Finance and Tech Lead New High List
The table below shows the nine-sectors and the S&P 500 ranked by the 5-day SMA of High-Low Percent (based on the 16-Feb close). High-Low Percent equals new highs less new lows divided by total issues. This ranking shows finance, technology and industrials at the top with the most new highs (as a percentage of the sector). The 5-day SMA of S&P 500 High-Low% ($SPXHLP) is at 13.4% and serves as the benchmark. High-Low Percent values above are outperforming and values below are underperforming.

The chart below shows High-Low Percent as a histogram. The value for the 5-day SMA is shown on the right side and the sectors are sorted by this value. Notice that High-Low Percent for the S&P 500 exceeded 15% during the week and this suggests that more than 15% of stocks in the S&P 500 hit new highs this week. In fact, there were 85 new highs (!SPXHISPX) on Wednesday and this represents 17% of the index.
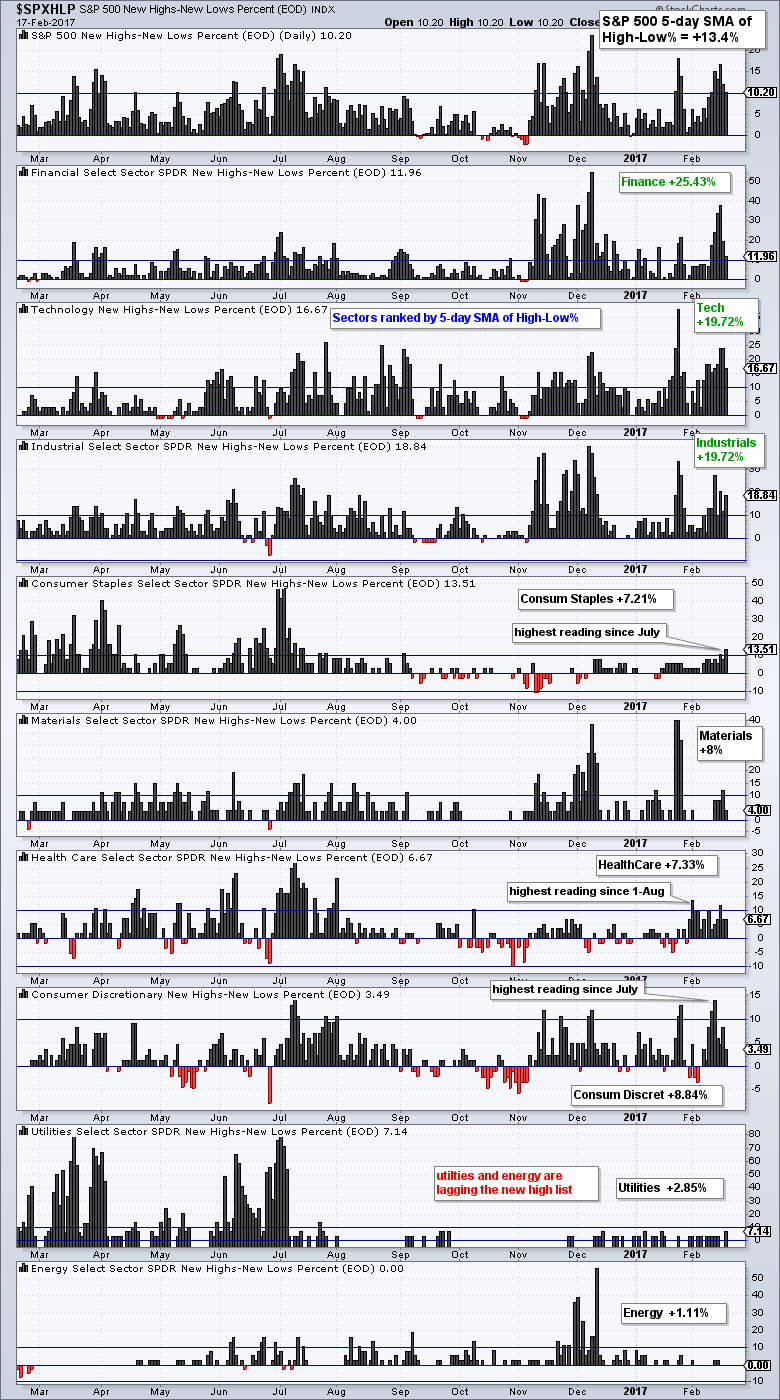
Small-cap High-Low Percent Lags
Even though we are in a bull market and large-caps are leading the way, S&P 600 High-Low% ($SMLHLP) is lagging. The chart below shows High-Low Percent for the S&P 500, S&P MidCap 400, S&P Small-Cap 600 and Nasdaq 100. A move above +10% triggers a bullish signal and this remains in force until a bearish signal triggers (move below -10%). The S&P 500 and S&P MidCap 400 have been bullish since late March, while the Nasdaq 100 and S&P Small-Cap 600 have been bullish since early June.
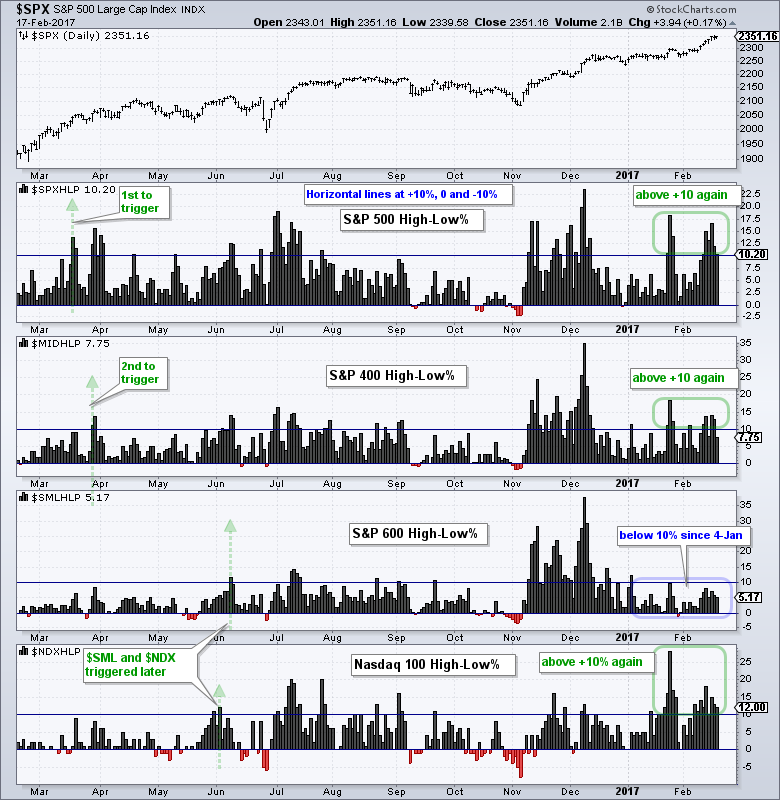
There was another surge in new highs this past week as High-Low Percent exceeded +10% for the S&P 500, S&P MidCap 400 and Nasdaq 100. High-Low Percent for the S&P Small-Cap 600, however, has not been above +10% since January 4th. I would not call this a bearish divergence per se, but it does show less strength within the small-cap index. The trouble does not start until we see new lows expand and High-Low Percent turn negative (see mid October for reference). You can read more about High-Low Percent in this detailed article.
Discretion Could be the Better Part of Valor
We are in a bull market and this argues to be strategically bullish. Even though SPY and QQQ are exceptionally strong right now, stocks don't always go straight up and corrections are part of the process. I am tactically cautious on SPY because the odds of a pullback are high. Stocks are highly correlated so a pullback in SPY would no doubt affect the majority of the market to some degree. I cannot put a number on these odds and I cannot time a pullback within a bigger uptrend, but three items point to some sort of correction in the coming weeks. First, RSI has reached extremes for both QQQ and SPY. Second, small-caps are lagging when it comes to new highs. Perhaps small-caps will play catch-up and IJR will hold its breakout. Third, the 10-yr T-Yield ($TNX) did not breakout this week and the 20+ YR T-Bond ETF (TLT) did not break down. A breakdown in bonds is needed to provide fuel for the stock market.
Overbought is a Double-edged Sword
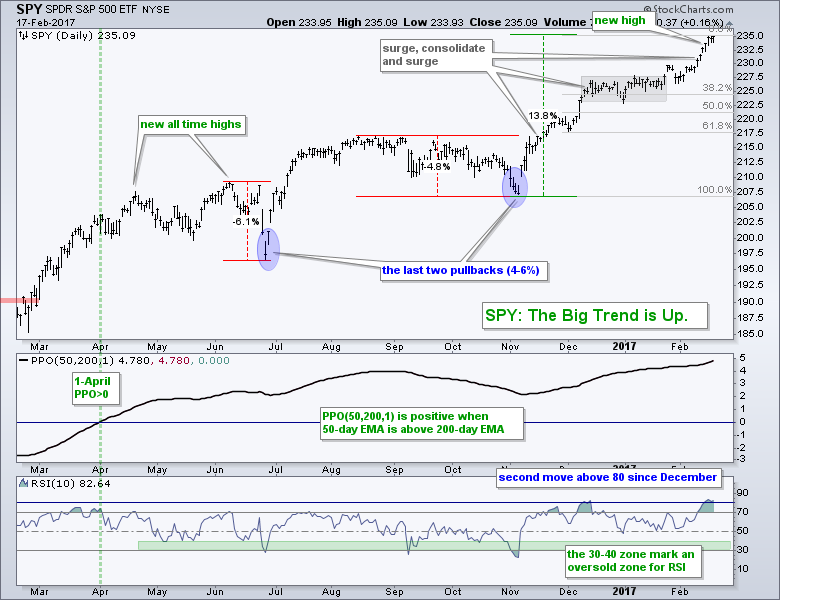
The S&P 500 SPDR (SPY) added to its consolidation breakout and hit new highs again this week. The ETF is up around 14% from the early November low to the mid February high. Notice that 10-day RSI moved above 80 for the second time in three months. The last move above 80 foreshadowed the consolidation from mid December to mid January (gray area). We need to be careful with so-called overbought and oversold readings. Sometimes an extreme overbought reading in RSI leads to a pullback (25-Nov-2014) and sometimes the uptrend simply extends (9-Jun-2014). Keep in mind that it takes strong buying pressure to reach overbought conditions. This means the term overbought is a double-edged sword. It argues for short-term caution (1-12 weeks) and long-term optimism (3-6 months). I still think a pullback will create an opportunity and will watch the 38.2% retracement area when and if one occurs.
RSI Extends Overbought Period for QQQ
QQQ advanced over 14% from the early November low to the mid February high and RSI extended its run above 70. Notice that the June-August advance was around 16% and RSI hovered around 70 for five weeks before QQQ moved into a correction. RSI first move above 70 on 11-Jan and the indicator has been hovering around 70 for five weeks now. Notice that QQQ advanced 5% since RSI first exceeded 70. At this stage, I am watching for a break below 50 to show weakening momentum that could signal the start of a corrective period.

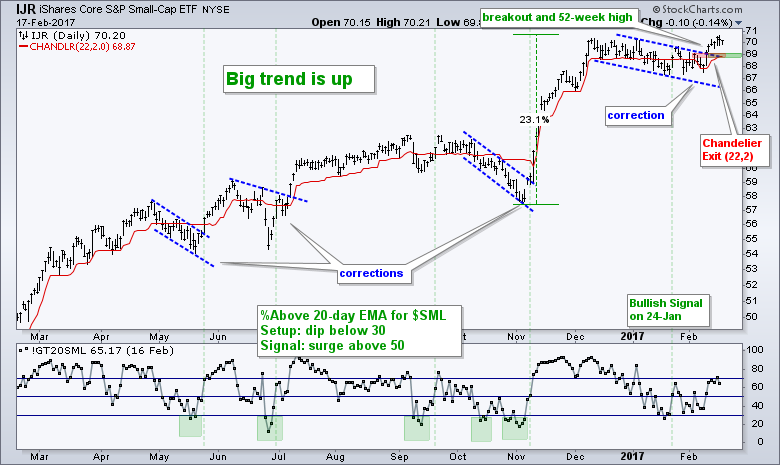
Watching the Breakout Zone in IJR
The S&P SmallCap iShares (IJR) finally caught fire with a surge and flag breakout. Even though small-cap High-Low Percent is lagging, I will treat the breakout as bullish until there is evidence to the contrary. The breakout zone around 69 becomes the first area to watch for a breakout failure. I would not view a breakout failure as bearish. It would just suggest that IJR may need more time correcting within the bigger uptrend.
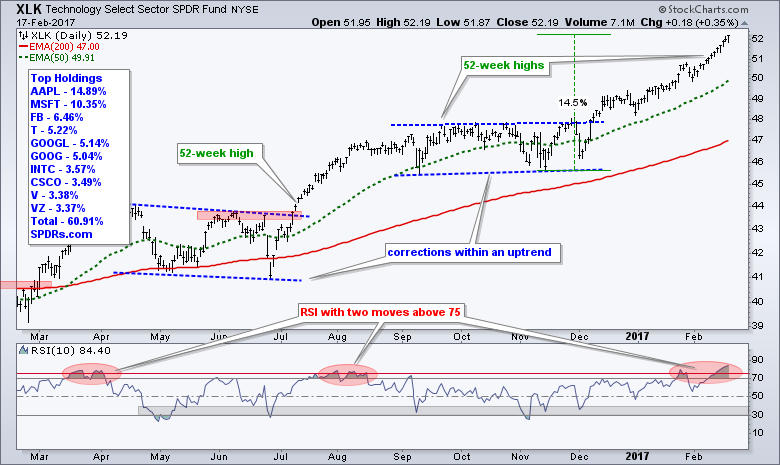
XLK and XLI Hit New Highs
The healthcare sector took the spotlight two weeks ago as the HealthCare SPDR (XLV) surged off support. Consumer discretionary took the spotlight last week as new highs expanded within the sector. This week we seem to be back to the original market leaders with fresh new highs in technology, industrials and finance. The Technology SPDR (XLK) sports a string of new highs since the breakout on December 8th. The indicator window shows RSI with two pushes above 75. I also highlighted the last two times the indicator made two pushes above 75 in red. The advance fizzled after the second push in early April and again in early August. History does not always repeat itself, but XLK is clearly extended right now and it may pay to exercise some patience.
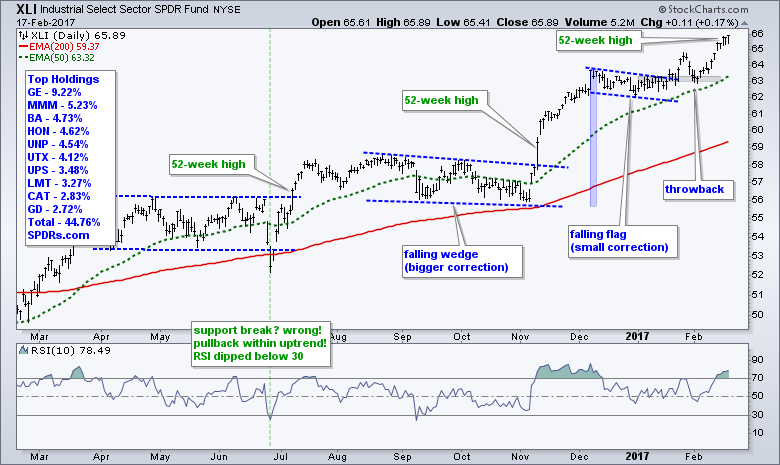
The Industrials SPDR (XLI) was one of the first to break out of its consolidation and hit new highs in late January. The ETF continued its market-leading price action with another new high this week.
Finance Renews its Leadership Bid
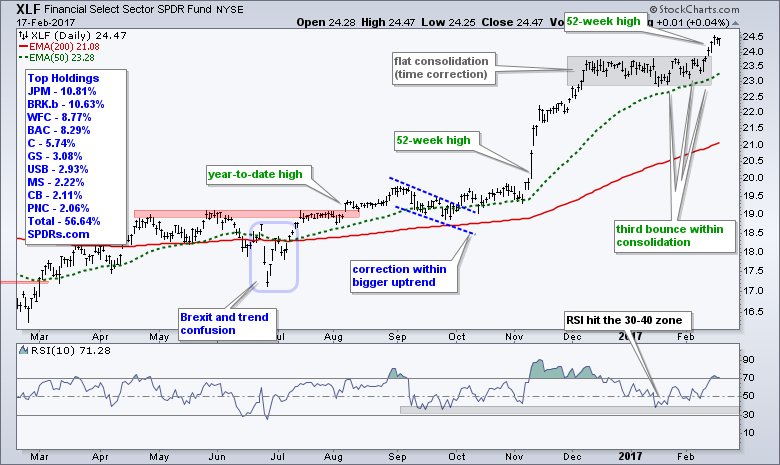
The breakout and renewed leadership from the finance sector is the big story this week. Banks got a break as the 10-yr T-Yield ($TNX) moved sharply higher the first three days of the week. As shown further down in the charts below, $TNX did not break out of its consolidation pattern and moved sharply lower on Thursday and Friday. This is a concern for banks. On the price chart, the Finance SPDR (XLF) broke out of its consolidation and hit a new high. This breakout is clearly bullish and the consolidation zone marks the first area to watch for support.
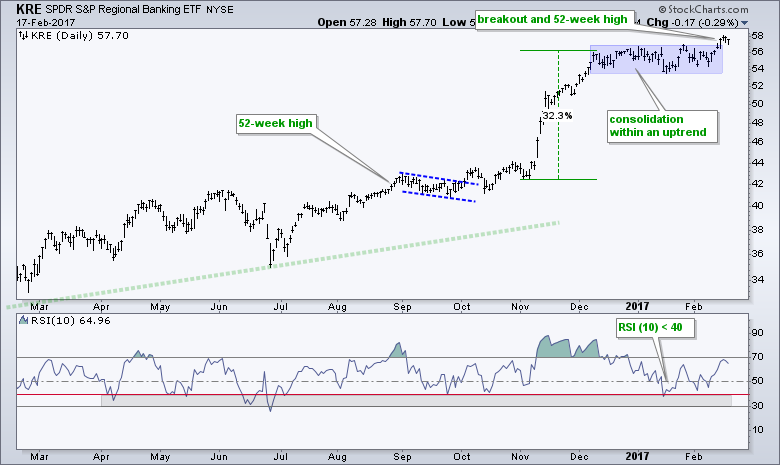
 The Regional Bank SPDR (KRE) also broke out and hit a new high. KRE is currently just above the consolidation zone. While a move back into the consolidation might seem like a failed breakout, I would not become too bearish because the overall trend is up and I would expect support in the 54-56 area on any dip.
Big Four Power XLY to another New High
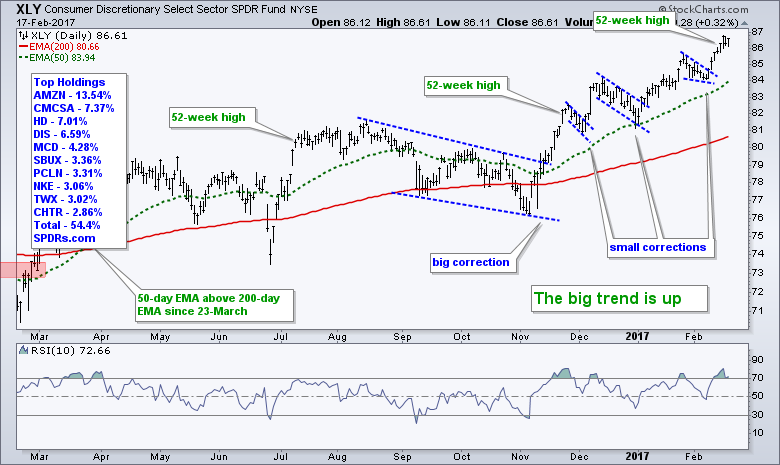
The Consumer Discretionary SPDR (XLY) is one of the leading sector SPDRs because the top four stocks are near new highs. AMZN, CMCSA, HD and DIS account for over 35% of the ETF and all four are up double digits since mid November. On the price chart, XLY sports a big breakout in mid November and three smaller breakouts. The ETF hit another new high this week and remains one of the leading sector SPDRs.
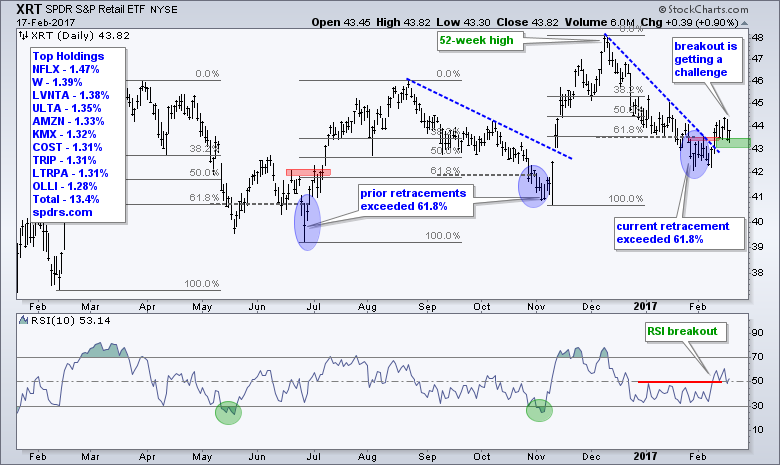
All eyes will be on the Retail SPDR (XRT) to see if it can hold its breakout and continue higher. XRT broke out with a surge above 44 and then fell back sharply on Thursday. The breakout zone around 43-43.5 is the first area to watch for a failed breakout.
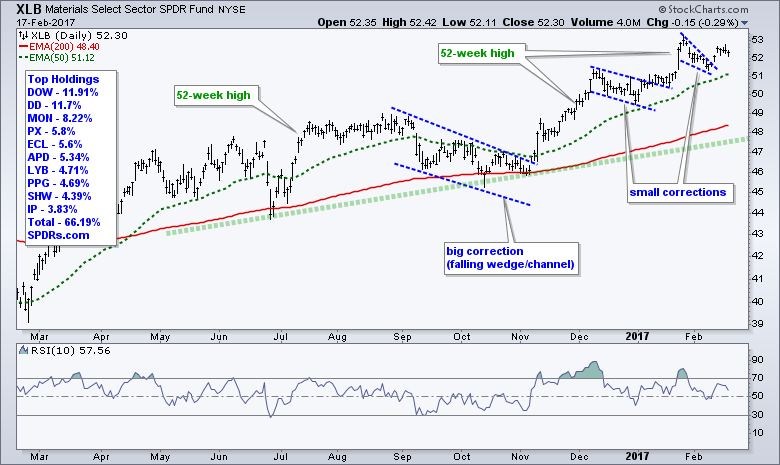
The Materials SPDR (XLB) sports a pair of smaller breakout this year. Most recently, XLB surged to a new high in late January and fell back in early February with a small wedge correction. The ETF broke out of this wedge last week and the breakout is holding so far. Notice that the big chemical stocks dominate XLB. Dupont, Dow, Monsanto, Praxair, Ecolab and Air Products account for around 47% of the ETF.
Energy ETFs Remain Stock in Corrections
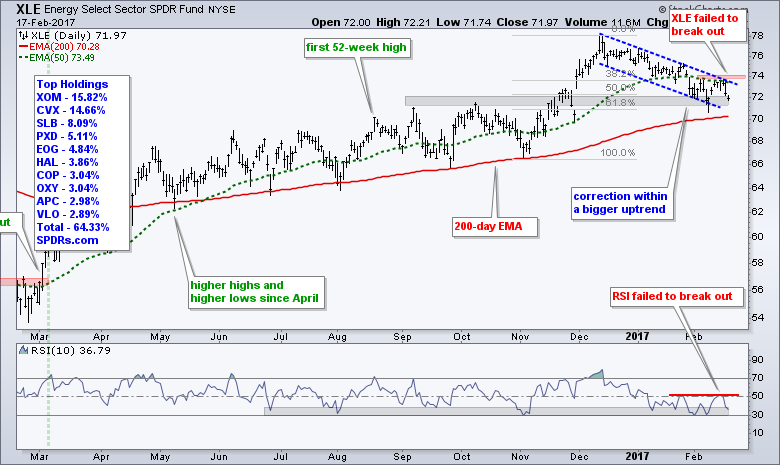
The Energy SPDR (XLE) remains within its falling channel as it failed to break out this week. XLE started the week strong, but fell sharply on Thursday to affirm resistance at 74. Even though I still view this is a correction within a bigger uptrend, this correction is overstaying its welcome and energy remains one of the weakest sectors in the market right now. Watch oil for clues.
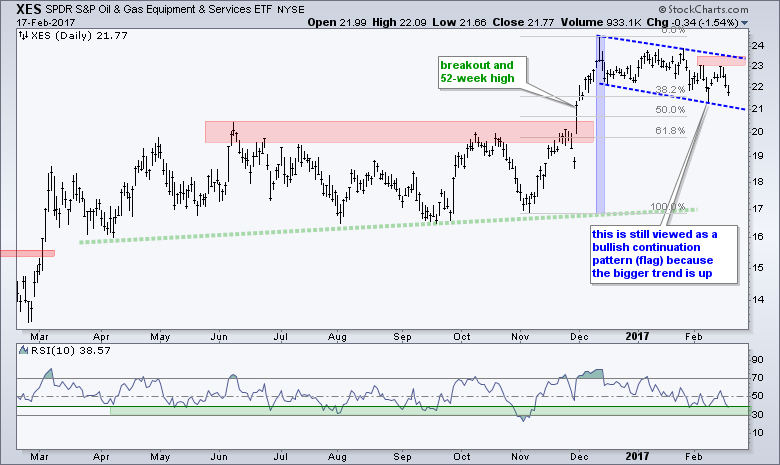
The Oil & Gas Equip & Services SPDR (XES) also remains within a corrective pattern that looks like a bull flag. A break above the red resistance zone (23.5) is needed to officially reverse this flag. Meanwhile RSI is back near 40 and toying with the oversold zone.
Biotech SPDR Notches a New High
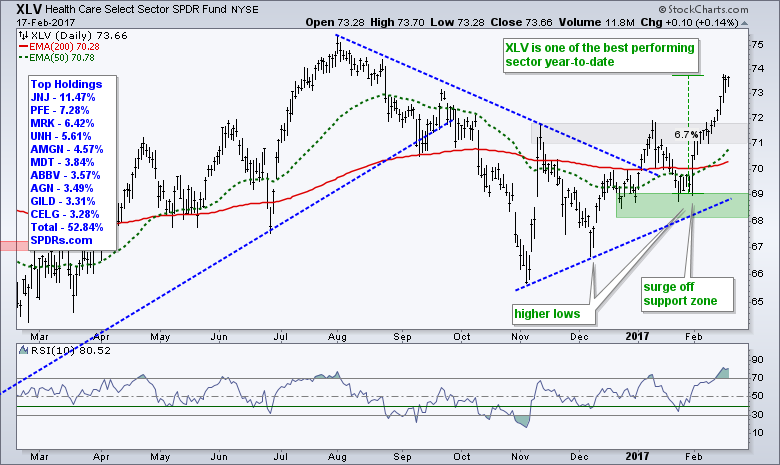
The HealthCare SPDR (XLV) is one of the top performing sectors this week and this year. It all started with the late January surge off the support zone and XLV continued higher in February. Note that JNJ, PFE and MRK, the top three holdings, broke above their December-January highs this week. These three are up 6-9% since late January and powering the sector. As with SPY, XLV is getting a bit extended after a 6+ percent surge in three weeks. The 71-72 area marks the first zone to watch on a pullback. Elsewhere, note that the HealthCare Providers ETF (IHF) and Medical Devices ETF (IHI) hit new 52-week highs.
 Let's not forget about biotechs because the Biotech SPDR (XBI) hit a 52-week high this week. Note that this is the first new high since 20-June-2015, eighteen months ago. On the price chart, XBI formed a big triangle from October to February and broke out with a surge the last two weeks. The breakout zone around 66 is the first area to watch on a pullback.

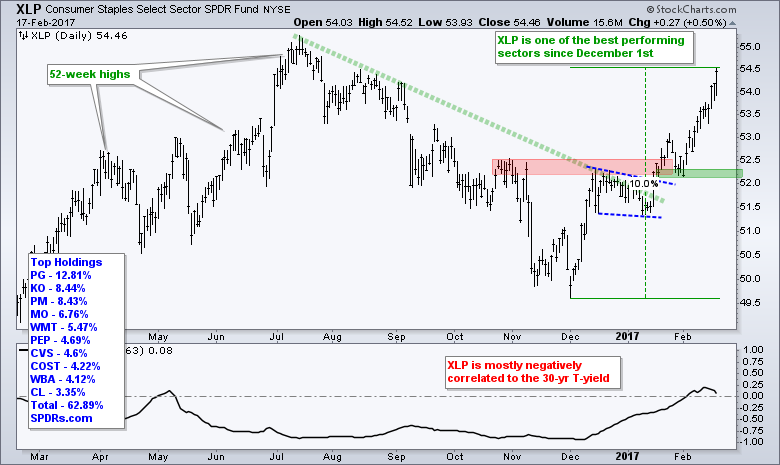
Tobacco Stocks Power XLP
I have been flat out wrong on the Consumer Staples SPDR (XLP) because the wedge never reversed and the ETF extended its advance with a surge in February. Overall, XLP is up around 10% from its early December low. Four stocks account for most of this gain (Procter & Gamble, Phillip Morris, Altria and Costco). It is still not my preferred sector in a bull market though.
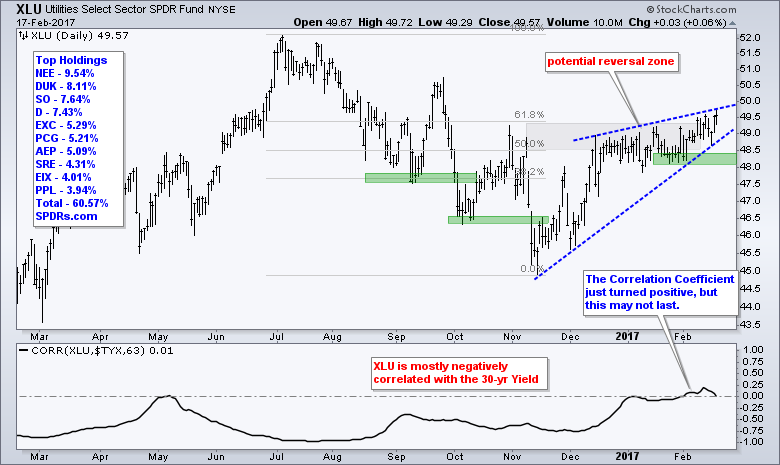
XLU Remains with Bear Wedge
In contrast to XLP, the Utilities SPDR (XLU) remains with a rising wedge and a possible bearish setup. The ETF is also stalling near the 61.8% retracement. I raised wedge support to 48 and would respect this counter-trend advance as long as this level holds. XLU is dependent on Treasury yields so chartists should watch yields for clues. An upside breakout in the 30-yr yield would be bearish for XLU, while a downside break would keep the bid in utility stocks.
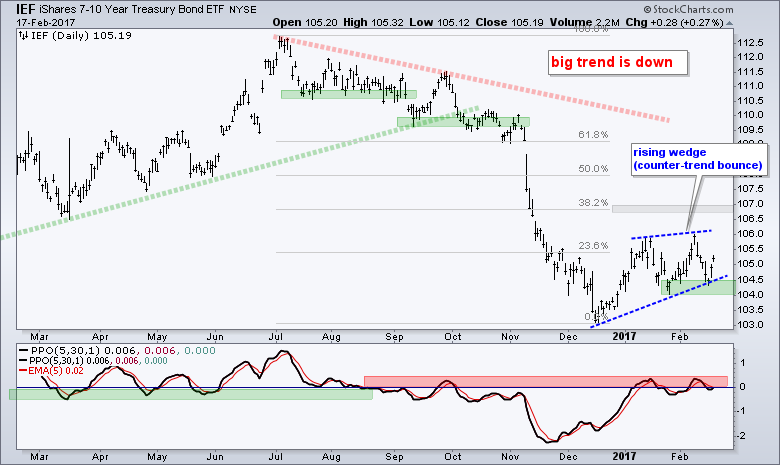
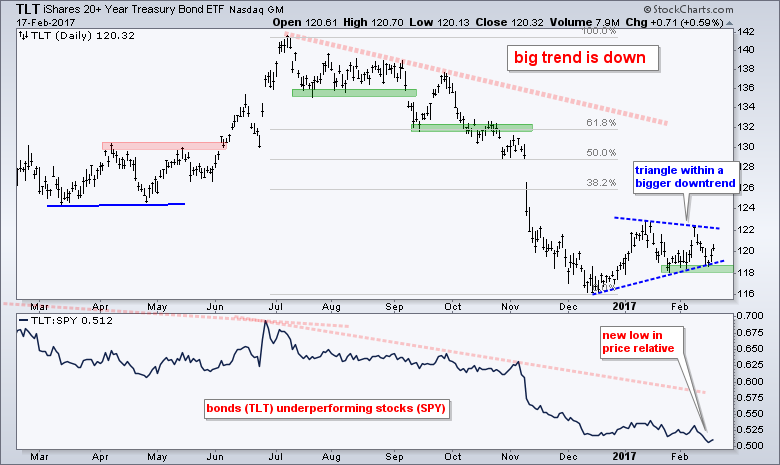
T-Bond ETFs Tests Consolidation Lows
The 7-10 YR T-Bond ETF (IEF) and 20+ YR T-Bond ETF (TLT) remain in bearish continuation patterns. First, the long-term trends are down because both fell sharply from July to December. The bounce over the last two months alleviated oversold conditions. IEF formed a rising wedge and TLT formed a triangle. Both tested the lower boundaries with sharp decline early this week, but bounced on Thursday and did not break down. A close below 104 in IEF and 118 in TLT would break consolidation support and signal a continuation lower. Such a move would be bullish for banks, brokers and stocks in general.
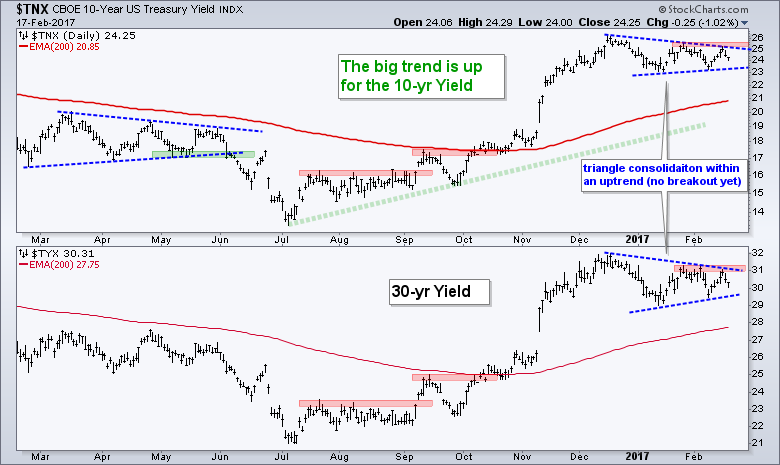
10-yr Yield Extends Consolidation
The 10-yr T-Yield ($TNX) and 30-yr T-Yield ($TYX) remain stuck in consolidation patterns. Watch for upside breakouts to end these consolidations and signal a continuation higher. Treasury yields lead Fed policy and a breakout would signal more tightening. Also note that an improving economy and/or inflationary pressures result in higher yields.
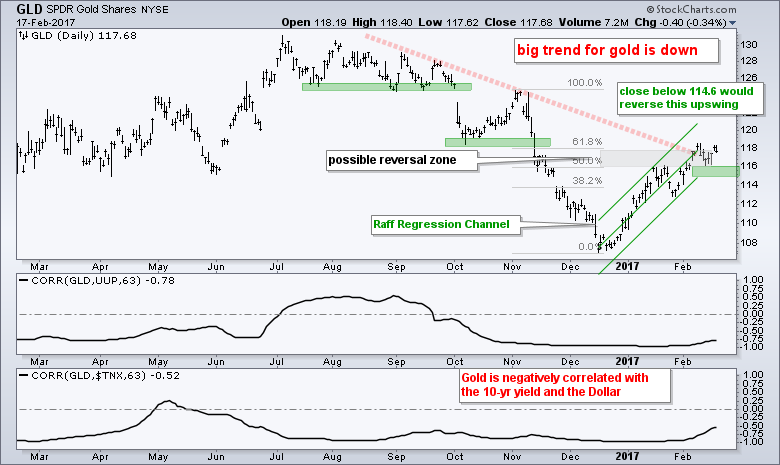
Gold Stalls Near Key Fib Level
There is no change for the Gold SPDR (GLD) as the ETF stalls in the 50-61.8% retracement zone. I think the long-term trend is down and the bounce back to 118 is a counter-trend advance. The Raff Regression Channel marks support at 114.6 and a break below this level would reverse the current upswing. Watch the 10-yr yield and the Dollar for clues as well. Gold tends to move in the opposite direction of these two.
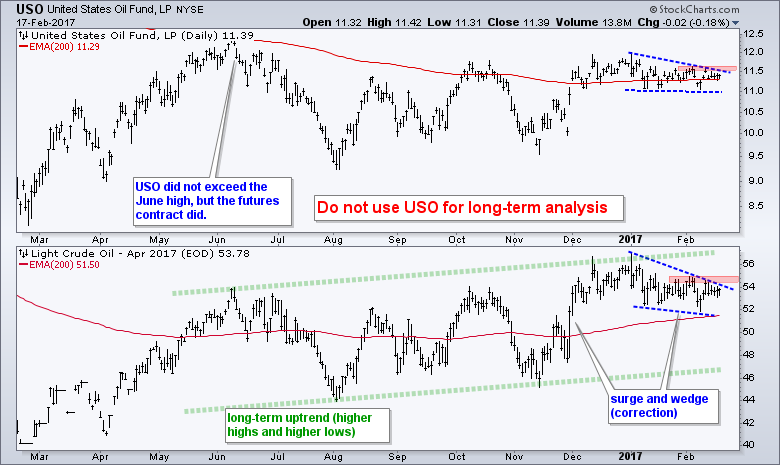
Oil Remains Stuck in Falling Wedge
Energy-related stocks could use some help from oil because crude remains stuck in the low 50s. Overall, I still see a long-term uptrend in oil (green trend lines). Shorter term, I see a surge above 56 and a falling wedge correction the last six weeks. A correction after a surge is normal. Look for a break above 55 to signal an end to this correction and a resumption of the bigger uptrend. Such a move would lift energy stocks.
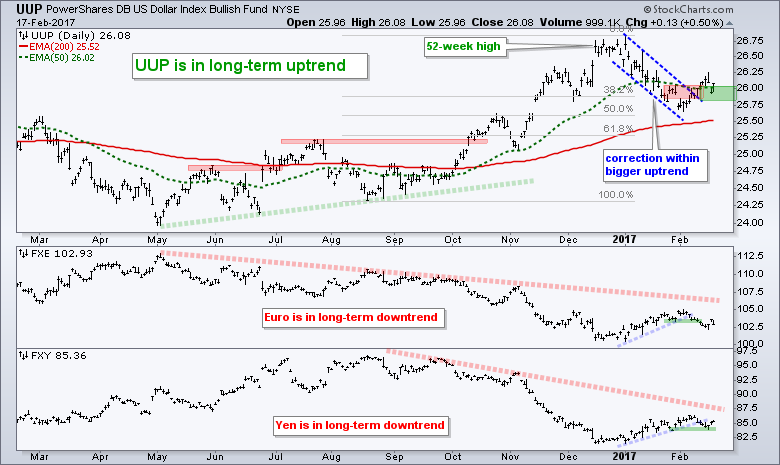
Dollar Breaks out of Channel
The US Dollar ETF (UUP) broke out of its falling channel with a move above 26 and then fell back a little. Overall, I view this breakout as bullish and I think it signals a continuation of the bigger uptrend. At the risk of getting too granular, I think the breakout zone around 25.8-26 is the first area to watch for the success of the breakout. A close below 25.8 would call for a re-evaluation.
******************************************************
Spotting Pullbacks and Upturns within an Uptrend using RSI and MACD Histogram.
Difference between EMA and SMA - Using %Above 200-day EMA for Breadth Analysis.
Backtesting Different Moving Average Pairs with SPY, QQQ and IWM.
ETF Master ChartPack - 300+ ETFs organized in a Master ChartList and in individual groups.
Follow me on Twitter @arthurhill - Keep up with my 140 character commentaries.
****************************************
Thanks for tuning in and have a good day!
--Arthur Hill CMT
Plan your Trade and Trade your Plan
*****************************************


