
.... Introduction
.... Testing During Two Bear Markets
.... Universe, Timeframe and Data
.... Using S&P 500 as a Market Filter
.... Trend-Timing System using the PPO
.... Scaling into the S&P 500
.... Momentum-Rotation System using Rate-of-Change
.... Testing Different Momentum Periods
.... Riding the Roller Coaster
.... Conclusions
.... Scan Code
Introduction
I presented a momentum-rotation system for trading stocks in the S&P 1500 last week and someone asked if this system could be applied to ETFs. Today I am going to look at two systems for trading the nine sector SPDRs. Momentum systems usually work better for stocks because there are always some individual stocks delivering some seriously outsized returns. Momentum systems do not perform as well with ETFs because ETFs do not have the beta and the volatility needed to produce big momentum runs. ETFs represent a basket of stocks. There may be some outsized gains in the individual stocks, but these gains are diluted when part of an ETF.
Testing During Two Bear Markets
Developing and testing trading systems is all about trial and error. There is lots of testing and most results are sub-par, if not downright bad. The systems tested in this article have positive expectations, but the overall returns are just average. Before knocking the results, keep in mind that the 17-year test period includes two bear markets and most sectors were in the red in 2009, less than ten years ago.
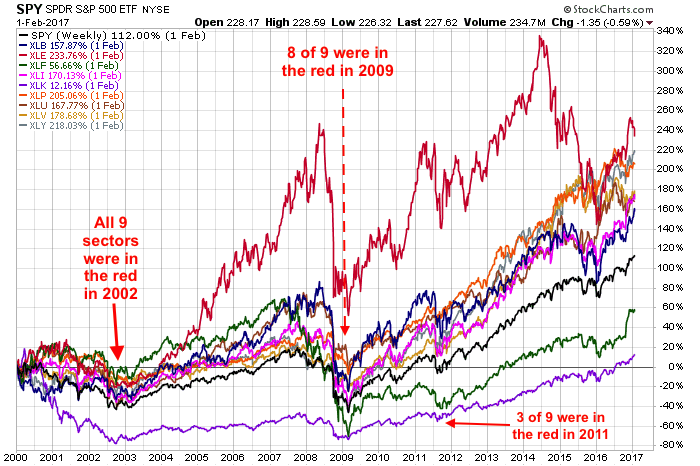
The chart above shows performance for SPY and the nine sector SPDRs since January 2000. All nine sector SPDRs were underwater in the second half of 2002 and eight of nine were back underwater in early 2009. Buy-and-hold investors would have been underway after nine years (2000 to 2009). XLE (red) was the only sector that did not dip back into negative territory. Three of the nine sectors were underwater in 2011 and all nine did not make it back above water until July 2016. XLK (purple) was the last sector to make it back above water.
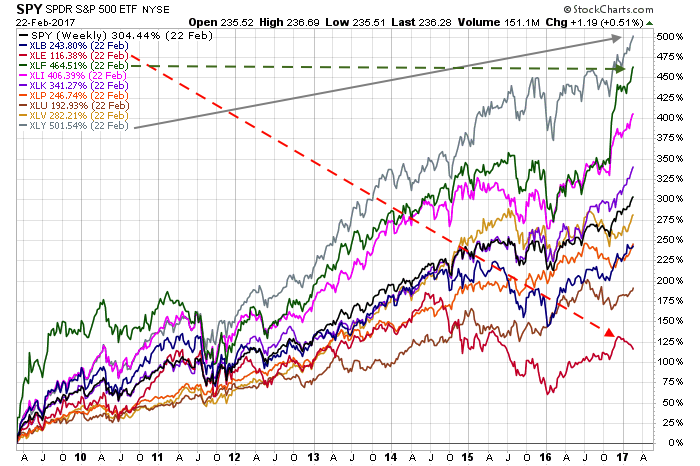
The next chart shows performance since the low in March 2009. All sectors are up since this low with XLY (gray), XLF (green) and XLI (magenta) leading the charge. Notice that XLE (red) is the worst performing sector since the 2009 low. XLU (brown) is also underperforming since the 2009 low.
Universe, Timeframe and Data
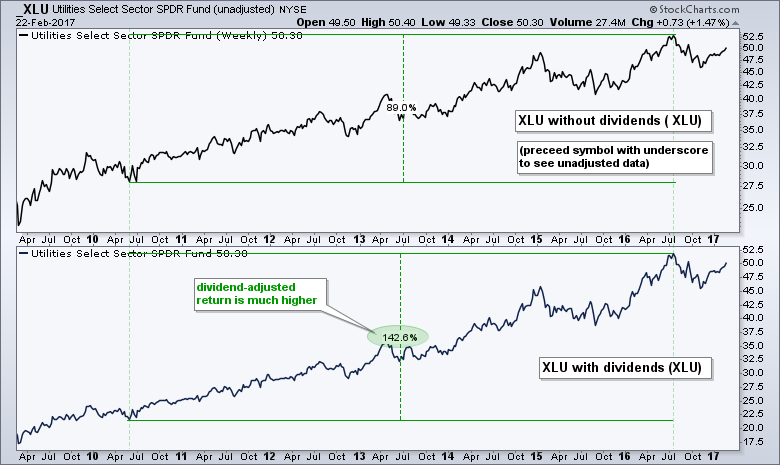
The trading universe will be the nine sector SPDRs and I will be using weekly data for trades. This means the signals will trigger on the weekly close and the trade will happen on the open for the following week. Data for these sector SPDRs extends back to 1999 so I will be testing from 03-January-2000 to 31-January-2017 (17 years and one month). I am using dividend-adjusted data, which means the dividends have been added back into the price. This is also known as total return data. The chart below shows the Utilities SPDR (_XLU) without dividends in the top window and dividend-adjusted XLU in the lower window. Utility stocks have above average dividends and this should be reflected in the returns.
Using S&P 500 as a Market Filter
A broad market trend filter greatly reduces drawdowns because it ensures that the system is out during bear markets. With a filter, the system only looks for long positions when the long-term trend for the broader market is up. I am using the S&P 500 as the broad-market proxy for three reasons. First, it is the most widely used benchmark. Second, it covers around 80% of the investable universe for the US equity market. Third, the golden EMA cross works quite well for broad market timing.
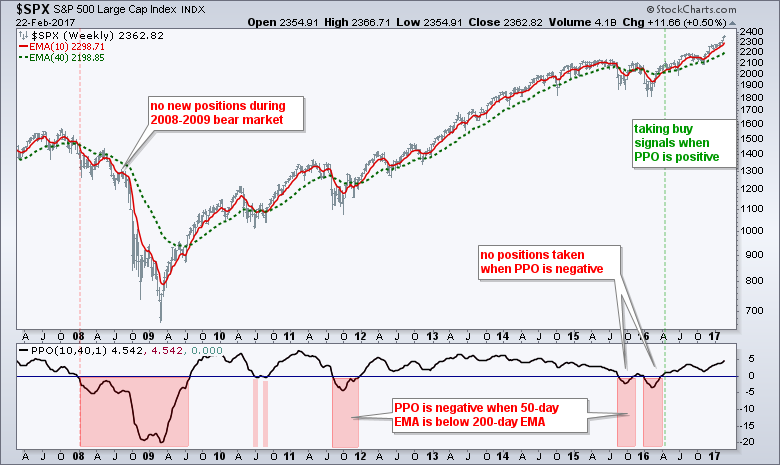
The system tests are based on weekly data so I will be using the PPO(10,40,1) for timing the trend in the S&P 500. The PPO is negative when the 10-week EMA is above the 40-week EMA and positive when the 10-week EMA is above the 40-week EMA. This EMA pair is comparable to the 50-day EMA and 200-day EMA.
The system takes buy signals when the PPO for the S&P 500 is positive and does not take buy signals when the PPO is negative. Existing long positions in the sector SPDRs are not immediately closed when the PPO for the S&P 500 turns negative. Instead, they are closed when their own sell signals trigger. I will show backtest examples with and without an S&P 500 filter.
Trend-Timing System using the PPO
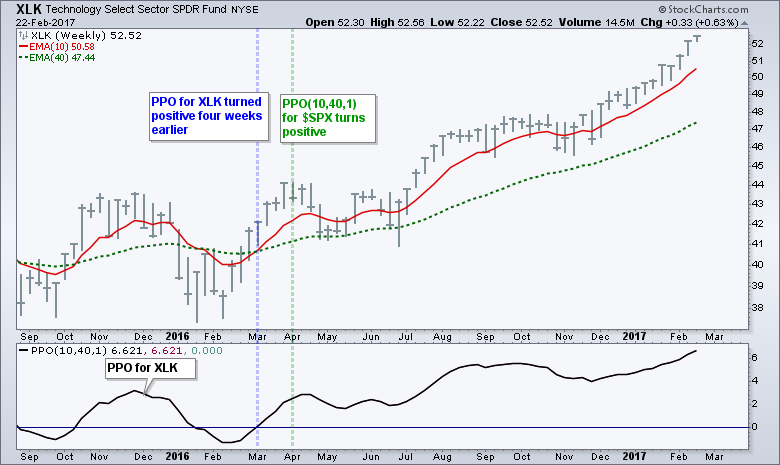
The first system is a trend-timing system that buys the sector SPDRs when the PPO(10,40,1) is already positive or turns positive, and sells when the PPO turns negative. Remember, the system does not look for buy signals until the PPO for the S&P 500 is positive. Sometimes a sector SPDR will already have a positive PPO when S&P 500 turns positive. In such cases, the system simply buys the sectors that already have a positive PPO. These sectors show relative chart strength because their PPOs turned positive before the S&P 500 turned positive. This happened in April 2016 when the PPO turned positive for the S&P 500. The PPOs for XLK, XLI and XLY were already positive and these were the first positions taken.
The table below shows the results for buy-and-hold for the nine sector SPDRs and the PPO trend-timing system with the S&P 500 filter in the second line. For reference, line three shows results without the S&P 500 filter. Buy-and-hold returned 6.22% per annum, but the Maximum Drawdown was 55% because of the 2007-2008 bear market. The PPO trend-timing systems produced similar returns, but the system without the S&P 500 filter had a higher drawdown and a lower Win% (red oval). The trend-timing PPO system with the S&P 500 filter returned 6.97% per annum with a 14.01% Maximum Drawdown (green oval), which is pretty good for such a simple system.
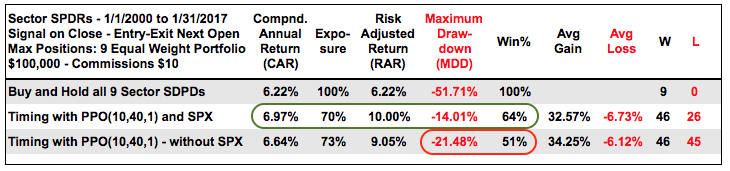
Note that the trend-timing system was invested 70% of the time, while buy-and-hold was invested 100% of the time. The trend-timing system with the S&P 500 filter was out during downtrends and not exposed to the market (less risk). This means chartists could look for alternatives, such as REITs, Gold or Bonds, when not invested in the stock market. Before getting too excited, note that this system does not trade very often and there were just 4.3 signals per year on average over the last 17 years.
Scaling into the S&P 500
When tested over this same period, the trend-timing system applied to the S&P 500 SPDR (SPY) returned 7.53% per annum with a 17% Maximum Drawdown and 5 trades. The trend-timing system using the sector SPDRs generated 72 trades and was invested 70% of the time, which amounts to 12 years. This makes it a natural way to scale into the market (S&P 500). Investors buy sectors as their PPOs turn positive and can hold up to nine equal-weight positions. This means the system would be invested in all nine sectors when the PPO for the S&P 500 is positive and the PPOs for all nine sectors are positive. These positions would be closed as the PPOs for the sectors turns negative.
Momentum-Rotation System using Rate-of-Change
The second system uses momentum to rotate into the best performing sectors and rotate out when they start underperforming. The system buys the five sectors with the highest Rate-of-Change and holds these until they drop out of the top seven. This means the system never owns the two worst performing sectors.
The table below shows results for the 26-week momentum-rotation system with and without the S&P 500 filter. Line two shows results when taking signals while the PPO for the S&P 500 was positive. Line three shows results without the S&P 500 filter, which means the system was invested for the entire period, regardless of the broad market trend. Notice that the system without the S&P 500 filter had a much larger drawdown (47.41% vs 19.42%).
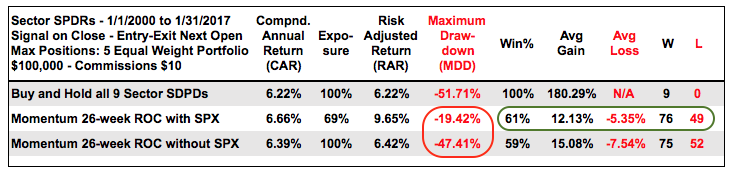
The 26-week Rate-of-Change (ROC) system did not outperform the simple timing system using the PPO. However, it did generate more signals (76 + 49 = 125) than the PPO system (72) and provided more opportunities to trade. The Compound Annual Return was positive, the Win% was respectable (61%) and the Average Gain was more than double the Average Loss (green oval).
Testing Different Momentum Periods
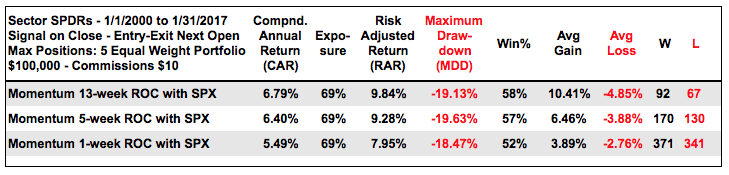
The next table shows the same tests using the 13-week ROC, the 5-week ROC and the 1-week ROC. Again, these systems buy the top five sectors ranked by Rate-of-Change and hold until they drop out of the top seven. Overall, the 13-week ROC and 5-week ROC performed similar to the 26-week ROC. As expected, the Average Gains and Average Losses declined as the Rate-of-Change period decreased.
Riding the Roller Coaster
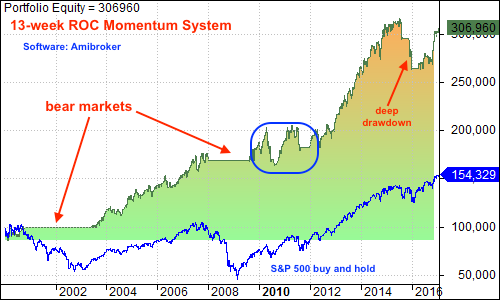
The next chart shows the equity curve (green line) for the Momentum-Rotation System using the 13-week Rate-of-Change. The equity line is basically the running profit-loss from a trading system. This is a great way to judge the ups, downs and frustrations of a system. Don't forget to compare this equity line to the 17 year performance chart that I first showed. The initial investment of $100,000 tripled, but the line was not straight up. In addition to two monster runs (gravy years), there were two bear markets (flat lines), a two year whipsaw (2010-2011) and a deep drawdown in 2015. The system is on an upturn right now and the equity line is almost above its 2015 peak. As with the uptrend in the S&P 500, I do not know how long or how far this upturn will extend.
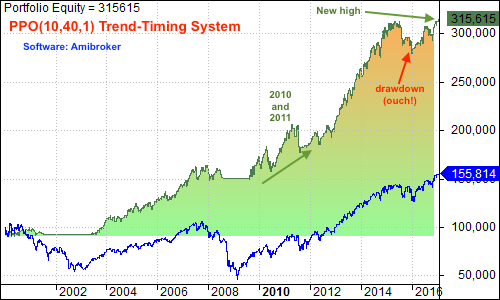
The second equity line is for the Trend-Timing System using the PPO(10,40,1). The system fared a little better during the turbulence of 2010 and 2011. Also notice that the equity line is at a new high and this system is outperforming the 13-week Momentum-Rotation System. I used Amibroker software and Premium Data from Norgate were used to run these backtest.
Conclusions
Timing and momentum clearly add value to the analysis process, as does a broad market filter. The simplest system, which bought when the PPOs for the S&P 500 and the SPDR were positive, performed the best by far, but did not generate very many signals (4.23 per year). I tried shorter EMAs and the results were not near as good. Chartists looking for more signals can turn to shorter momentum periods, such as 13-week ROC and 5-week ROC. Momentum works over time because markets trend and overbought conditions extend. These systems are not perfect and there will be drawdowns, but they can help traders build a strategy and stay on the right side of the market.
Scan Code
The scan code for a 26-week Rate-of-Change rank is shown below. Instead of using a ChartList, chartists can add the symbols individually using the symbol variable. It is not the ideal method, but can be used for a handful of symbols. The last line shows the Rate-of-Change and users can set their own periods.
[symbol="XLY"] or [symbol="XLK"] or [symbol="XLF"] or [symbol="XLI"] or [symbol="XLV"] or [symbol="XLP"] or [symbol="XLU"] or [symbol="XLE"] or [symbol="XLB"]
Rank by Weekly ROC(26)
******************************************************
Thanks for tuning in and have a good day!
--Arthur Hill CMT
Plan your Trade and Trade your Plan
******************************************************
Other Articles in the System Trader Series:
- Introduction to Key Performance Metrics - Quantifying the Golden Cross for the S&P 500
- Golden Cross and 5 Major Indexes - EMAs versus SMAs - Do Short Positions Add Value?
- Setting up Momentum Scans, Creating ChartLists and Exporting Lists.
- MACD Crosses - Rules to Reduce Drawdowns and Increase Gains - Testing PPO Strategy
- Follow me on Twitter @arthurhill - Keep up with my 140 character commentaries.


