.... Small-cap Breadth Deteriorates
.... TLT Tests Support and 2-yr Yields Hits 52-week High
.... Mind the Gaps in these 4 Bank Stocks
.... Where to Check Earnings and News
.... 12 Stocks with Bullish Charts
.... PCN, CX, NUE, EOG, LNG, GE, ATI, JNPR, AKAM, T, EXPE, CAKE
Small-cap Breadth Deteriorates
Stocks declined for the, gasp, third day running as the S&P 500 SPDR (SPY) fell a whopping .30% on the day. SPY is down .86% over the last three days and now trading in Wednesday's gap zone. QQQ is down a horrendous half percent in three days and also in the gap zone. IJR is down 2.05% and trading below last week's low. Small-caps are clearly not performing well right now and we can see this with a deterioration in the breadth indicators.
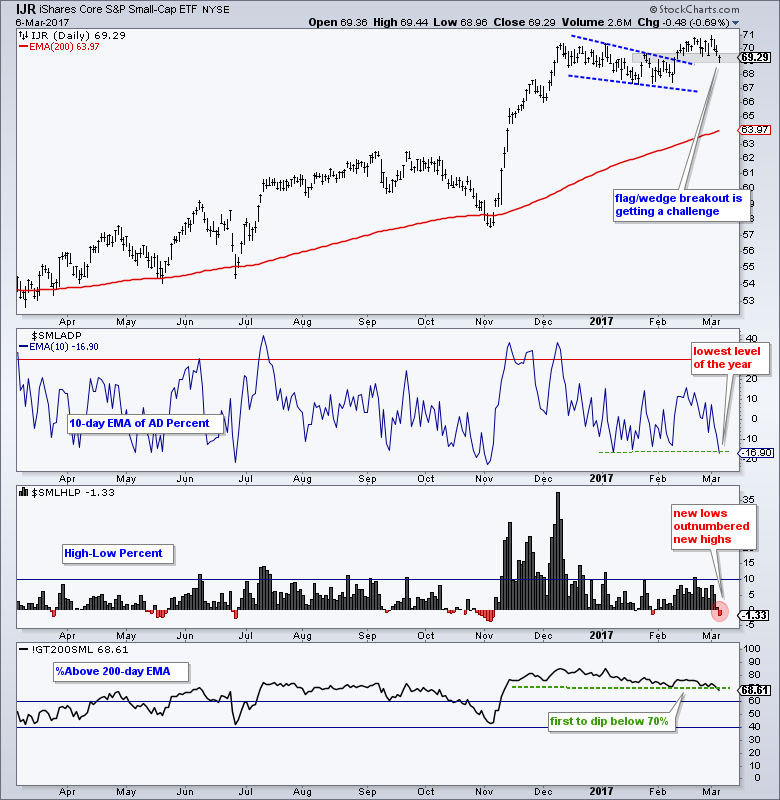
The 10-day EMA of AD Percent ($SMLADP) dipped to its lowest level of the year (-16.9%). High-Low Percent ($SMLHLP) turned negative for the third time this year as new lows outnumbered new highs. The Small-Cap %Above 200-day EMA (!GT200SML) dipped below 70% for the first time since mid November. On the price chart, IJR is testing the flag/wedge breakout zone and a close below 69 would call for a re-evaluation of the breakout.
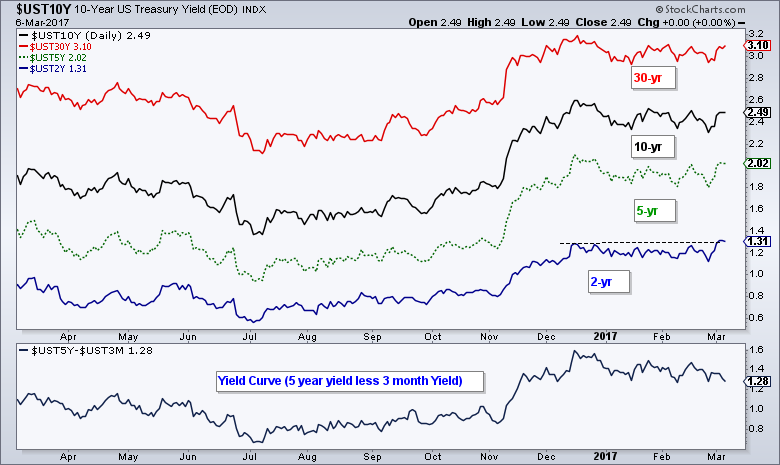
TLT Tests Support and 2-yr Yields Hits 52-week High
Before getting too bearish, keep in mind that SPY, QQQ and IJR are within spitting distance of 52-week highs. And, all three hit new highs just four days ago. IJR, of course, has the furthest to spit because it is 2.4% below its 52-week high. At the risk of playing into this week's events, namely Friday's employment report, I think we should focus on the bond market for clues on stocks. The chart below shows the 2-yr T-Yield ($UST2Y) hitting a 52-week high last week and this means short-term yields are pricing in Feb hikes.
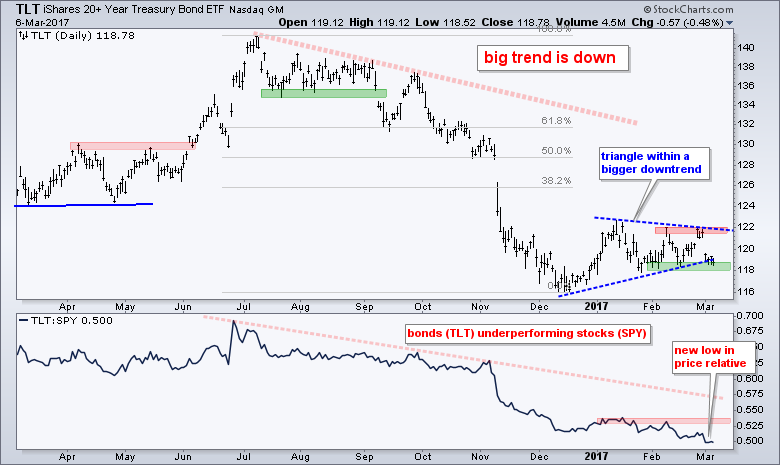
The next chart shows the 20+ YR T-Bond ETF (TLT) testing support in the 118 area. The long-term trend is down and a support break would signal a continuation lower. A breakdown in bonds could free up money for stocks and extend the rally in the stock market. Alternatively, we could see a correction in stocks if TLT holds support and bounces off the February lows.
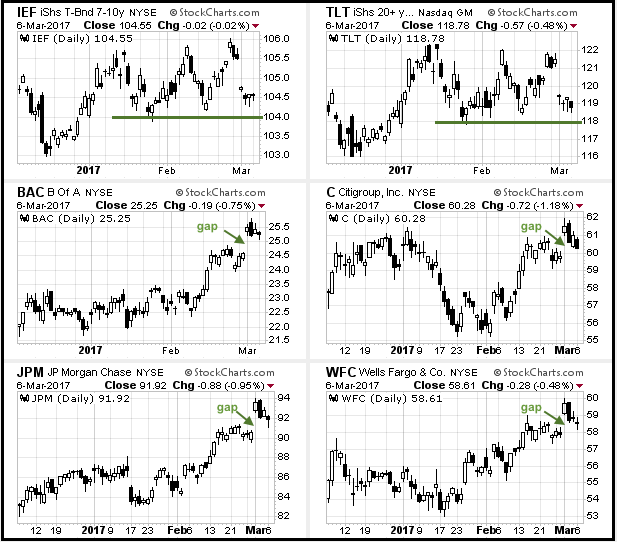
Mind the Gaps in These 4 Bank Stocks
The CandleGlance chart below shows the 20+ YR T-Bond ETF (TLT) and 7-10 YR T-Bond ETF (IEF) along with four big banks. Notice that these four stocks surged when the Treasury bond ETFs fell last week. BAC, C, JPM and WFC gapped up when TLT and IEF gapped down, and these gaps are holding for now. The banking stocks would likely fill these gaps if TLT and IEF bounce off their February lows.
The charts and commentary from the Weekly Market Review & Outlook are still valid. I covered the major index ETFs (SPY, QQQ, IJR), the nine sector SPDRs and the intermarket charts (TLT, USO, GLD, UUP). Also note that the Art's Charts ChartList was updated on Saturday with 30 annotated ETF charts.
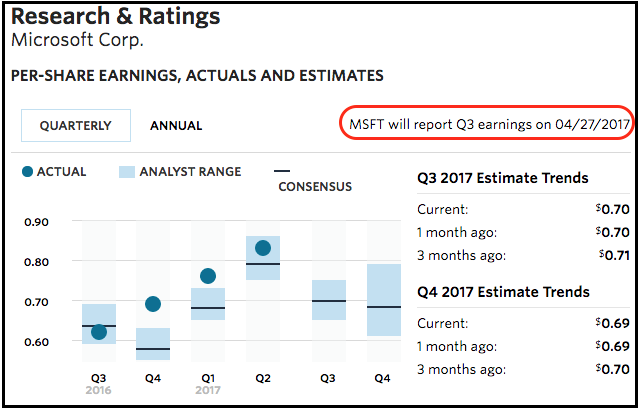
Where to Check Earnings and News
I check the earnings date for a stock because I do not want to initiate a new trade too close to an earnings report. "Too close" for me is two weeks. I have found the good old Wall Street Journal website quite good for general information and an earnings date. The link below is for Microsoft and you can find the earnings date mid way down the page. I also check recent news, but I do not look at the funnymentals or analyst estimates. The price chart is usually all I need.
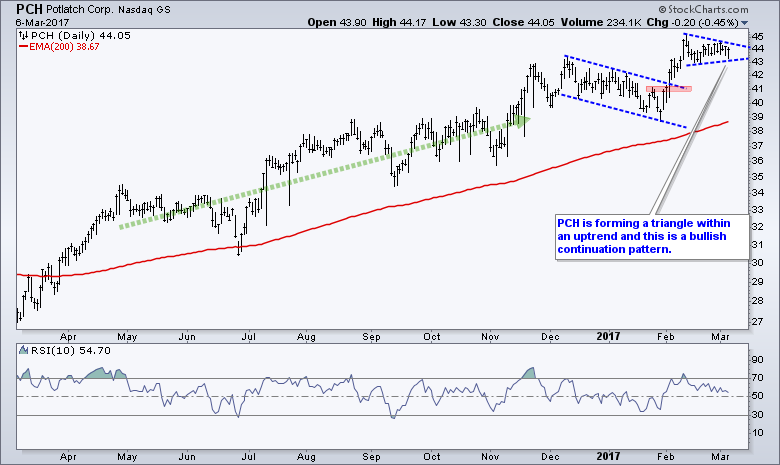
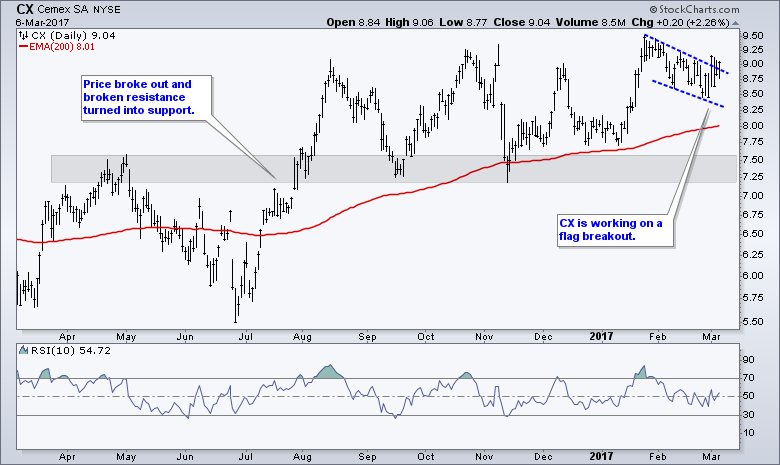
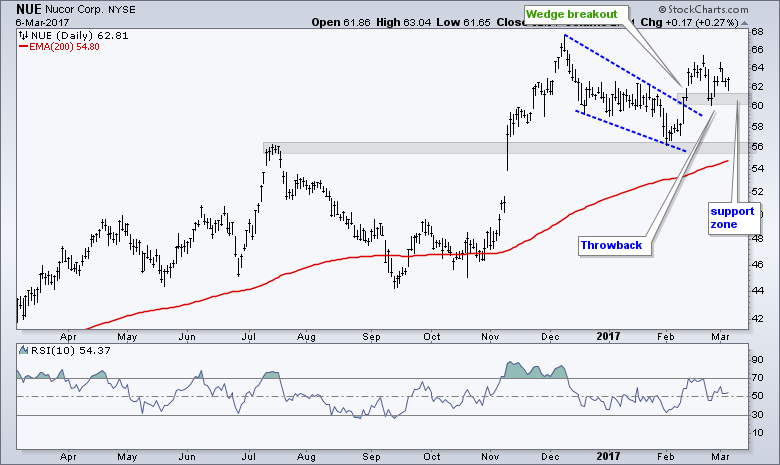
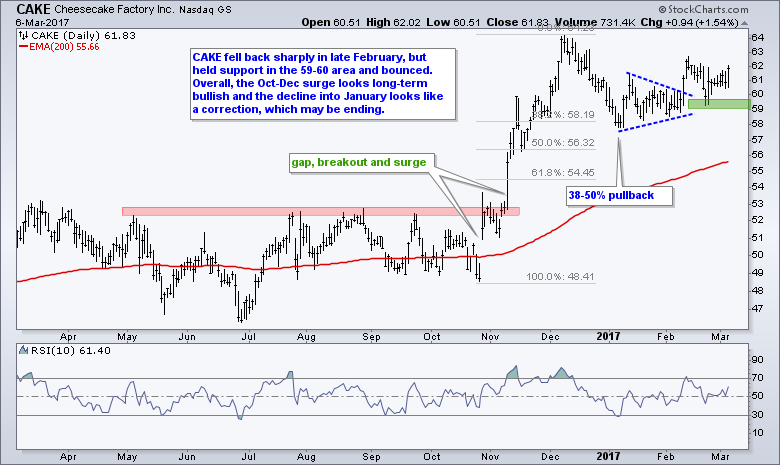
12 Stocks with Bullish Charts
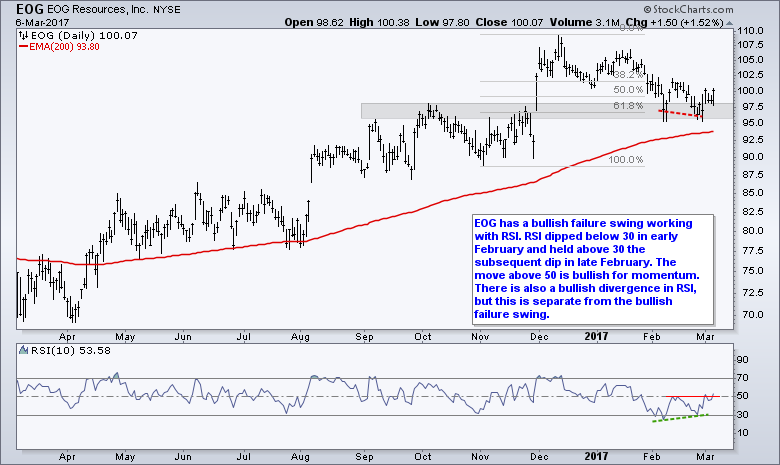
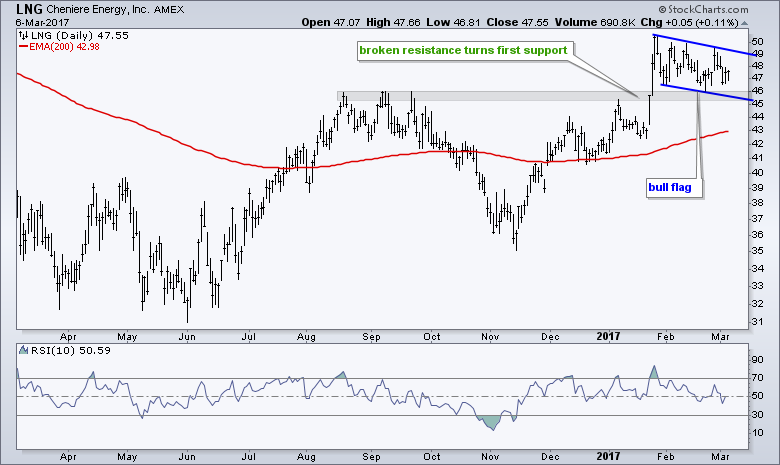
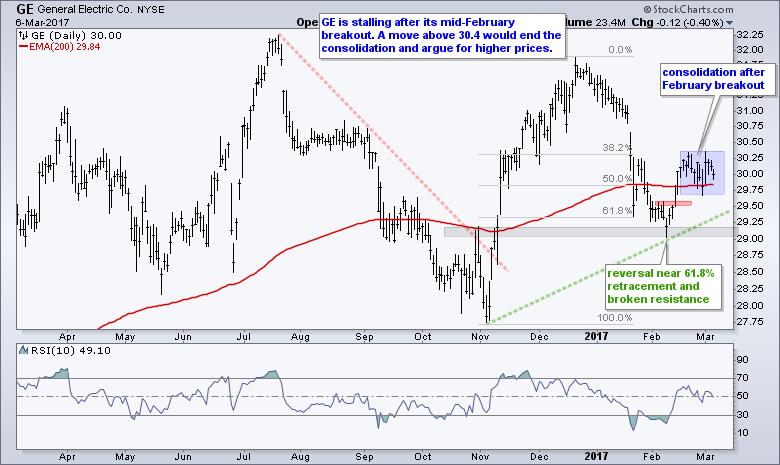
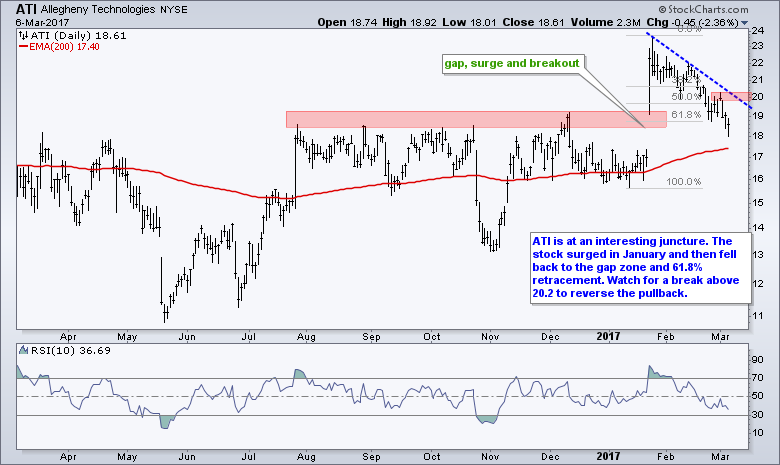
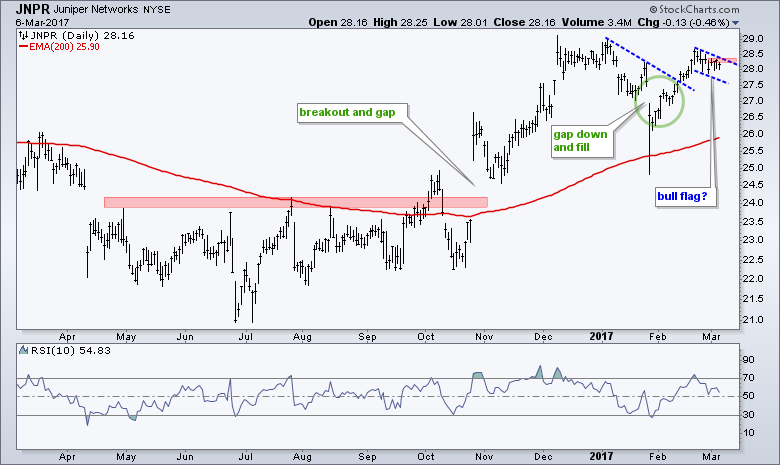
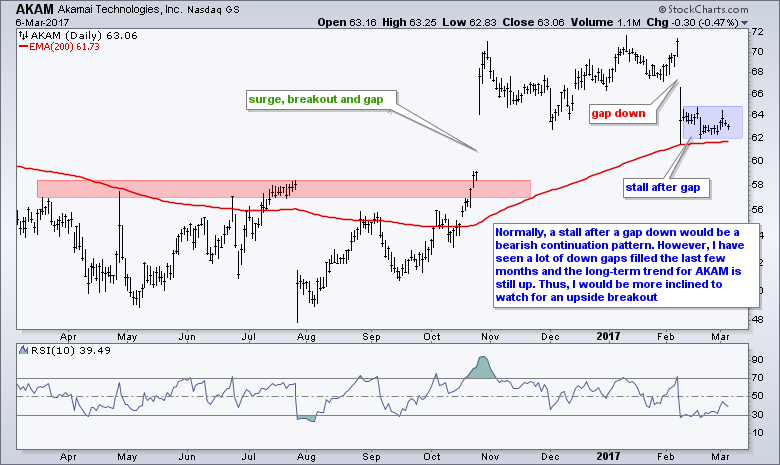
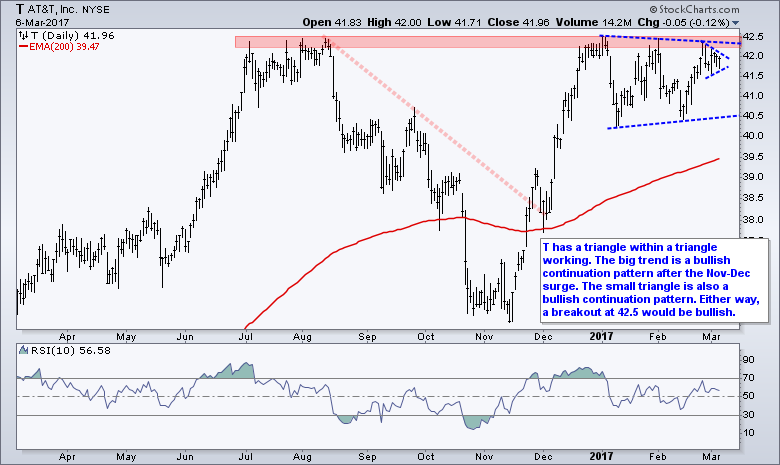
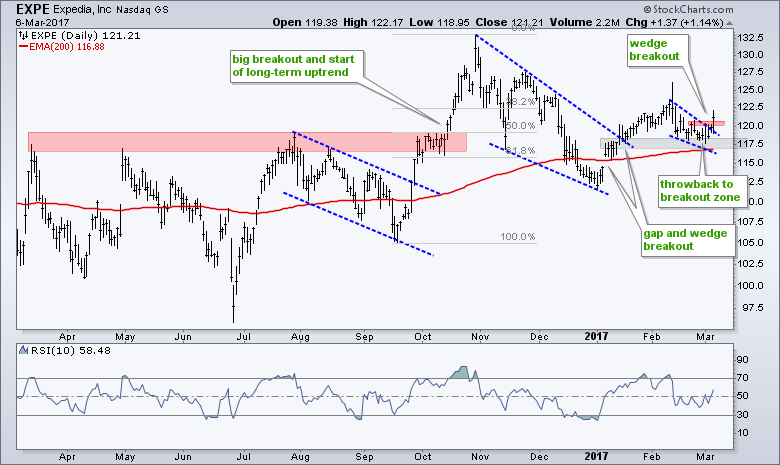
The next stocks are in long-term uptrends and have "potentially" bullish setups working. They are in long-term uptrends because the 50-day EMAs are above the 200-day EMAs and the closing prices are above the 200-day EMAs. Even though the stock market seems overbought and ripe for a pullback, we are in a bull market and this means I still favor bullish setups over bearish setups. Some of these setups will fail and some will succeed. Trading losses are inevitable and should be treated as the cost of doing business (expenses). The goal is to win more than you lose. And remember, plan your trade first and then trade according to that plan. Plan your entry, potential exit and stop-loss before entering the trade.
Order of Appearance: PCN, CX, NUE, EOG, LNG,
GE, ATI, JNPR, AKAM, T, EXPE, CAKE
******************************************************
Spotting Pullbacks and Upturns within an Uptrend using RSI and MACD Histogram.
Difference between EMA and SMA - Using %Above 200-day EMA for Breadth Analysis.
Backtesting Different Moving Average Pairs with SPY, QQQ and IWM.
ETF Master ChartPack - 300+ ETFs organized in a Master ChartList and in individual groups.
Follow me on Twitter @arthurhill - Keep up with my 140 character commentaries.
****************************************
Thanks for tuning in and have a good day!
--Arthur Hill CMT
Plan your Trade and Trade your Plan
*****************************************


