----- Video Link ----- Art's Charts ChartList (updated 4-Mar) -----
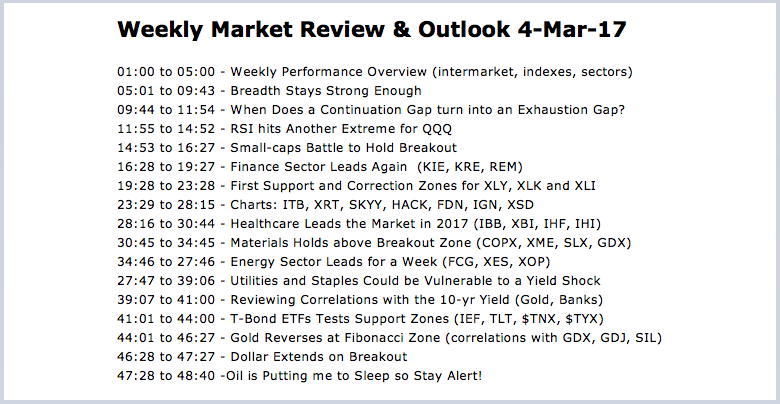
Weekly Market Review & Outlook 4-Mar-17
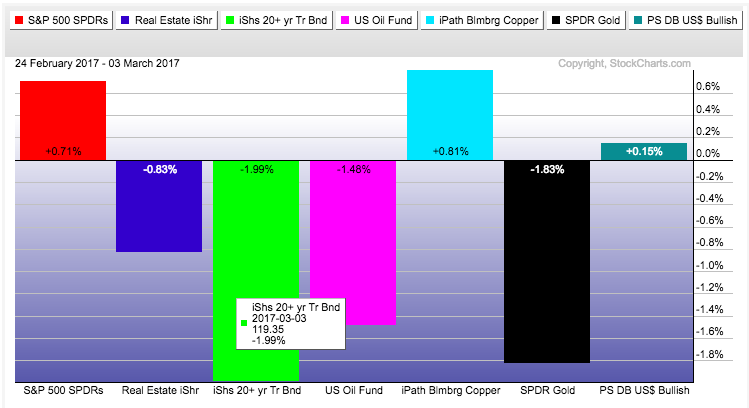
Financials, healthcare and energy stocks led the stock market higher this week with the S&P 500 SPDR, Nasdaq 100 ETF and S&P MidCap SPDR hitting new highs. The S&P SmallCap iShares and Russell 2000 iShares are still struggling, but the majority (50+ percent) of the market is not struggling and this keeps the bull going. The 10-yr Yield and the Finance sector moved sharply higher this week and these two could hold the key to the stock market in the coming days and weeks. The Treasury Bond ETFs are on the verge of breakdowns and further weakness in bonds could provide fuel for the stock market. In other words, a breakdown in bonds could signal further upside for a market that already seems extended. (Note: the Art's Charts ChartList contains 30 industry group ETF charts with annotations and comments.
Breadth Stays Strong Enough
The best way to measure the stock market is with a basic chart for the S&P 500 SPDR (SPY) and the breadth indicators for the S&P 1500. The long-term trend for SPY is up when the 50-day EMA is above the 200-day EMA. When the long-term trend for SPY is up, this means the long-term trends for the S&P SmallCap iShares (IJR), Nasdaq 100 ETF (QQQ) and S&P MidCap SPDR (MDY) are up. Why? Because the S&P 500 is THE market benchmark and the other three ETFs are highly correlated to the S&P 500. The 50-day EMA has been above the 200-day EMA since April 1st and remains above. I would not best against stocks when the S&P 500 is in a long-term uptrend.
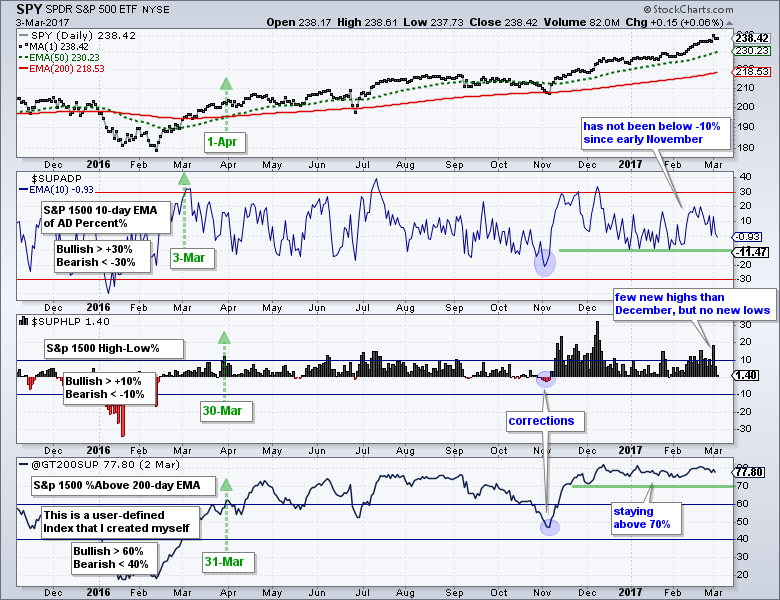
There are links at the end of this section explaining these indicators. The breadth indicators have been net bullish since March 30th, which is when two of the three triggered bullish signals (green arrows). All three were bullish when the Percent above 200-day EMA triggered bullish on March 31th. I will consider this a bull market until we see a bearish EMA cross in SPY and two of the three breadth indicators trigger bearish signals. Bearish signals trigger when the 10-day EMA of AD Percent ($SUPADP) moves below -10%, High-Low Percent ($SUPHLP) exceeds below -10% and Percent Above 200-day EMA moves below 40%.
We all want to know when a correction might begin and there are two things to watch on this chart. Notice that the 10-day EMA of AD Percent has not been below -10% since early November. The -11.47% number on the right refers to AD Percent, not its 10-day EMA. A move below -10% would show an uptick in downside participation. Second, I would watch the Percent above 200-day EMA. A move blow 70% would suggest some internal weakening that could give way to a correction. Chartists not wishing to create a user-defined index can watch S&P 500 %Above 200-day EMA (!GT200SPX), Mid-Cap %Above 200-day EMA (!GT200MID) and Small-Cap %Above 200-day EMA (!GT200SML). A correction may start when two of the three move below 70%.
Related Links: How to create a user-defined index (@GT200SUP). Understanding the AD Percent Indicators, High Low Indicators and %Above 200-day EMA Indicators.
When Does a Continuation Gap turn into an Exhaustion Gap?
The S&P 500 SPDR (SPY) raced to another new high this week with a gap-surge on Wednesday - and then gave back half of this gain with a decline on Thursday. The red ovals highlight the last two times the ETF gapped to a new high. The first occurred after a consolidation period and could be considered a breakaway gap. SPY gapped down three days later, but this gap down did not amount to much as the ETF surged over 5% the next four weeks.
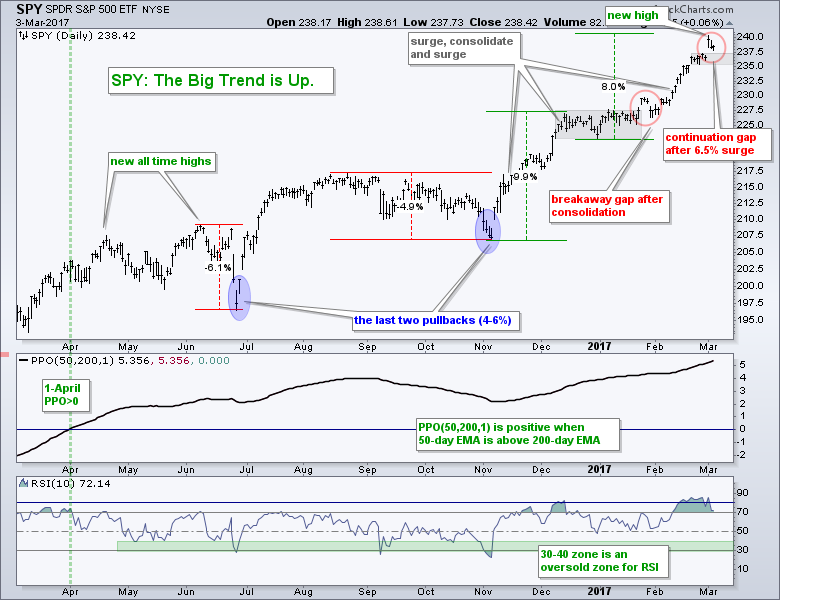
The current gap is a little different because it comes after a big surge and is currently a continuation gap. Continuation gaps occur within a trend and remain unfilled. Exhaustion gaps are gaps within a trend that are filled quite quickly (reversed). This gap could turn into an exhaustion gap, but it is currently a continuation gap. There is a little consolidation in the 235-237 area that can be considered short-term support. I would not consider this an exhaustion gap until SPY closes below 235. Such a move would break short-term support and suggest that the long awaited correction could be starting.
RSI hits Another Extreme for QQQ
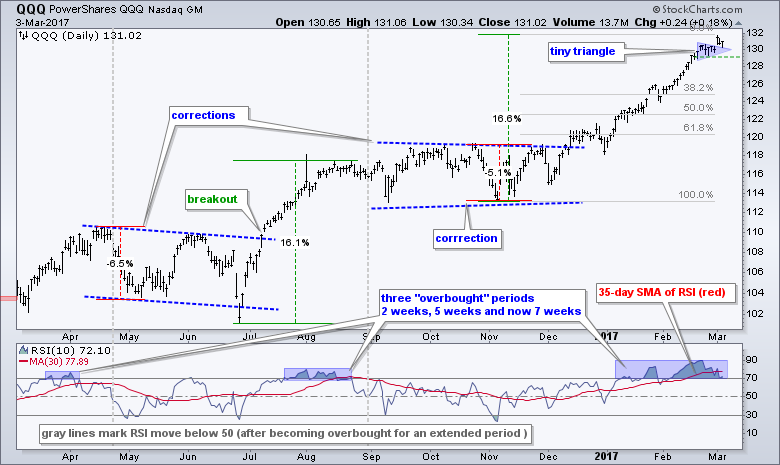
QQQ formed a tiny triangle around 130 and then gapped to another new high. At the risk of getting too short-term oriented, the triangle lows mark first support at 129 and a break here could signal the start of a corrective period. The indicator window shows 10-day RSI extending its overbought run to seven weeks and the 35-day SMA of RSI exceeding 75. These are the highest levels since 23-April-2010 and 1-Mar-2012. QQQ peaked soon after the 2010 extreme and three weeks after the 2012 extreme. I would consider RSI overbought AND bullish as long as it holds above 50. Look for RSI to break below 50 to signal the start of a correction.
Small-caps Battle to Hold Breakout
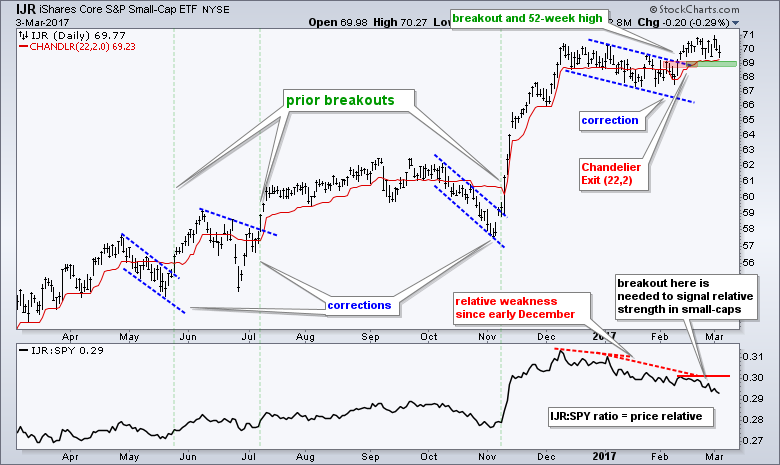
The S&P SmallCap iShares (IJR) may be lagging SPY since December, but it broke out of a bullish continuation pattern and hit a new high in February. The breakout zone around 69 turns into the first are to watch for a failure. Even though the ETF can't seem to stay above 70 for more than a day, I will not call the breakout a failure until IJR closes below 69. The indicator window shows the price relative falling since December. This looks like a correction after a sharp advance. Look for a break above the mid February high to signal a return to relative strength in small-caps.
Finance Sector Leads Again
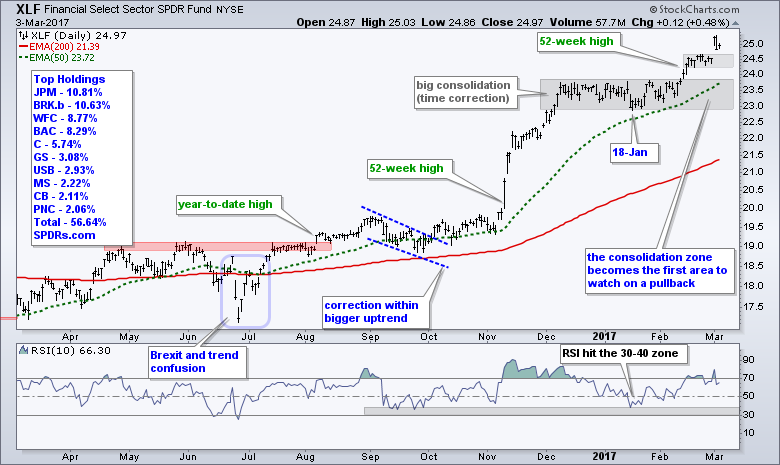
The Finance SPDR (XLF) has been the big story over the last five weeks. The ETF bottomed on 18-Jan, started edging higher and then broke out of a large consolidation in mid February. The ETF formed a small consolidation around 24.3-24.6 and then surged to another new high this week. This small consolidation zone marks the first support area to watch. Even though a break below last week's lows would be negative, it would still be viewed as a pullback within a bigger uptrend. In other words, I would expect support in the 23.5-23.8 area, which marks the top of the big consolidation.
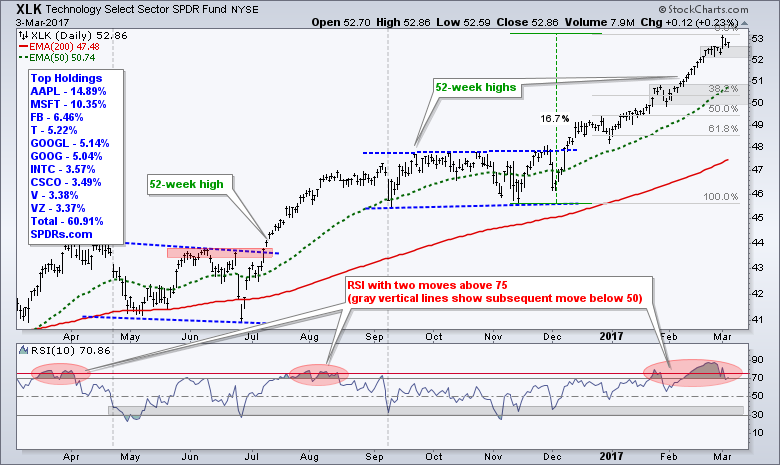
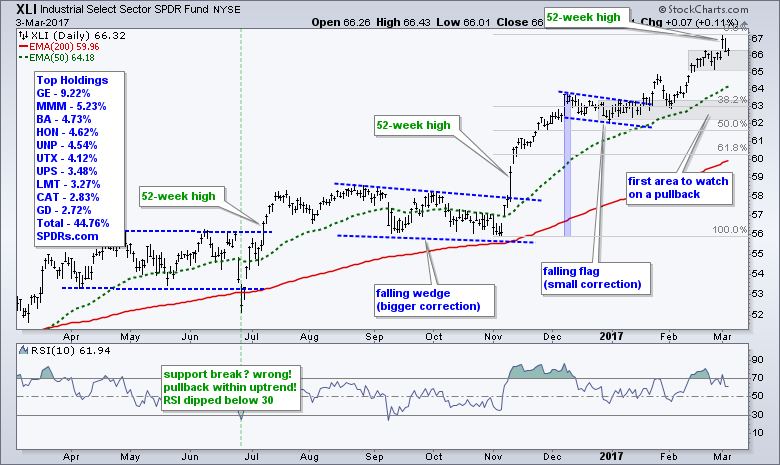
First Support and Correction Zones for XLY, XLK and XLI
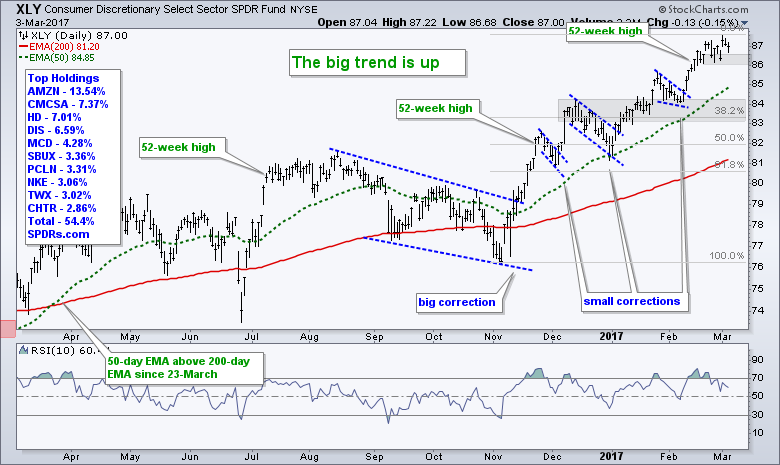
The Industrials SPDR (XLI), Technology SPDR (XLK) and Consumer Discretionary SPDR (XLY) hit new highs again this week. There are two areas to watch on each of these charts. First, all three consolidated last week and then surged to new highs this week. These little consolidation zones mark the first support areas to watch for a potential short-term reversal (correction). Second, each chart shows the Fibonacci Retracements Tool from the November low to the current high. The 38.2% retracement marks the minimum expected on a correction. I added a bigger gray zone around these retracements to mark a correction target zone.
Fibonacci Retracements are Not Science
As noted in Tuesday's commentary with 17 stock setups, measuring retracements is not an exact science. Most of my Fibonacci retracements are measured from the November low to the most recent high. Even though I put these retracements on the charts, we have yet to actually start a correction. Thus, I may be premature and the market could continue higher. The levels on the Fibonacci Retracements Tool are 38.2%, 50% and 61.8%. Charles Dow also suggested that corrections retrace 1/3 to 2/3 of a prior move and 1/2 is the base case. Frankly speaking, we don't know exactly how far a retracement or correction will extend. I usually look for something around 50%, but it can be shorter or longer. The retracement amount is not the signal. It is the setup. In other words, I move to high alert when a retracement nears the 50% area. This means I am on alert for a bullish catalyst or signal that will suggest an end to the correction.
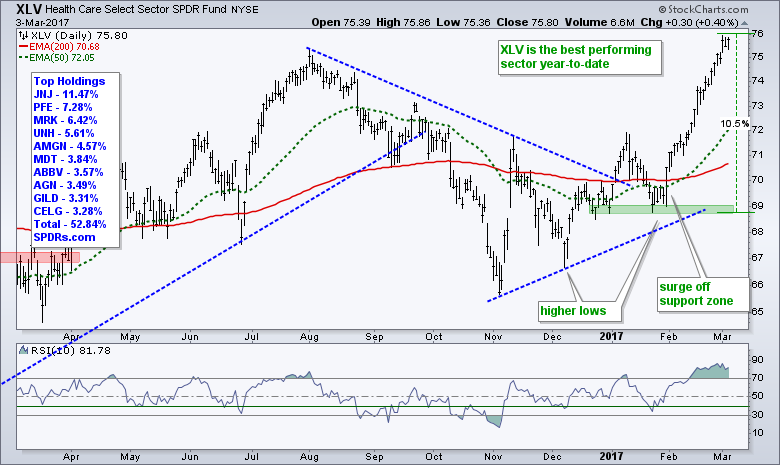
Healthcare Leads the Market in 2017
With a 10% surge in February, the HealthCare SPDR (XLV) is the strongest sector SPDR year-to-date. It certainly looks frothy and extended, but keep in mind that it takes strong buying pressure to become so extended. Also notice that XLV joined the new high parade this week and 35% of the stocks in the sector hit new highs this week. The four healthcare-related ETFs (IBB, XBI, IHI and IHF) also hit new highs. There is clearly broad strength within the sector and chartist should keep these ETFs on their radars for pullbacks and bullish setups in the coming weeks.
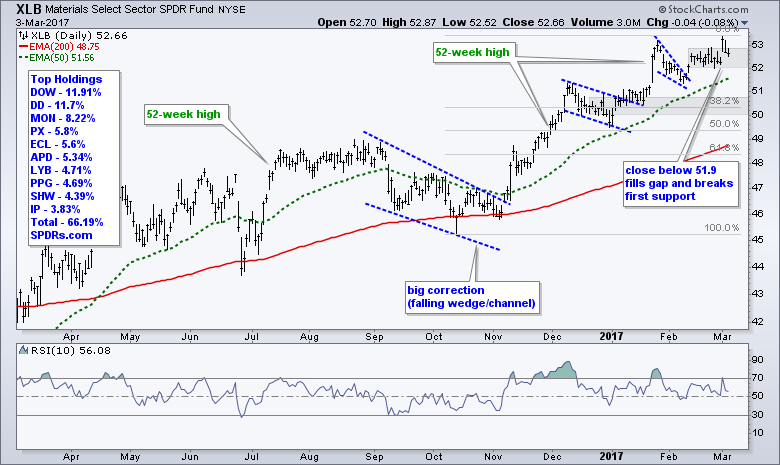
The Materials SPDR (XLB) stalled around 52-53 for two weeks (gray area) and then broke out with a new high on Wednesday. The ETF fell back after the gap breakout and the consolidation lows mark the first support level. A break below 52 would be short-term negative and argue for a correction within the bigger uptrend. The 38.2% Fibonacci Retracement and early January breakout zone mark the first pullback target around 50.
Energy Sector Leads for a Week
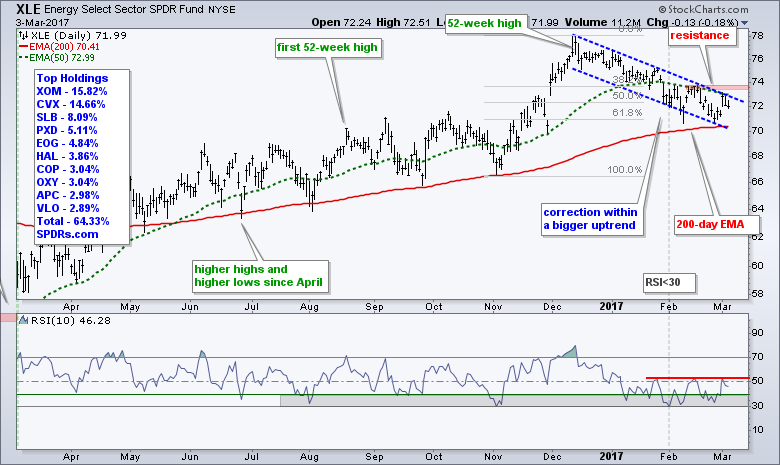
Yes, you read right! The Energy SPDR (XLE) scored the second biggest gain this week with a 1.41% gain. The overall picture, however, remains the same. XLE is in a long-term uptrend and a short-term downtrend, which may not be a medium-term downtrend. Regardless of the length, the overall structure of the chart looks bullish because I see higher highs and higher lows over the past year, a 52-week high and a pullback to the rising 200-day EMA. This pullback is wearing out its welcome, but keep in mind that the market is here to frustrate traders - not appease! In any case, look for a breakout at 74 to officially reverse this slide.
Utilities and Staples Could be Vulnerable to a Yield Shock
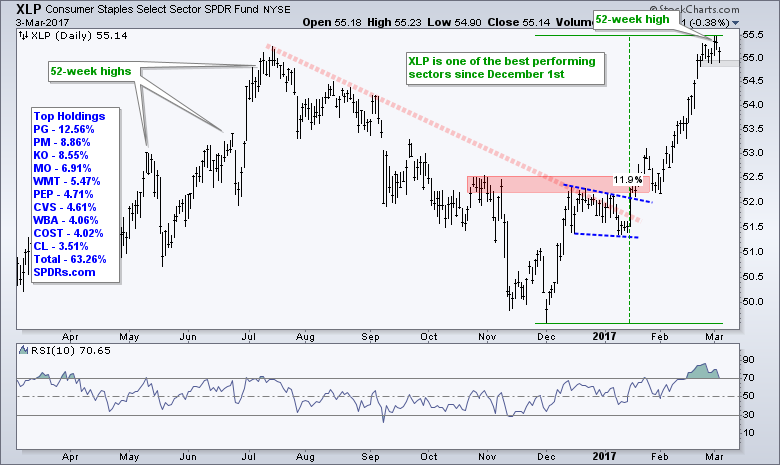
I admit that I am still perplexed by the strength in the Consumer Staples SPDR (XLP) and Utilities SPDR (XLU) because we are in a bull market and the 10-yr T-Yield ($TNX) is in a long-term uptrend. These sectors may have bullish charts, but they are still not my preferred sectors. XLP surged over 10% in three months and hit a new high this week. It's been a moonshot since mid January and the ETF is quite overbought.
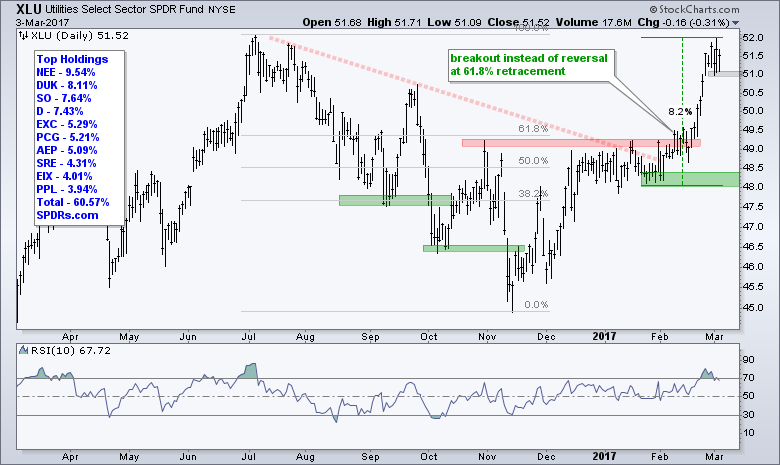
XLU had its moonshot in February, but that could get derailed with a breakout in the 10-yr T-Yield ($TNX). XLU surged around 8% in five weeks and reached the July high. Trading turned quite choppy the last five days and this could mark some sort of short-term top. Watch for a break below last week's low to signal the start of a correction. And watch the 10-yr Yield.
Reviewing Correlations with the 10-yr Yield
The 10-yr Yield turned up sharply this week so now is a good time to review the correlations. The chart below shows the Correlation Coefficient for the 10-yr T-Yield ($UST10Y) and seven other ETFs. This is a weekly chart with a 13-week Correlation Coefficient in black and the 13-week SMA in red, green or blue for smoothing. Keep in mind that I am not looking for signals. Instead, I am just trying to get a general idea of the relationship at work. The Finance SPDR (XLF) and Regional Bank SPDR (KRE) are positively correlated to the 10-yr yield, which means than tend to move in the same direction.
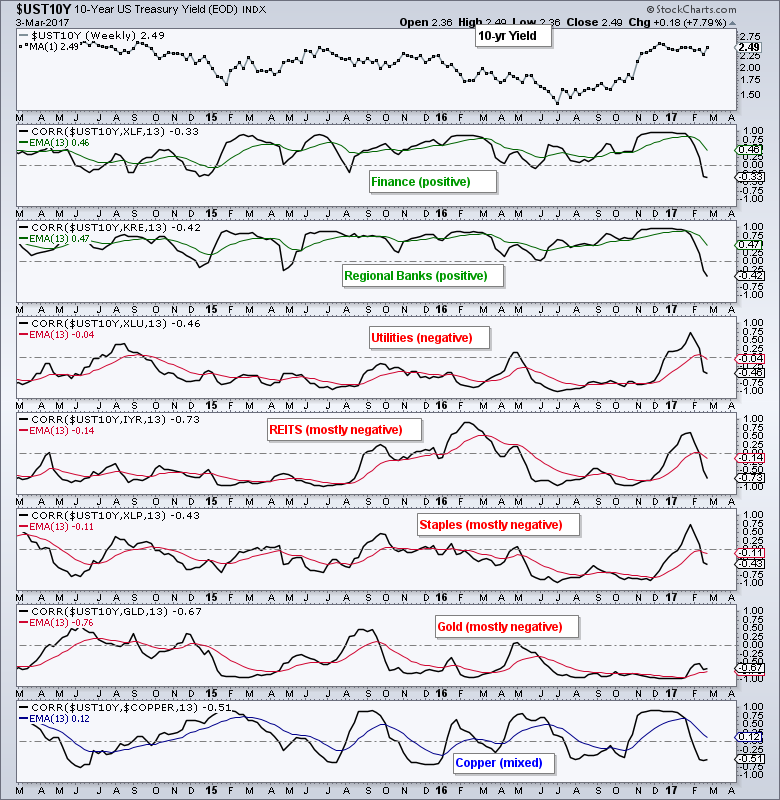
The Utilities SPDR (XLU), REIT iShares (IYR) and Consumer Staples SPDR (XLP) are negatively correlated for the most part. Utilities and REITs are sensitive to interest rates and typically fall when rates rise. The Gold SPDR (GLD) is also negatively correlated to the 10-yr yield. Copper ($COPPER) seems to move between positive and negative correlation.
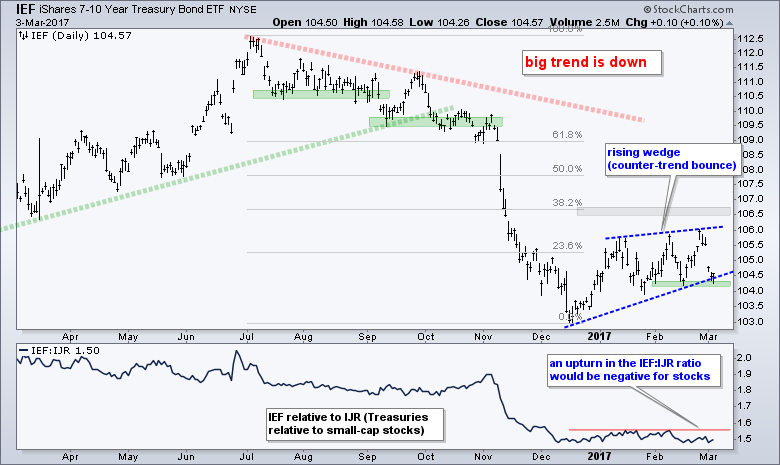
T-Bond ETFs Tests Support Zones
The 7-10 YR T-Bond ETF (IEF) and the 20+ YR T-Bond ETF (TLT) fell sharply this week and both are testing their February lows. First and foremost, the long-term trends are down for both ETFs. This means the rising wedge in IEF is a counter-trend bounce and the triangle in TLT is a consolidation within a bigger downtrend, both of which are bearish continuation patterns. Support breaks would signal a continuation of the bigger downtrend and this would mean money is moving out of safe-haven Treasuries. This money has to go somewhere and could just find its way into stocks. They have yet to break support and trading has been a choppy mess in 2017. I think the odds favor support breaks at some point because of long-term trends are down.
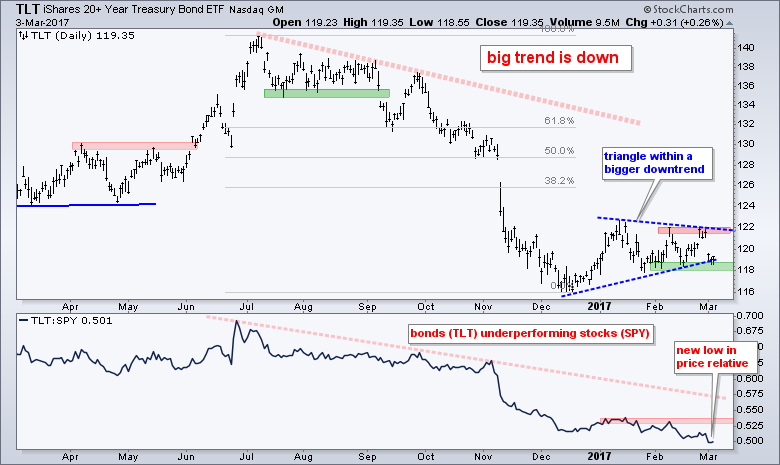 The indicator window on the chart above shows the TLT:SPY ratio moving to a new low this week. This means TLT is underperforming SPY and this is net bullish for stocks.
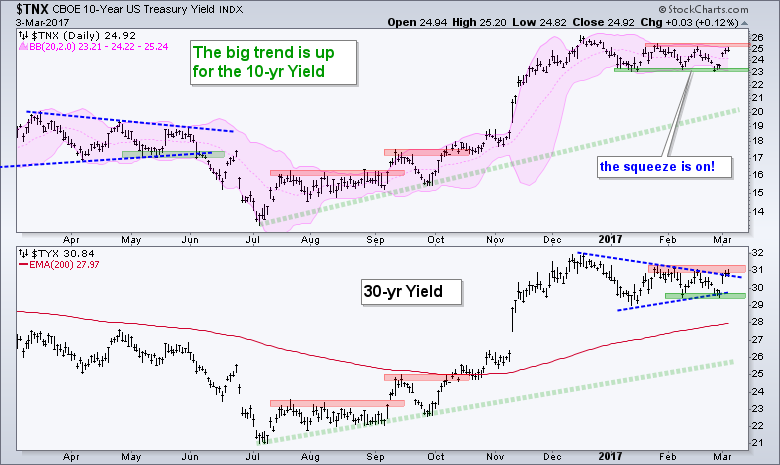
Bollinger Band Squeeze Hits the 10-yr
The 10-yr T-Yield ($TNX) and the 30-yr T-Yield ($TYX) are both challenging the February highs and upside breakouts would signal a continuation of the prior advance (October to December). This would target a move to 3% in the 10-yr and 4% in the 30-yr (2013 highs). A breakout in Treasury yields would be a vote of confidence in the economy and or a signal that inflation is picking up, or a little of both. You can also see the Bollinger Band squeeze in the 10-yr Yield. This shows a volatility contraction and suggests that we should prepare for a volatility expansion (big move).
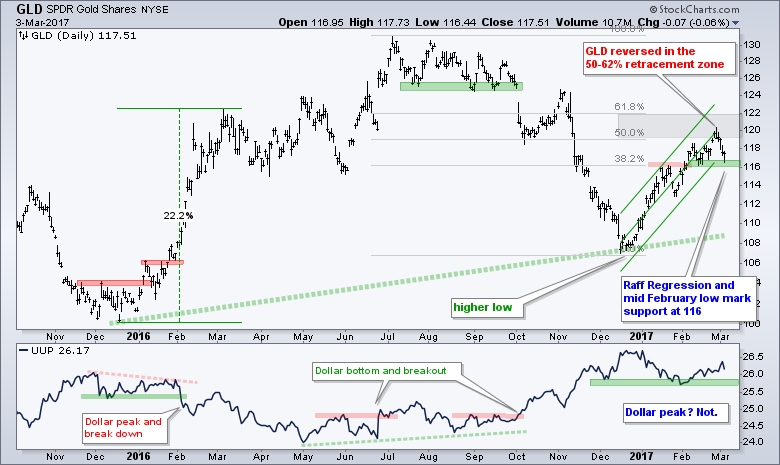
Gold Reverses at Fibonacci Zone
Looks like I should have waited a week before re-drawing my gold chart! Gold got the double whammy this week as the Dollar bounced and the 10-yr yield surged. Gold is negatively correlated to both. On the price chart, GLD reversed in the 50-61.8% retracement zone and it is still possible that the 2017 surge was a bear market rally. This rally, however, is not over just yet. I am using a Raff Regression Channel to define the uptrend since December because this move is too steep for a trend line. The lower line and mid February low mark support at 116, a break of which would reverse the immediate uptrend.
 I will feature the Gold Miners ETF (GDX) chart, but I think this is redundant because GDX is totally dependent on gold, which is dependent on the Dollar and the 10-yr Yield. Even though GDX reversed near the 50% retracement in mid February and fell sharply the last two weeks, it is now short-term oversold and trading in the 50-62% retracement zone. GLD is at support and a bounce in gold could give way to a bounce in GDX.
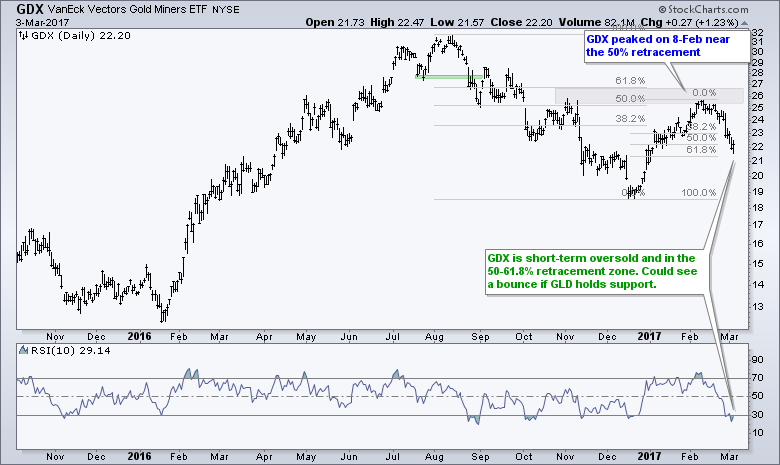 The chart below shows the Correlation Coefficients for gold and four ETFs: Gold Miners ETF (GDX), Gold Miners Junior ETF (GDXJ), Silver Miners ETF (SIL) and Silver ETF (SLV). All have strong positive correlations to gold and move in the same direction as gold. Traders can use these ETFs to get more leverage to gold, but directional moves will not be different.
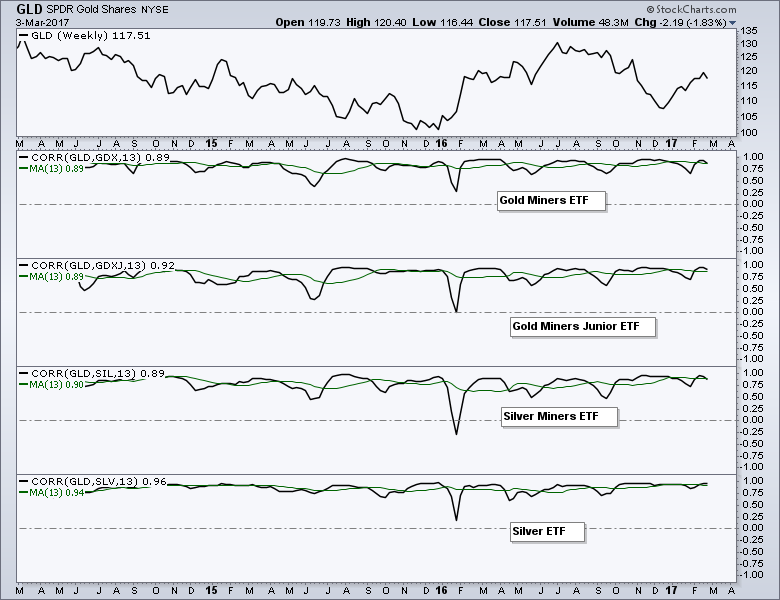
Dollar Holds Breakout
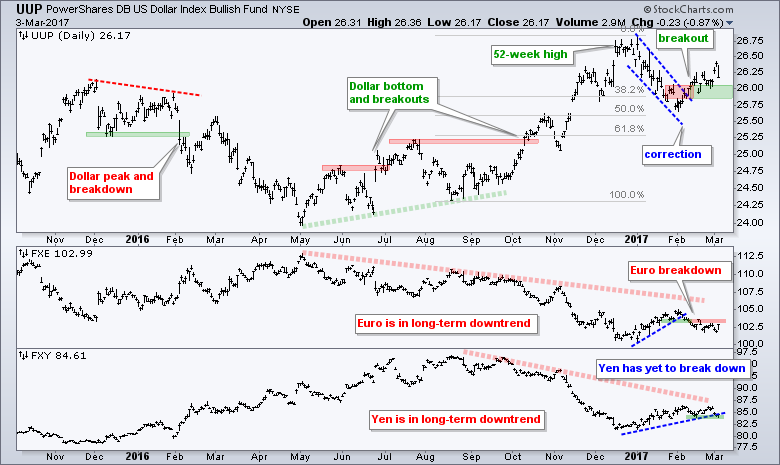
The US Dollar ETF (UUP) hit a 52-week high in December, corrected into early February and broke out in mid February. There was some backing and filling in the 26 area, but the breakout held for the most part and the Dollar bounced this week. I will leave support at 25.80 and remain bullish as long as this level holds.
Oil is Putting me to Sleep so Stay Alert!
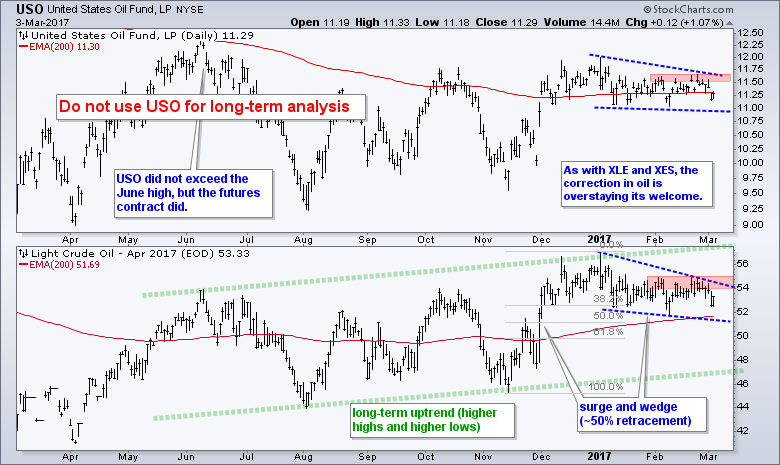
There is nothing new to report on oil as April Crude (!CLJ17) remains stuck in a rut. The big trend is up (rising channel) and the little trend is down (falling wedge). The big trend is, well, bigger than the little trend and remains the dominant force at work. The falling wedge is also typical for a correction. There is no rule on how long a wedge can extend, but I have yet to see any price action that would negate the wedge, such as a plunge below 51. Watch for a break above 55 to reverse the little downtrend and signal a continuation of the bigger uptrend.
******************************************************
Spotting Pullbacks and Upturns within an Uptrend using RSI and MACD Histogram.
Difference between EMA and SMA - Using %Above 200-day EMA for Breadth Analysis.
Backtesting Different Moving Average Pairs with SPY, QQQ and IWM.
ETF Master ChartPack - 300+ ETFs organized in a Master ChartList and in individual groups.
Follow me on Twitter @arthurhill - Keep up with my 140 character commentaries.
****************************************
Thanks for tuning in and have a good day!
--Arthur Hill CMT
Plan your Trade and Trade your Plan
*****************************************


