
.... Filtering out PPO Signals
.... MACD versus the Percentage Price Oscillator
.... Testing Signal Line Crossovers
.... Adding Some Filters to the PPO Signals
.... Adding Focus to the Portfolio
.... Conclusions - Caveat Emptor! ....
This System Trader article is a follow up to my ChartWatchers post on MACD. I will test the Percentage Price Oscillator (PPO) based on the theories put forth in that article. Note that the PPO is just a percentage version of MACD. Using stocks from the S&P 100, I will first test basic signal line crossover signals and signals with different filters. I will then turn to the S&P 500 and test signals with a more focused portfolio.
MACD versus the Percentage Price Oscillator
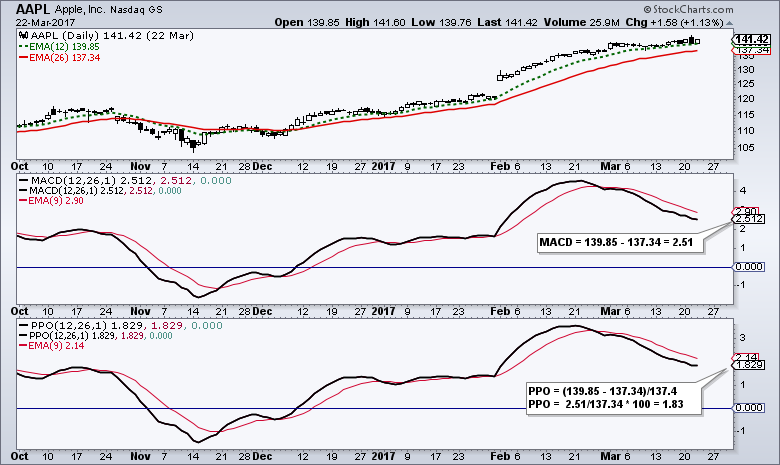
I am using the PPO instead of MACD because we can compare PPO values across charts. MACD is the absolute difference between two exponential moving averages (12-day EMA less the 26-day EMA). The PPO is the percentage difference between the two EMAs (12-day EMA - 26-day EMA)/26-day EMA)). The first chart shows AAPL with MACD at 2.51 and the PPO at 1.83%. MACD means the 12-day EMA is 2.51 points above the 26-day EMA. The PPO means the 12-day EME is 1.83% higher than the 26-day EMA.
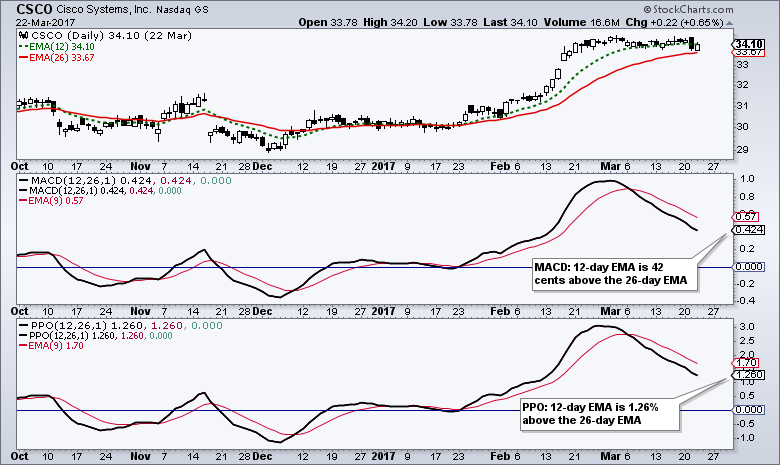
The second chart shows CSCO with MACD at .424 and the PPO at 1.26%. MACD for CSCO is much smaller than MACD for AAPL because of the large price difference between the two stocks. Cisco trades at around $34 and Apple trades at around 142, which is over 4 times the price of Cisco. Chartists wanting to compare momentum in these two stocks need to use the PPO because it shows the difference as a percentage of the 26-day EMA.
 Chartists can read more about MACD and the Percentage Price Oscillator (PPO) in our ChartSchool. You can also read the MACD article here (Ignoring Signals is the First Step to Taking Signals).
Testing Signal Line Crossovers
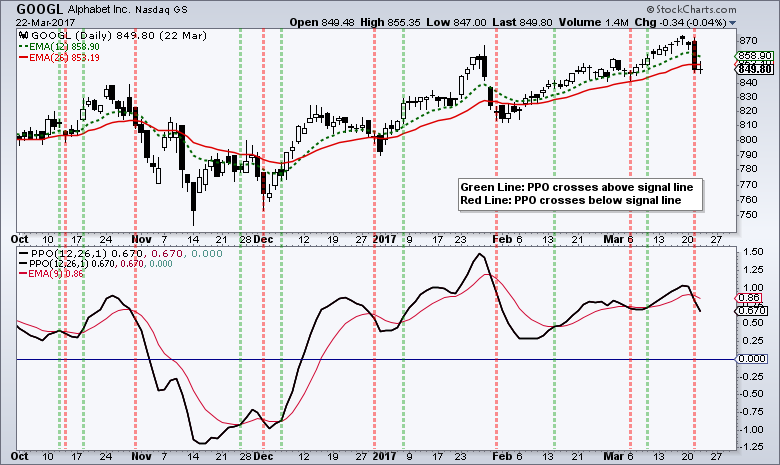
The first test is for the basic signal line crossover. Buy when the PPO crosses above its signal line and sell when the PPO crosses below its signal line. I am using the standard Percentage Price Oscillator (12,26,9) and the signal line is the 9-day EMA of the PPO. Note that the SharpChart shows the PPO(12,26,1) and I added a 9-day EMA using the advanced indicator options. The chart below shows Google with over a dozen signal line crosses in just a six month period.
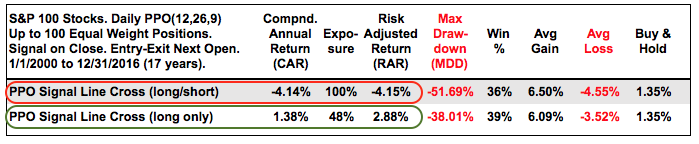
To test the basic effectiveness of these crosses, I am going to test every stock in the S&P 100. In other words, the system will take every signal in early stock over the past 17 years. Note that I am testing with historical constituents and using dividend-adjusted data. Also note that these tests are designed to see if there is a positive expectancy with signal line crossovers. The size of the portfolio (100,000) and commissions (0) are not important for this exercise.
As the table below shows, the long-short portfolio lost around 4% per year with a Maximum Drawdown of -51.7%. The long-only portfolio gained 1.38% per year with a Maximum Drawdown of -38%. This edged out buy-and-hold for the S&P 100, which had a Compound Annual Return of 1.35% and a Maximum Drawdown of -61%. Bottom Line: Short positions do not help and long-only crossover signals have a positive expectancy (positive Compound Annual Return).
Adding Some Filters to the PPO Signals
In the article on MACD signals, I suggested that we can improve our results by filtering signals. In particular, chartists can improve their odds by using a broad market filter and waiting for the PPO to dip below 1. Chartists can also reduce drawdowns by requiring the stock to be above its 200-day EMA (long-term uptrend).
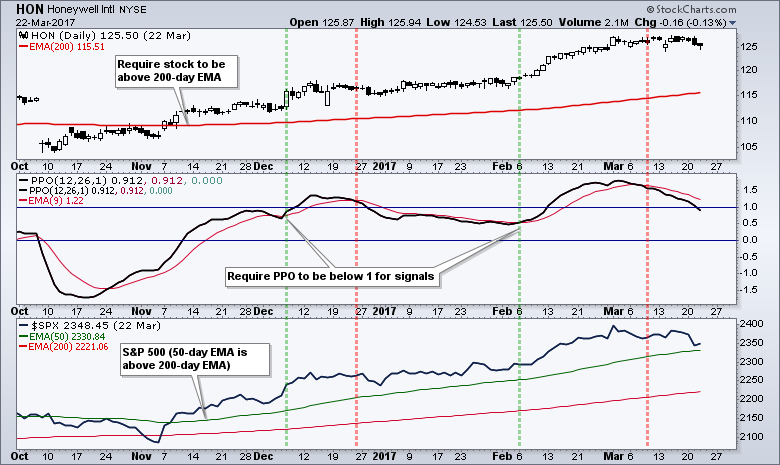
The chart below shows Honeywell (HON) with a bullish market filter, a bullish trend filter and a PPO pullback. The market filter is bullish because the 50-day EMA is above the 200-day EMA for the S&P 500. The trend filter is bullish because HON has been above its 200-day EMA since the second week of November. The PPO dipped below 1 twice for setups and the moved above its signal line for signals.
The table below shows results as each filter is added. Again, this is not a trading system. I am just testing different filters on a basket of stocks to see if they added value. The Compound Annual Return improved as I added the S&P 500 trend filter and required the PPO to be below 1. The Compound Annual Return declined when I added the trend filter for the stock, but the Maximum Drawdown decreased significantly. Notice that the MDD went from 12% to 5%.
Adding Focus to the Portfolio
The next step is to broaden the tradable universe and add a momentum ranking to narrow the selection. The next backtest expands to the S&P 500 and reduces the portfolio to 20 stocks (equally weighted). The market trend filter using the S&P 500 remains in place (50-day EMA above 200-day EMA), as does the stock trend filter (Close>200-day EMA).
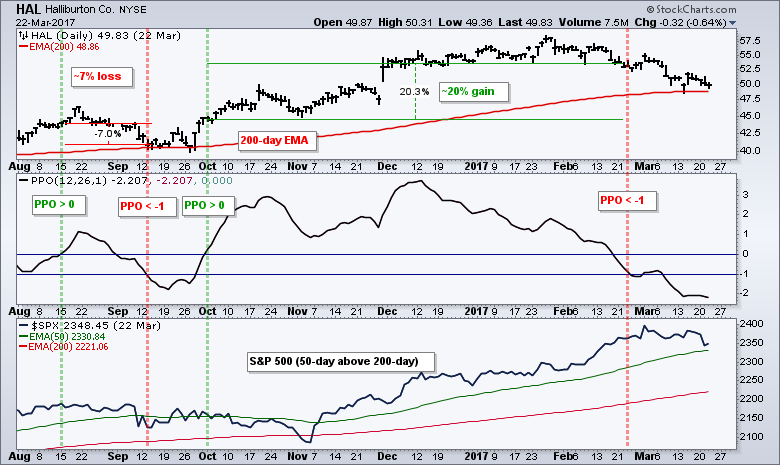
The first test uses the PPO signal line. Buy when the PPO is below 1 and crosses above the signal line. Sell when the PPO moves below the signal line. This signal was shown in the Honeywell example above. The second test buys when the PPO crosses above the zero line (centerline) and sells when the PPO crosses below -1. This is like a moving average crossover system. Buy when the 12-day EMA crosses above the 26-day EMA (PPO>0) and sell when the 12-day EMA is more than 1% below the 26-day EMA (PPO<-1). Setting the signal just below the zero line is like adding a percent cross filter to a moving average crossover. The example below shows Halliburton (HAL) with a losing trade and a winning trade.
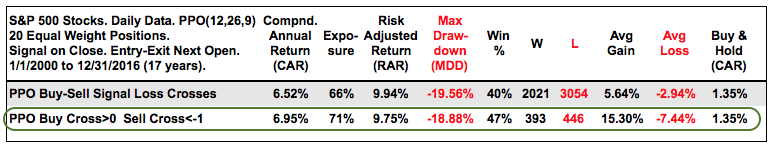
The table below shows the backtest results for the two systems. When there were too many signals, I used the 125-day Rate-of-Change as a filter. The stocks with the highest Rate-of-Change were chosen. The PPO Centerline cross is clearly better than the PPO signal line cross. The Compound Annual Return is slightly higher, the Maximum Drawdown is slightly lower and the average gain is twice the average loss. Also notice that there were a lot fewer trades, the exposure was higher and the Win% was the highest of all the tests.
Conclusions - Caveat Emptor!
MACD and the PPO generate a lot of signals and it is important to qualify these signals. Chartists need to learn which signals to ignore and which to consider. I was impressed with the last system test that used the zero line cross to generate buy signals. The signal line crossover systems generated too many signals and do not seem to be worth the effort.
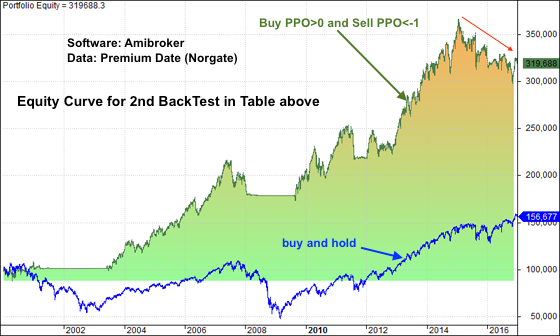
Note that the last two systems are in drawdown mode because the equity curve peaked at the beginning of 2015. This means the systems have not performed well the last two years. This is probably due to the choppy market of 2015, the violent rotations within the market and the bifurcation. The image below shows the equity curve for the system using PPO centerline crosses for buy signals.
 Portfolio level backtesting means I am testing a portfolio of stocks. I never know which picks will be winners and which will be losers. These systems are profitable because the profit from the winners exceeds the profit from the losers. Also note that the results are based on taking every trade and sticking to the system, which is harder in real life. And finally, keep in mind that past results do not guarantee future results.
******************************************************
Thanks for tuning in and have a good day!
--Arthur Hill CMT
Plan your Trade and Trade your Plan
******************************************************
Other Articles in the SystemTrader Series:
- Introduction to Key Performance Metrics - Quantifying the Golden Cross for the S&P 500
- Golden Cross and 5 Major Indexes - EMAs versus SMAs - Do Short Positions Add Value?
- Setting up Momentum Scans, Creating ChartLists and Exporting Lists. - Differences in Major Indexes - Do Trend Filters Work?
- MACD Crosses - Rules to Reduce Drawdowns and Increase Gains - Testing PPO Strategy
Follow me on Twitter @arthurhill - Keep up with my 140 character commentaries.


