 |
.... Signs of a Correction Mount .... Broad Market Breadth Deteriorates .... The Art of Fibonacci Applied to SPY .... RSI Breaks below 50 for QQQ .... Mid-caps and Small-caps are Currently Correcting .... Discretionary, Tech and Materials Hold Support .... Staples and Utilities Lead with New Highs .... Finance, Industrials and Healthcare Correct .... Energy Remains the Weakest Link .... Crude Tests Channel Trend Line .... Bonds Extend Consolidation .... Gold Bounces Along with Treasury Bonds .... Dollar Corrects within Uptrend .... Watching the Swings in TLT, GLD and UUP ..... |
Signs of a Correction Mount
The charts in this commentary are discussed in Saturday's video. Stocks were hit hard on Tuesday with the S&P 500 falling 1.24% and the Russell 2000 losing 2.71% on the day. This one-day loss was the biggest since October for the S&P 500 and the biggest since September for the Russell 2000. Downside breadth was incredibly lopsided with broad declines in the finance, technology, industrials and consumer discretionary sectors. Market pundits were waiting for a correction and Tuesday's sharp decline could be the catalyst for this correction.
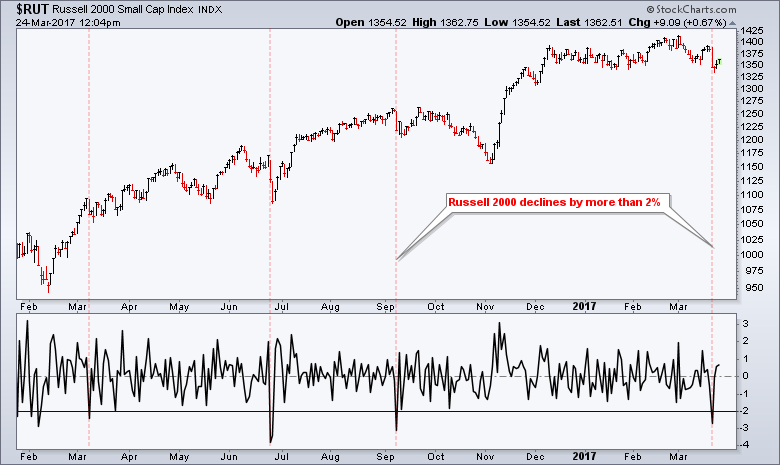
In addition to Tuesday's outsized declined, the S&P 1500 %Above 200-day EMA moved below 70% for the first time since mid December and RSI for QQQ moved below 50 to finally end its overbought run. I do not know how long, how far or what path a correction might take, but I think this week's action was enough to suggest that this correction has started. This is an important assumption because it assumes that most stocks will decline in the coming weeks. See my post on Wednesday more chart and indicators related to Tuesday's decline.
Programming Note: I will post the Weekly Review & Outlook Video tomorrow. This video will cover everything in this commentary, plus a weekly performance review and over 20 industry group ETF charts.
Broad Market Breadth Deteriorates
In Wednesday's commentary, I noted a sharp increase in selling pressure on Tuesday as S&P 1500 AD Percent ($SUPADP) plunged below -75%. Over 95% of stocks in XLF, XLI and XLK declined on Tuesday. This represents a downside breadth thrust and could signal the start of a correction. Also notice that S&P 400 High-Low% ($MIDHLP) turned negative on Wednesday as new lows outpaced new highs for the first time since November.
The chart below shows the three breadth indicators for the S&P 1500. They remain on bull signals since March 2015, but recent deterioration suggests that a correction is starting. First, High-Low Percent did not clear +10% the last three weeks and dipped into negative territory on Wednesday. Second, the %Above 200-day EMA dipped below 70% for the first time since November 15th. Even though the vast majority of stocks remain above their 200-day EMA, 30% are below and this will weigh on the broader market.
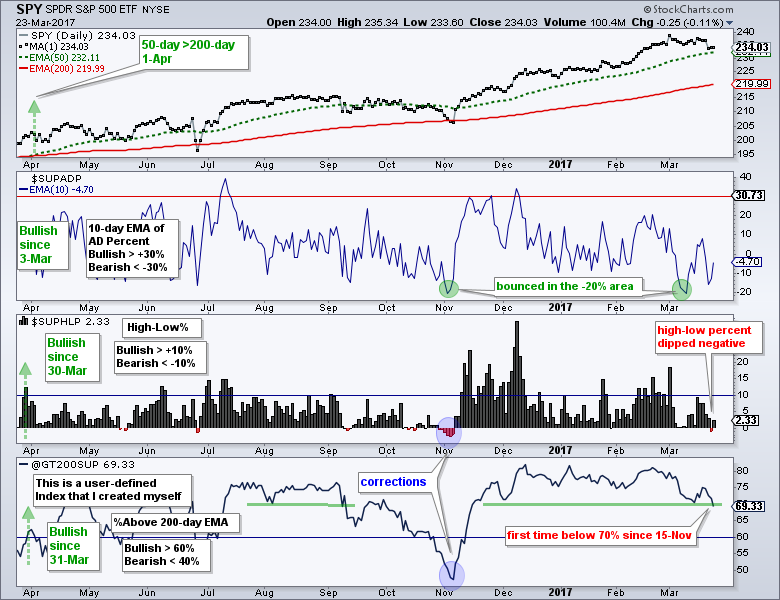
Related Links: How to create a user-defined index (@GT200SUP).
Understanding the AD Percent Indicators, High Low Indicators and %Above 200-day EMA Indicators.
The Art of Fibonacci Applied to SPY
The S&P 500 SPDR (SPY) is the most important stock market ETF because it is based on the S&P 500, which is the most important benchmark. Small-caps (IJR), mid-caps (MDY) and techs (QQQ) will correct if the S&P 500 corrects, and it looks like a correction is now underway. SPY gapped up on 1-Mar and 15-Mar, but failed to hold these gaps and broke first support. A lower high formed from early March to mid March and a correction has started.
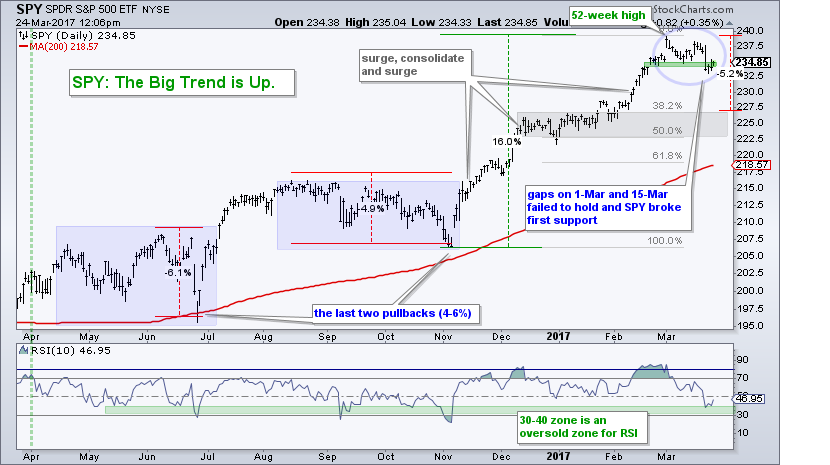
Estimating the length and duration of a correction is NOT science. Just like technical analysis, it is based on a little science and a lot of Art, especially when I am writing. The Fibonacci Retracements Tool shows the 38.2%, 50% and 61.8% retracements. Charles Dow suggested that corrective moves retrace 1/3 to 2/3 of the prior advance with 50% acting as the base-case. We can also look for prior consolidations, the 50-day SMA and the 200-day SMA. One thing is for sure: one of these levels will nail the correction low. We do not, however, know which one right now. A 5% pullback from the current highs would extend to the 227 area, which also marks a 38.2% retracement and the top of the prior consolidation. Further down we have the 61.8% retracement and the rising 200-day SMA in the 218-219 area. I am showing the 200-day SMA simply because it is more widely followed.
RSI Breaks below 50 for QQQ
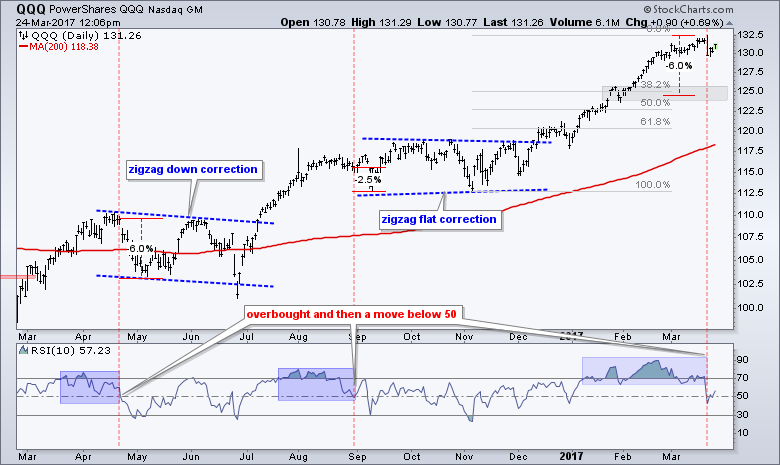
The momentum breakdown in QQQ is another reason to expect a correction. I have been watching RSI for weeks as it remained near overbought levels (70). RSI was a both overbought and bullish as long as it held above 50. The blue zones show overbought periods and the red lines show when RSI moved below 50 in late April and late August (and now March). The prior drops led to corrected periods. Should another correction unfold, I would mark the first target in the 125 area.
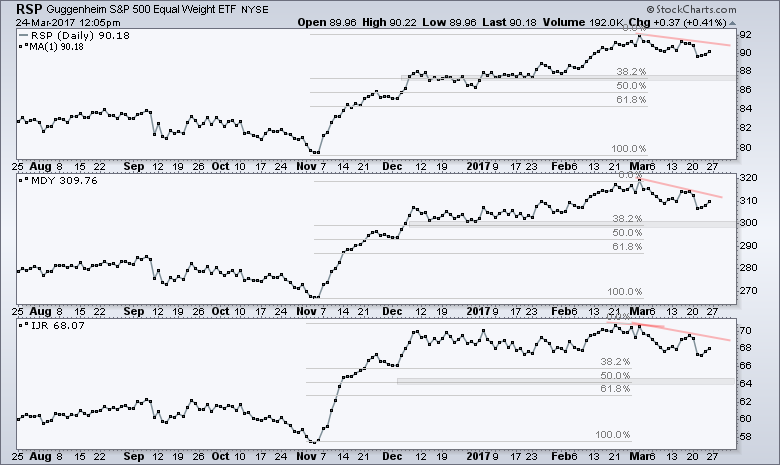
Mid-caps and Small-caps are Already Correcting
The next chart shows the EW S&P 500 ETF (RSP), the S&P MidCap SPDR (MDY) and the S&P SmallCap iShares (IJR) with the Fibonacci Retracements Tool. First, note that all three are correcting because they formed lower highs from early March to mid March. IJR actually peaked in late February. The gray zones mark the 38% retracements on the RSP and MDY chart. Should RSP and MDY retrace 38%, I would expect IJR to overshoot and retrace at least 50% because it is already showing relative weakness. In addition, small-cap stocks have higher betas and tend to move more than large-caps or mid-caps.
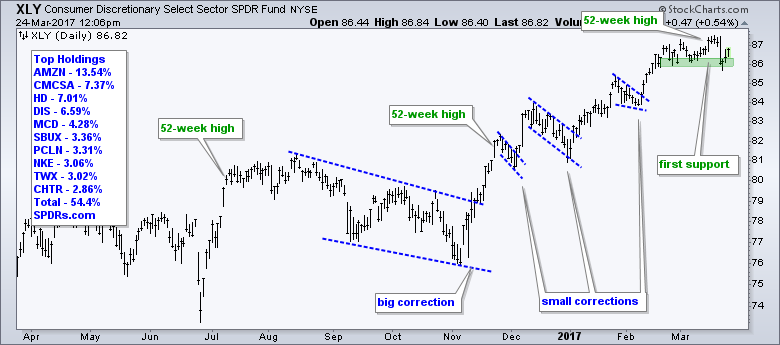
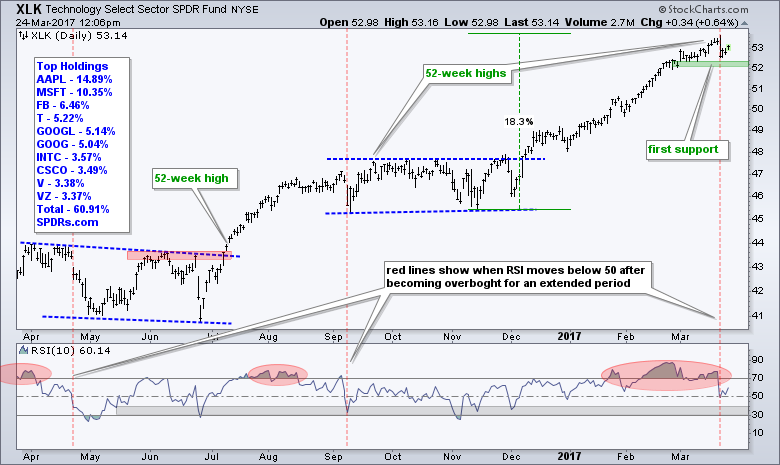
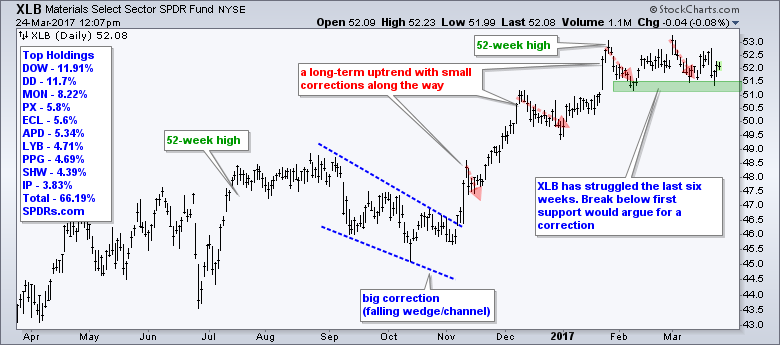
Discretionary, Tech and Materials Hold Support
When I run through the sector SPDR charts, I see five holding up, three are in correction mode and one is in a downtrend. XLK, XLY and XLB stalled out the last few weeks, but did not break short-term support and are holding up the best. Short-term support breaks in XLK and XLY would suggest that the correction is broadening. Note that XLK accounts for 22% of SPY and XLY accounts for 12%. XLB only accounts for 2.83% of the S&P 500 so its influence on the broader market is limited.
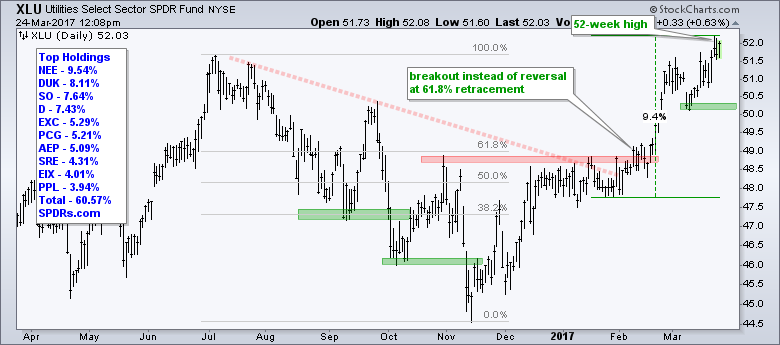
Staples and Utilities Lead with New Highs
Next we have XLP and XLU hitting 52-week highs this month and holding above short-term support. XLP weighs in at 9.42% of SPY and XLU accounts for just 2.9% of the market benchmark. Nevertheless, these are the two most defensive sectors and they attract safe-haven money. Note that XLP hit a new high last Friday and XLU hit a new high on Wednesday. Both are in uptrends and above short-term support.
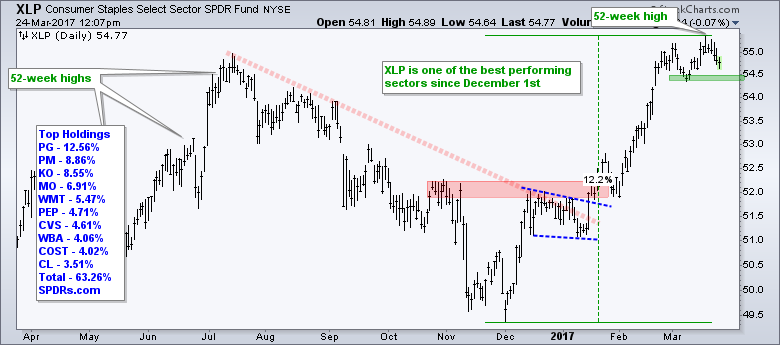
All told, the five sectors above account for around 49% of the S&P 500. The other four sectors are in corrective mode and they account for around 51%. Thus, the market is still split so I will be watching to see which sectors will tilt the balance. Support breaks in XLY and XLK would clearly tilt the balance towards a full-blown correction.
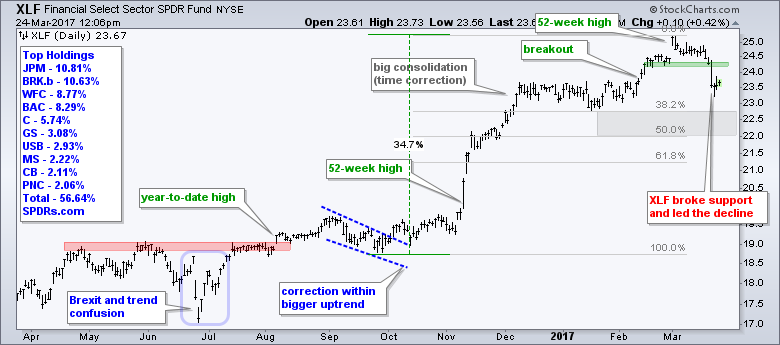
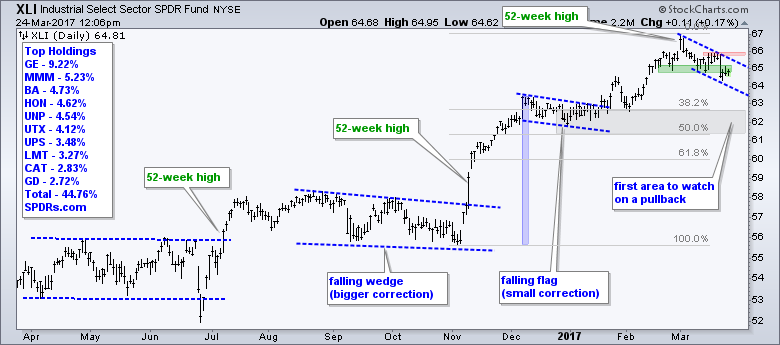
Finance, Industrials and Healthcare Correct
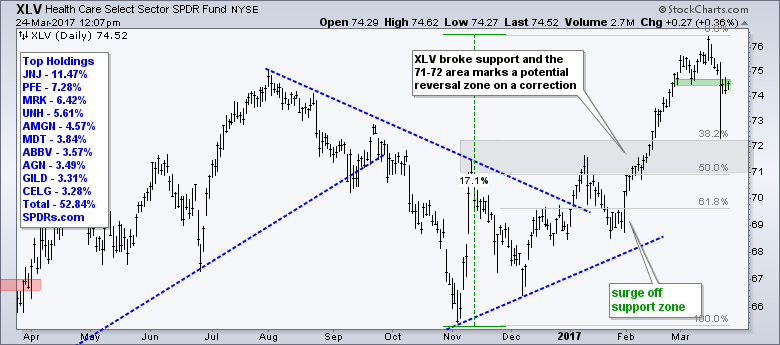
XLF, XLI and XLV broke short-term support this past week and these three are in corrective mode right now. I have added the Fibonacci Retracements Tool to each chart and the 38-50% retracement zones are the first area to watch for potential support.
Energy Remains the Weakest Link
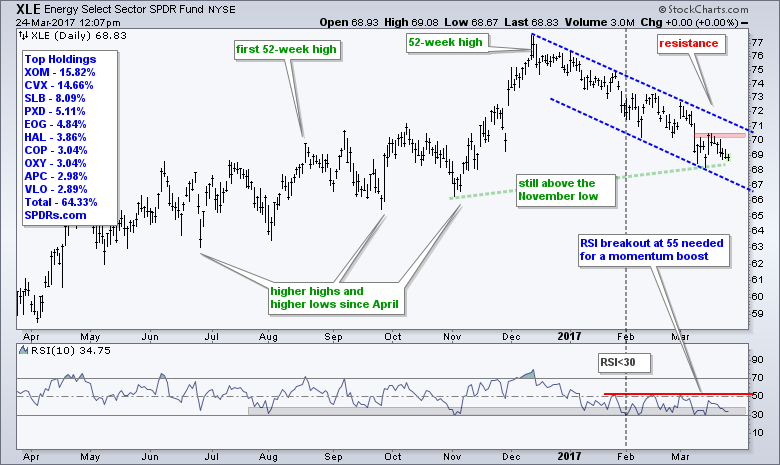
The Energy SPDR (XLE) is clearly the weakest of the nine sector SPDRs, but I am still not ready to label this a long-term downtrend. Note that XLE hit a 52-week high in mid December and remains above the early November low. Even though the "correction" clearly overstayed its welcome and the breadth indicators turned net bearish, a simple visual of the price chart shows an overall uptrend since April. The ETF attempted to bounce last week, but fell back again this week and we can mark first resistance at 70.5. A break above this level and an RSI break above 55 would provide the first sign of life for XLE.
Crude Tests Channel Trend Line
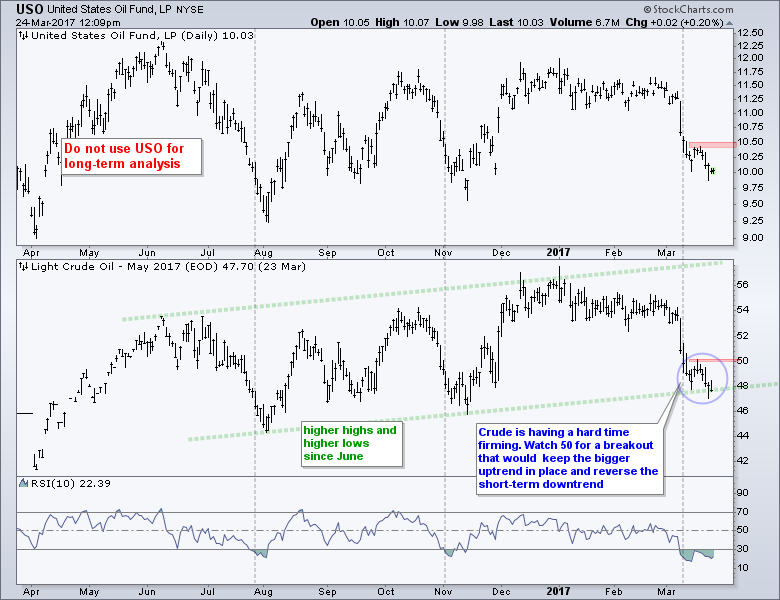
XLE, the Oil & Gas Equip & Services SPDR (XES) and energy-related stocks will remain in the doldrums as long as oil remains weak. May Crude (^CLK17) fell to the lower end of its nine month range in early March and remains under selling pressure. This is a make-or-break area because further weakness could push crude into the low 40s. Crude got a small bounce to 50, but fell right back below 48. This short-term peak now marks first resistance and a break above 50 is needed for a bullish reversal.
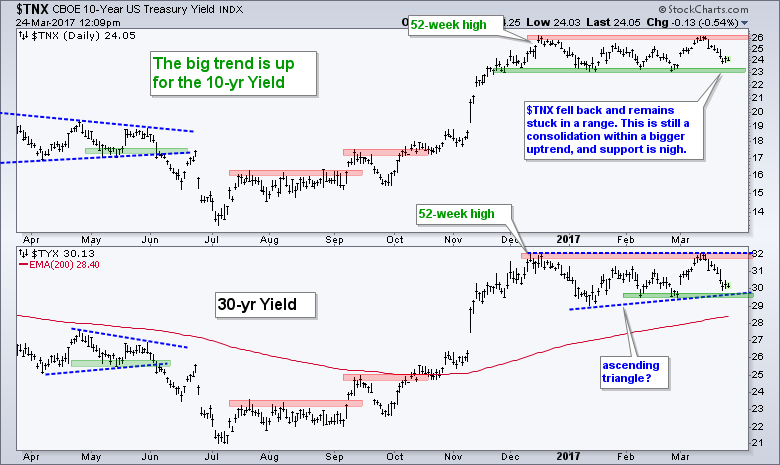
Bonds Extend Consolidation
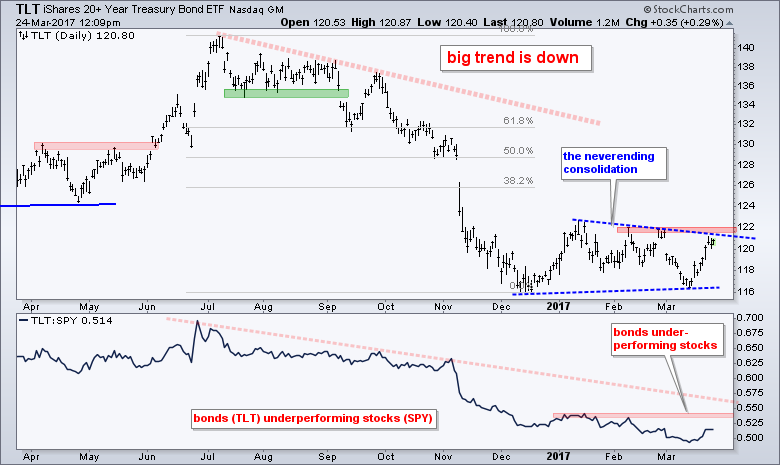
The 20+ YR T-Bond ETF (TLT) broke triangle support to signal a continuation of the bigger downtrend and then surged around 3.5%. I was not expecting this move, but it does not change my overall assessment. The long-term trend is down and the triangle is just a little bigger. TLT has bounced between 116 and 123 since December and this is just a consolidation after a sharp decline. I would reassess on a breakout at 122. Such a move would be quite negative for stocks, especially financials. As long as TLT is below 122 and the bigger trend is down, chartists should also be on guard for a reversal of the two week upswing.
The 10-yr T-Yield ($TNX) and the 30-yr T-Yield ($TYX) declined as Treasury bonds rose. Both are now closer to the lower end of their three month ranges.
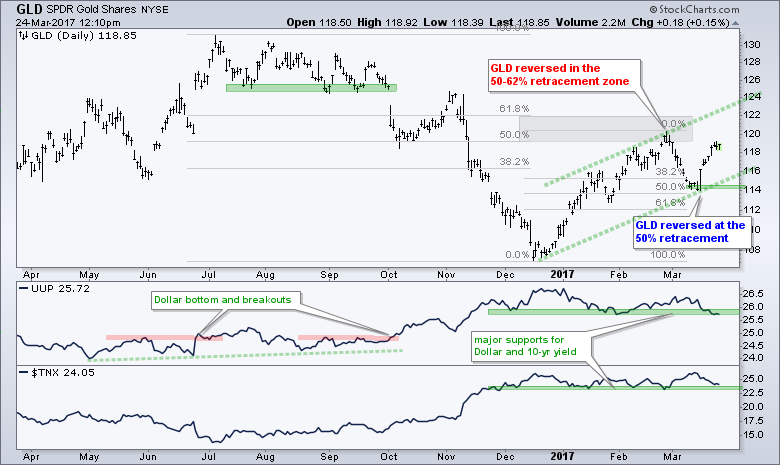
Gold Bounces Along with Treasury Bonds
Gold got a boost from the decline in Treasury yields and a decline in the Dollar, both of which are near their 2017 lows (support?). I still think gold is at the mercy of the Dollar and the 10-yr T-Yield, and further weakness in both would be bullish for gold. Reversals off support would be bearish for gold. On the price chart, GLD reversed at the 50% retracement and surged over the last two weeks. It is possible that a rising channel is taking shape with support marked at 114.
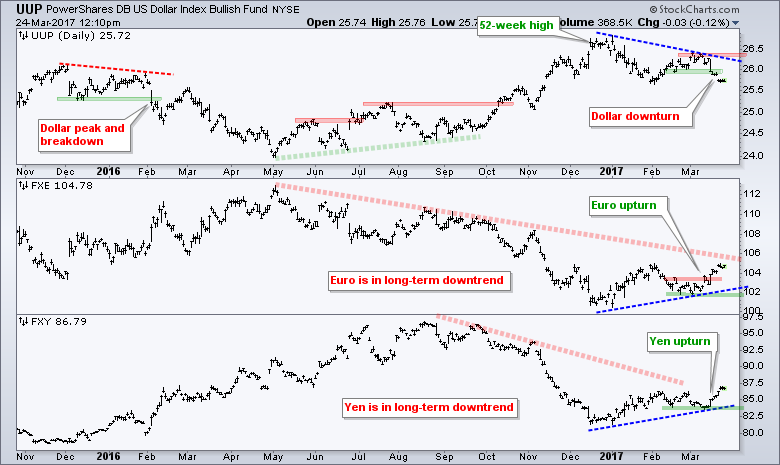
Dollar Corrects within Uptrend
The Dollar turned down over the last two weeks as the Euro and Yen turned up. UUP formed a lower high from January to March and reversed the upswing that started in February. The long-term trend still looks up, but the Dollar is clearly in corrective mode with the break down over the last two weeks. Similar, FXE and FXY appear to be in long-term downtrends, but the in the midst of counter-trend bounces (bear market rallies).
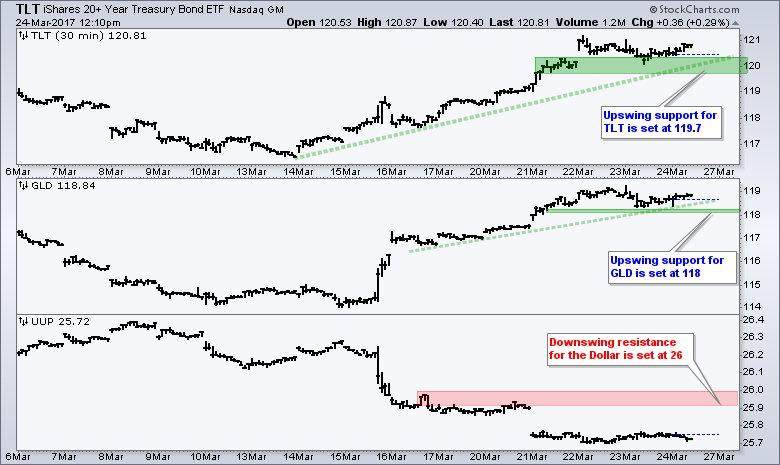
Watching the Swings in TLT, GLD and UUP
I am not much into intraday charts, but it is clear that recent moves in the 20+ YR T-Bond ETF (TLT), US Dollar ETF (UUP) and Gold SPDR (GLD) are correlated. Since March 14th, TLT and GLD are up sharply, while UUP is down sharply. Chartists looking for a jump on these swings can turn to intraday charts. TLT and GLD are in clear upswings with the green zones marking support. UUP is in a clear downswing with the red zone marking resistance. Watch these zones for early breaks.
******************************************************
Spotting Pullbacks and Upturns within an Uptrend using RSI and MACD Histogram.
Difference between EMA and SMA - Using %Above 200-day EMA for Breadth Analysis.
Backtesting Different Moving Average Pairs with SPY, QQQ and IWM.
ETF Master ChartPack - 300+ ETFs organized in a Master ChartList and in individual groups.
Follow me on Twitter @arthurhill - Keep up with my 140 character commentaries.
****************************************
Thanks for tuning in and have a good day!
--Arthur Hill CMT
Plan your Trade and Trade your Plan
*****************************************


