.... WTI and Brent Battle the $50 Level
.... Gasoline Looks Poised to Continue Uptrend
.... Industrial Metals Remain in Uptrends
.... Silver Surges off Breakout Zone
.... Two Emerging Market ETFs in Asia
.... New Zealand ETF Bounces off Breakout Zone
.... Colombia ETF Breaks Out of Flag ....
I am going to mix it up a little today by looking at weekly charts for some commodities and international ETFs. I will first look at oil because it looks like the long-term trend is up and the short-term trend turned back up last week. Second, I will look at some industrial metals because aluminum and copper are in long-term uptrends. Third, I will look at some emerging market ETFs in Asia, a developed market in Asia and an emerging market in Latin America.
WTI and Brent Battle the $50 Level
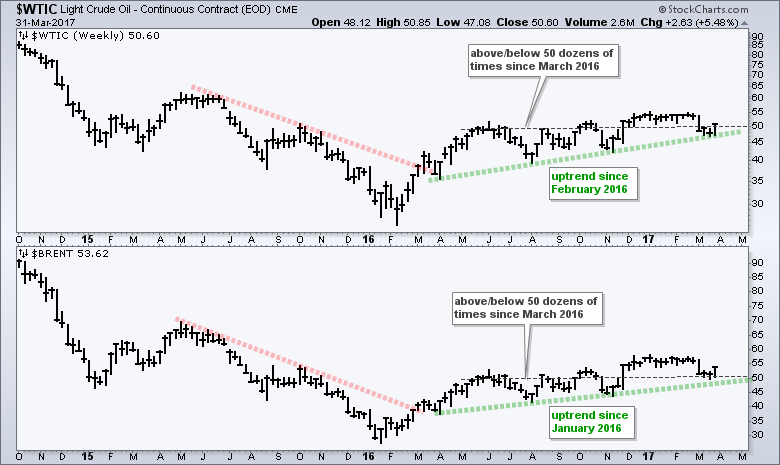
The chart below shows the Light Crude Continuous Futures ($WTIC) and Brent Crude Continuous Futures ($BRENT) over the last two and a half years. Be careful when using the continuous futures prices for trading signals and setups because they are stitched together from individual futures contracts. They are usually best suited for long-term analysis and basic trend identification. The trends for both Light Crude and Brent are up with higher lows and higher highs since January 2016. These uptrends, however, are ever so slight because both crossed the $50 level several times since the summer of 2016. More recently, both turned up sharply last week and regained the $50 level. It looks like oil is attempting for form a higher low and revive its uptrend.
Gasoline Looks Poised to Continue Uptrend
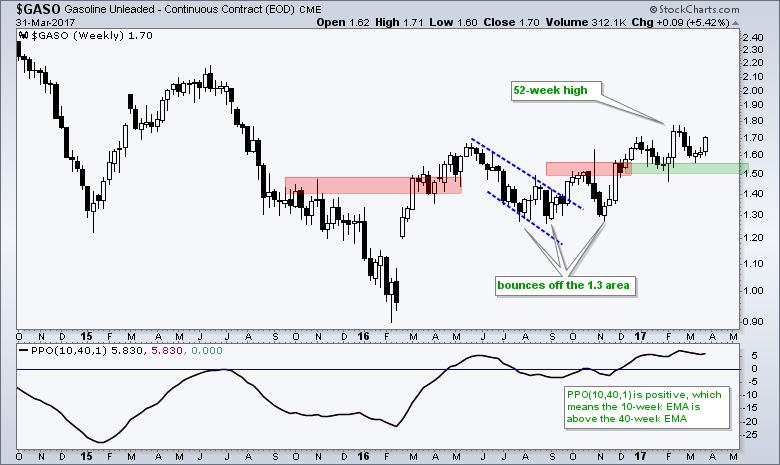
I am also noticing an uptrend in Unleaded Gasoline Continuous Futures ($GASO). The chart below shows $GASO surging from February to May (.90 to 1.60) and then correcting with a falling channel into the summer. Gasoline found support in the 1.3 area several times from August to October and then surged again in November. This surge extended into 2017 as $GASO hit a 52-week high in February. This chart looks bullish overall and I would expect a move to the 2-2.2 area as long as support at 1.5 holds. Note that broken resistance in the 1.5 area turned support.
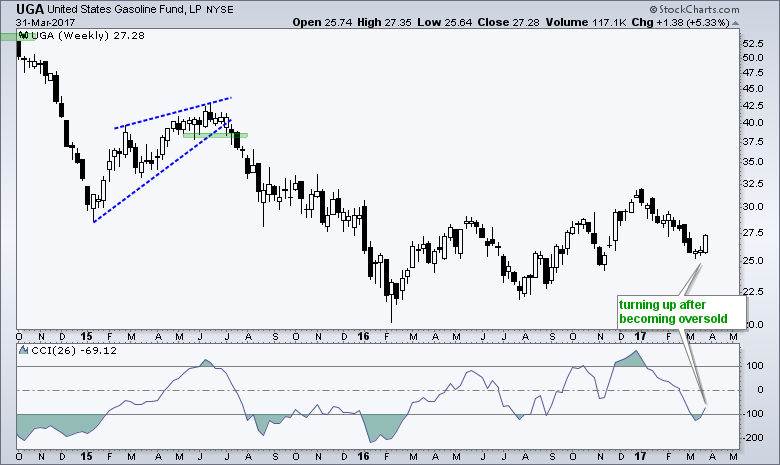
The next chart shows the US Gasoline ETF ($UGA) taking a hard hit this year with a 20% decline. The ETF, however, appears to be turning up after becoming oversold. Notice that CCI(20) dipped below -100 and moved back above this oversold level last week. Note that UGA should only be used for short-term trading because it does not tack $GASO very well. For example, UGA is down around 12.90% year-to-date and $GASO is up 1.90%.
Industrial Metals Remain in Uptrends
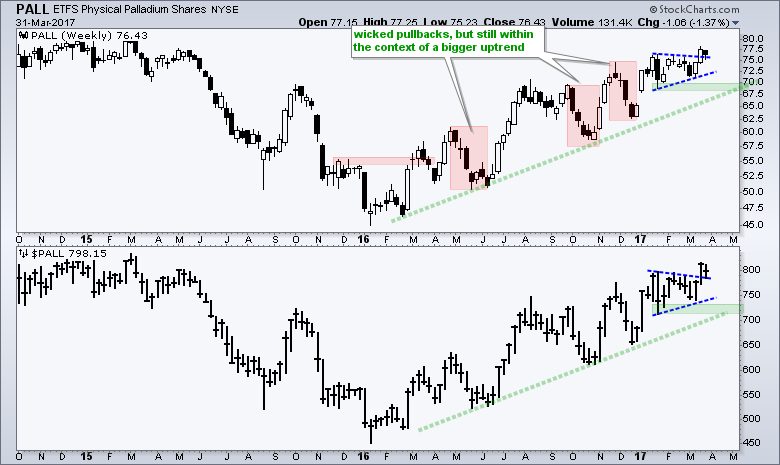
The Palladium ETF (PALL) has been trending up since January 2016 and recently hit a 52-week high. Note that the chart below shows the ETF in the top window and the continuous futures contract in the lower window. As you can see from the chart, metal ETFs typically track the underlying commodity quite well over the long-term. Notice that both the ETF and the continuous futures contract hit 52-week lows in January 2016 and then started zigzagging higher. The most recent triangle breakout signals yet another continuation of this uptrend. Before getting too bullish, keep in mind that Palladium has been subject to some sharp 3-4 week selloffs within this uptrend (red boxes).
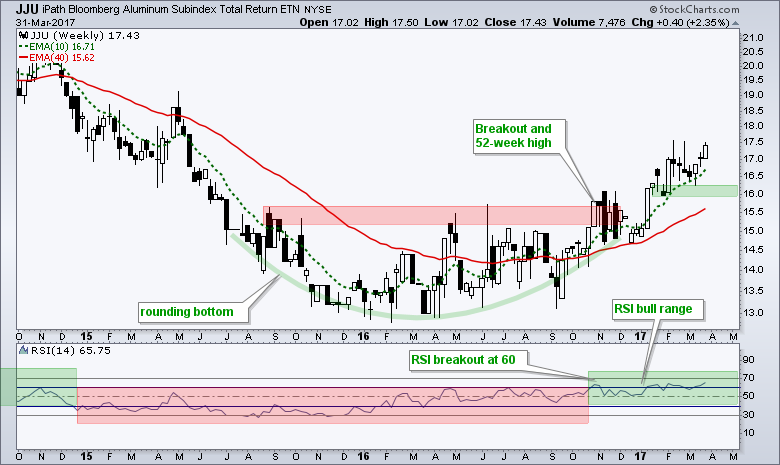
The Aluminum ETN (JJU) continued its uptrend with a surge the last three weeks. Notice that a big rounding bottom formed from July 2015 to October 2016 and the ETF broke out for good early this year. Also note that the 10-week EMA has been above the 40-week EMA since late September and RSI moved into its bull range in October. Chartists can use bull and bear ranges in RSI to help define the trend. The bull range extends from 40 to 80 and the bear range extends from 20 to 60. RSI entered the bull range with a move above 60 in October and remains bullish until it breaks 40. On the price chart, I would use support at 16 to define the uptrend.
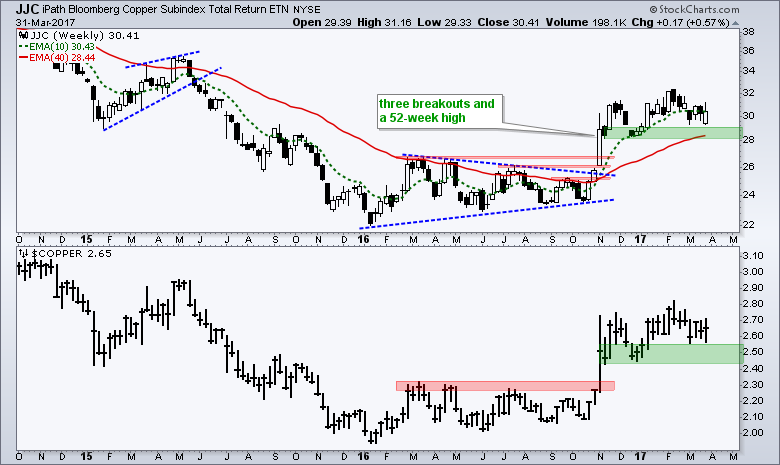
The Copper ETN (JJC) remains in an uptrend overall, but it has struggled over the last four months. Notice that JJC broke out with a surge in October-November and then turned flat. Hmm....small-cap stocks did the same thing (IJR and IWM). Perhaps they are correlated somewhat. Despite this stall, copper remains bullish until the uptrend is proven otherwise. I would mark uptrend support at 28.
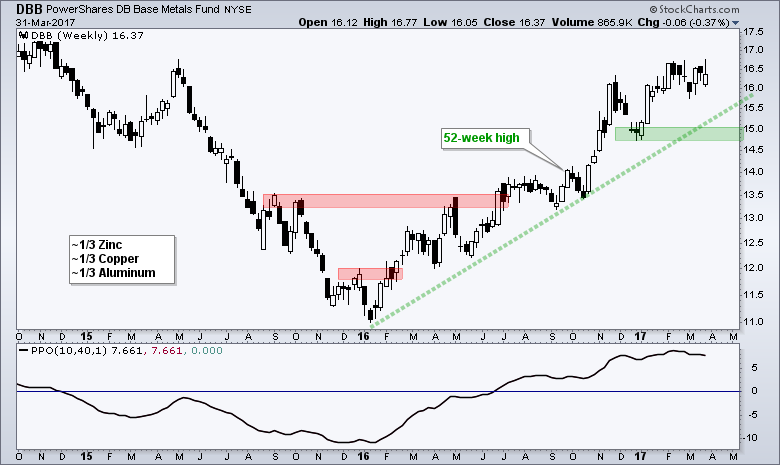
The Base Metals ETF (DBB) is an ETF with relatively equal parts of aluminum, copper and zinc. The latter went on a tear in 2016 and propelled DBB from 11 to 16. The current trend is clearly up with first support marked in the 14.5-15 area.
Silver Surges off Breakout Zone
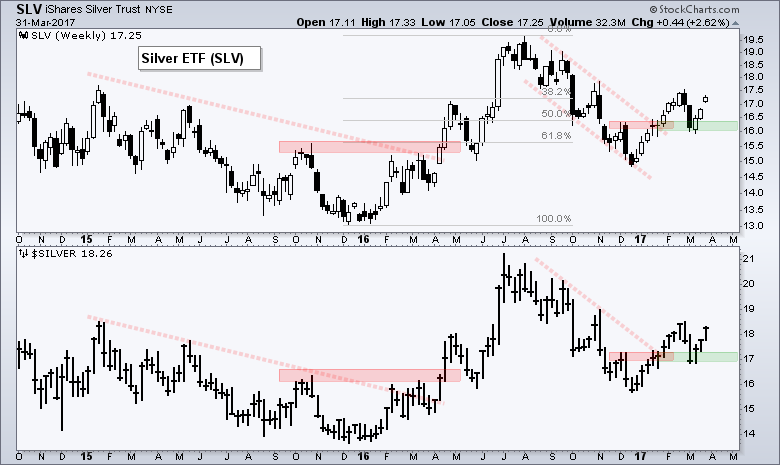
The next chart shows the Silver ETF (SLV), which is part industrial metal and part precious metal. SLV broke out with a two month advance at the start of the year and then pulled back sharply in early March. The breakout zone around 16 turned into a support zone and held as SLV bounced back the last three weeks. Chartists can mark support at 16 and remain bullish as long as this level holds (weekly close).
Two Emerging Market ETFs in Asia
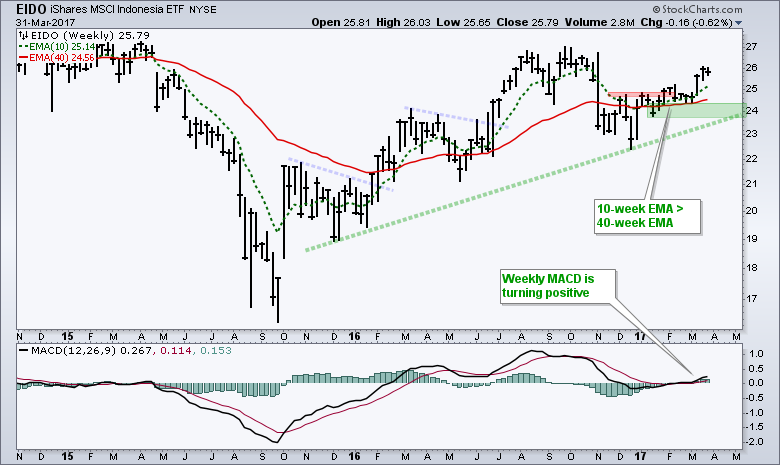
Emerging markets seem to be hot right now. I featured the Indonesia iShares (IEDO) on March 17th when it surged off support and would like to show a weekly chart today. EIDO sports an uptrend since September 2015 with a series of higher highs and higher lows. The pullback late last year was quite deep, but the ETF managed to firm and turn back up in 2017. Notice that the 10-week EMA moved above the 40-week EMA in January and weekly MACD is turning up. I like the fact that MACD seems to be accelerating as it crosses into positive territory. This suggests that there is more room to run before getting extended. I am marking uptrend support at 24.
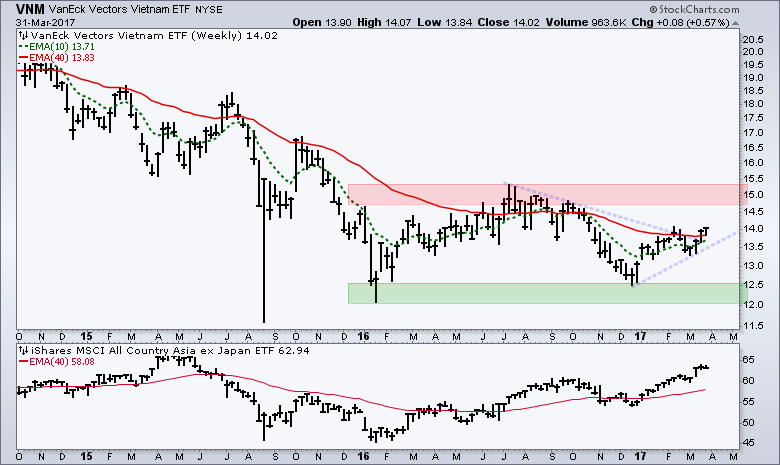
The Vietnam iShares (VNM) represents another emerging market in Asia. VMN, however, is not as strong as EIDO and also not as strong as some of the developed Asia markets. The South Korea iShares (EWY), the Taiwan iShares (EWT), the Japan iShares (EWJ) and the Singapore iShares (EWS) hit 52-week highs last week and they are leading. Even so, it looks like Vietnam is trying to turn the corner. First, note that the ETF traded flat from December 2016 to now. This could be a big base with resistance in the 15 area. Second, notice that VMN bounced off support in January and closed above its 40-week EMA the last two weeks. The 10-week EMA remains below the 40-week EMA, but it is very close to triggering a golden cross.
New Zealand ETF Bounces off Breakout Zone
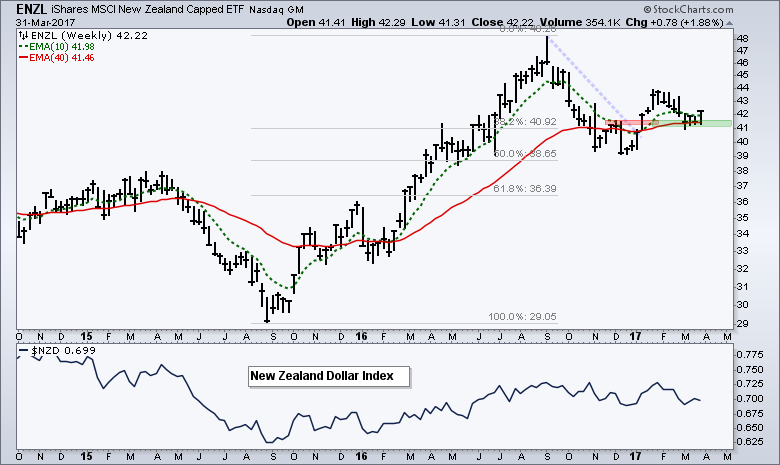
Next up we have the New Zeeland iShares (ENZL) trying to hold above the 40-week EMA. The ETF was a top performer from September 2015 to August 2016 with a 50+ percent advance. After hitting a new high, ENZL pulled back wit a correction that retraced around 50% of the prior advance. This is pretty normal for a correction within an uptrend. It looks like the correction ended with the breakout at 41 in January. The 10-week EMA also moved above the 40-week EMA at this time. More recently, the ETF fell back to the breakout zone, firmed around 41 and bounced last week. ENZL looks poised to continue its uptrend here and I would re-evaluate on a close below 41.
Columbia ETF Breaks Out of Flag
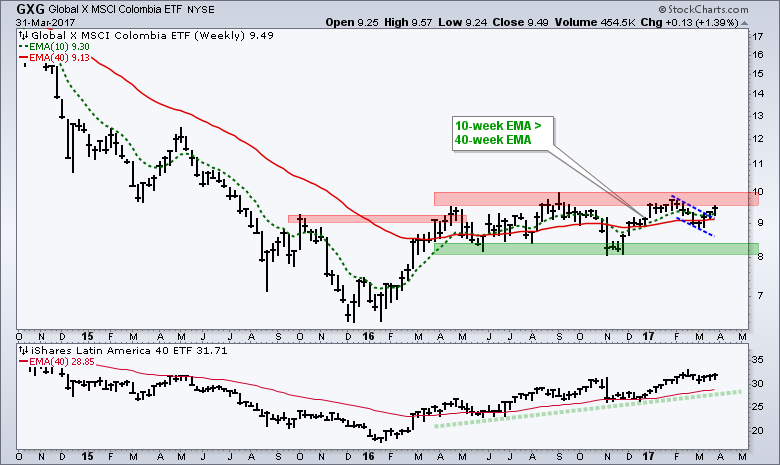
And finally, we now move halfway around the world to Latin America for the Colombia ETF (GXG). The ETF surged at the beginning of 2016 and then moved into a long consolidation. Support is around 8 and resistance around 10. I am noticing some bullish action within the consolidation that could lead to a breakout. After a bounce from November to January, the ETF pulled back in February with a falling flag. GXG broke flag resistance with a bounce the last two weeks and this is the first step to a bigger breakout. Also notice that the 10-week EMA is above the 40-week EMA.
******************************************************
Spotting Pullbacks and Upturns within an Uptrend using RSI and MACD Histogram.
The difference between EMA and SMA - Using %Above 200-day EMA for Breadth Analysis.
Backtesting Different Moving Average Pairs with SPY, QQQ and IWM.
ETF Master ChartPack - 300+ ETFs organized in a Master ChartList and in individual groups.
Follow me on Twitter @arthurhill - Keep up with my 140 character commentaries.
****************************************
Thanks for tuning in and have a good day!
--Arthur Hill CMT
Plan your Trade and Trade your Plan
*****************************************

