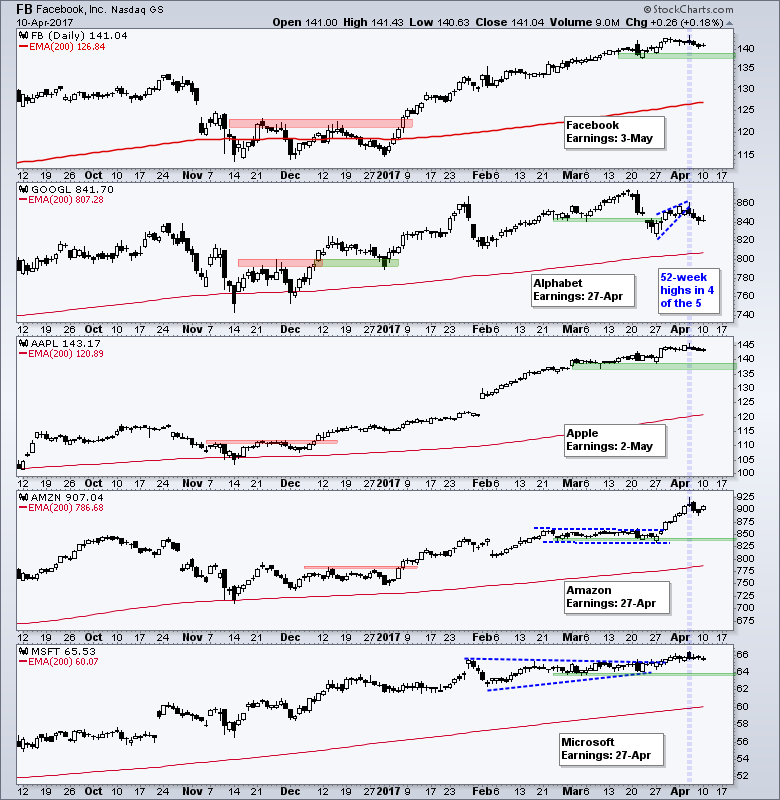
.... Alphabet Lags within the Fab Five
.... Banks Hold Support, but Fail to Follow Through on Reversal
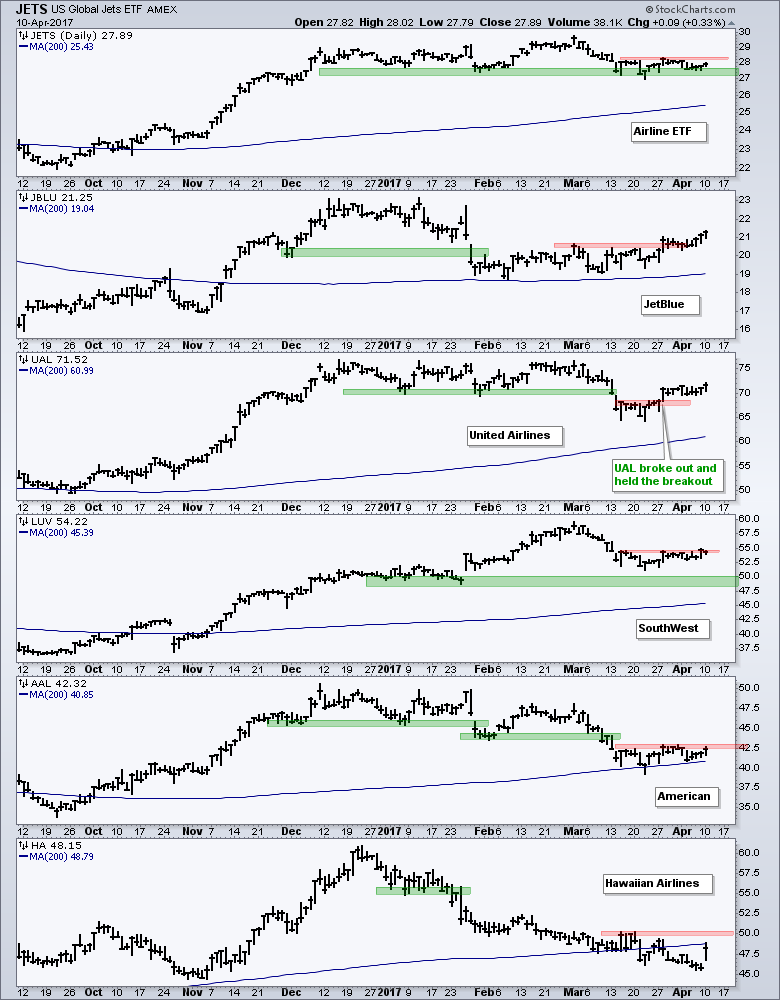
.... UAL Bounces on Seemingly Bad News
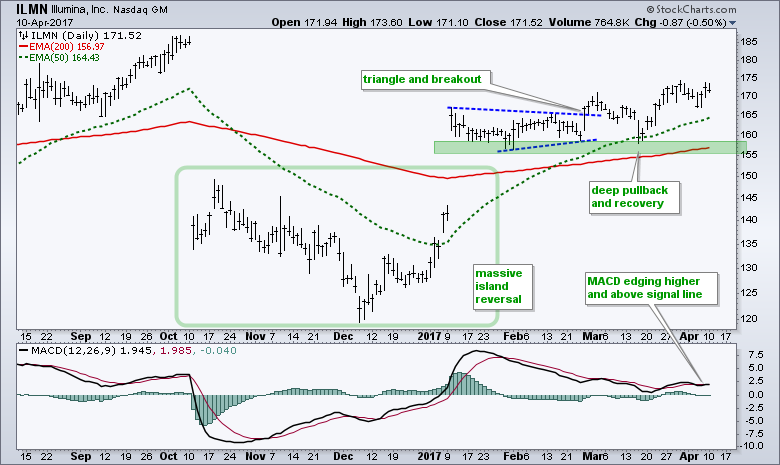
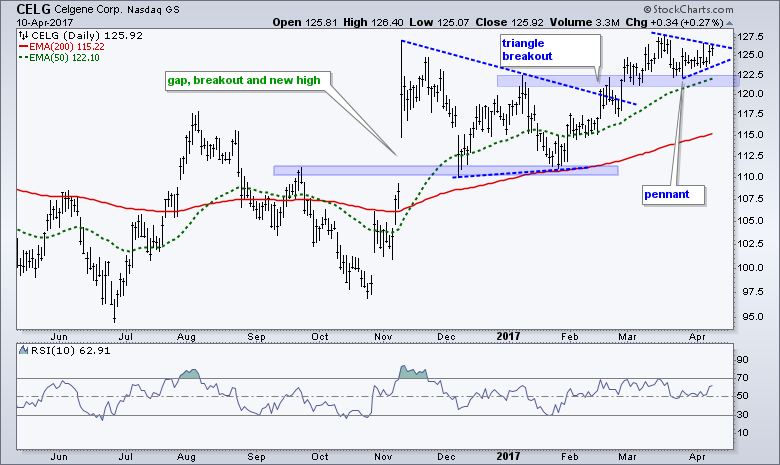
.... Celgene and Illumina Lead Biotechs (XBI)
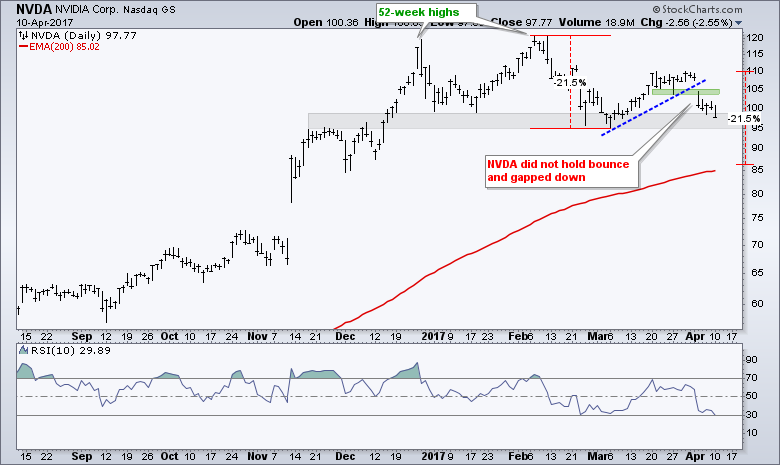
.... Measured Move Target for NVDA ....
QQQ remains one of the strongest major index ETFs because four of the five top stocks hit 52-week highs this month. Alphabet (GOOGL) is the outlier here because it was the only one that did NOT. The chart below shows Facebook, Alphabet, Apple, Amazon and Microsoft over the last six months. The green zones mark support zones from the March lows. GOOGL is the only one to break this zone. The stock bounced with a small wedge and then broke wedge support with a decline the last four days. I am not interested in shorting GOOGL or even turning that bearish because the long-term trend is up. The uptrends slowed for Facebook, Apple and Microsoft, but uptrends are better than downtrends. I would not become concerned unless than break their March lows. Amazon is the clear lower after a breakout and surge in late March. These stocks report earnings in late April and early May.
Banks Hold Support, but Fail to Follow Through on Reversal
Earnings season starts soon and banks will be a major focus. The chart below shows the Finance SPDR (XLF) with five big banks. Wells Fargo (WFC) and Citigroup (C) report on Thursday, while the other three report next week. I am not really interested in earnings, but we could see an increase in volatility as these reports hit. On the price charts, note that XLF and the five banks are above their rising 200-day SMAs. All hit 52-week highs in early March and then fell the remainder of the month. This decline was capped with a sharp one-day decline on March 21st. The green zones mark the January lows and the first significant support levels. All are above support with US Bancorp (USB) the closest, and the weakest.
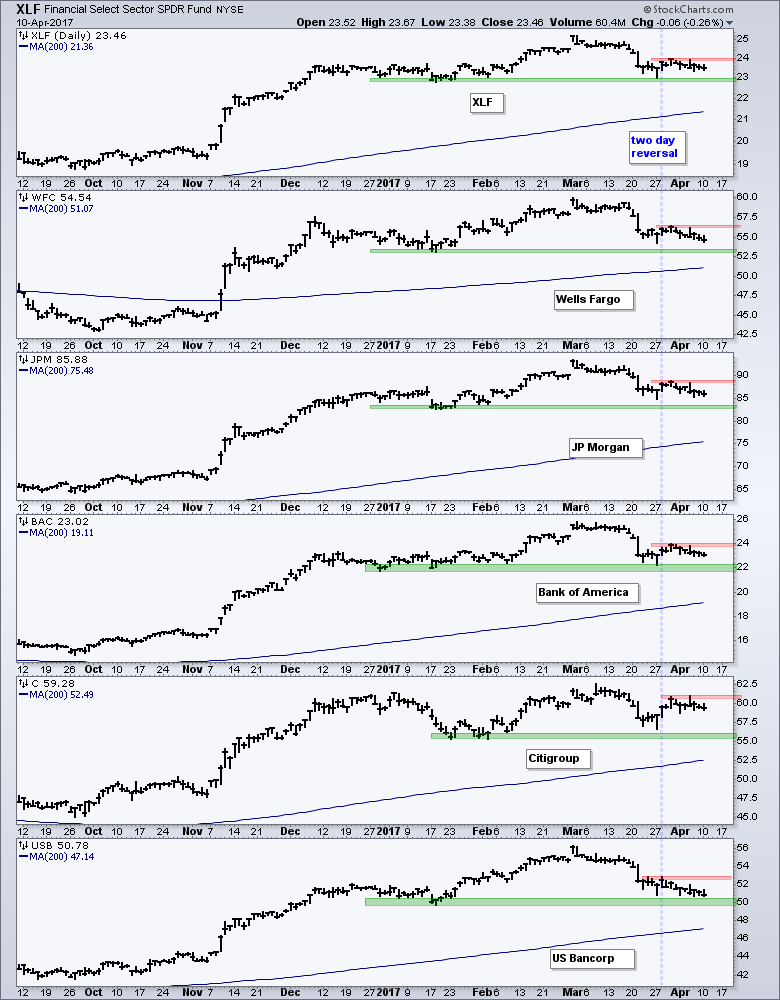
These banks are interesting because the long-term trends are up and they are trading above support. The concern is that XLF and the big banks did not follow through on the two-day reversal in late March. The blue vertical line marks the late March reversal and bounce (21-22 March). The red areas mark resistance levels that developed in April as they fell back over the last seven days. Breakouts above these resistance zones would signal follow through to the late March reversals and open the door to new highs because the bigger trend is up.
UAL Bounces on Seemingly Bad News
The United Airlines fiasco certainly grabbed the headlines on Monday, but this did not deter traders as the stock moved higher on the day. Perhaps there is more to this story than meets the eye. I often scroll through the videos on CNBC for interesting segments and I think Karen Finerman (Fast Money) makes a good point. To paraphrase, Finerman noted that it was terrible incident and a PR nightmare, but it shows that flights are full and demand is high. Perhaps this is why UAL was up 1% on the day. Note the market may already be re-assessing because UAL is down 2% in pre-market trading.
The chart below shows the Airline ETF (JETS) and five airline stocks, which are loosely ranked from strongest (JBLU) to weakest (HA). Notice that JBLU bottomed in mid February and started rising before the others. The stock broke out in late March. UAL broke support in mid March, firmed and broke out in late March. Southwest (LUV) held above its January low, firmed into late March and looks poised to move higher. American (AAL) is bouncing off the 200-day SMA and a breakout at 43 would be bullish. Hawaiian Airlines (HA) is the weakest of the group, but the stock sprang to life with a gap-surge on Monday. These airlines report earnings at the end of the month.
Celgene and Illumina Lead Biotechs (XBI)
The Biotech SPDR (XBI) led the market in January-February with a 20+ percent gain the first two months. After hitting a marginal new high in mid March, the ETF corrected with a falling wedge the last few weeks. This decline, should it turn out to be a mere correction within an uptrend, could be close to reversing. Notice that the decline retraced 50% and returned to the mid January high. The short-term trend is down as long as the wedge falls and I would watch two items to identify a reversal. First, a close above 69 would break wedge resistance and exceed the 5-Apr high. Second, an RSI move above 50 would trigger a momentum breakout.
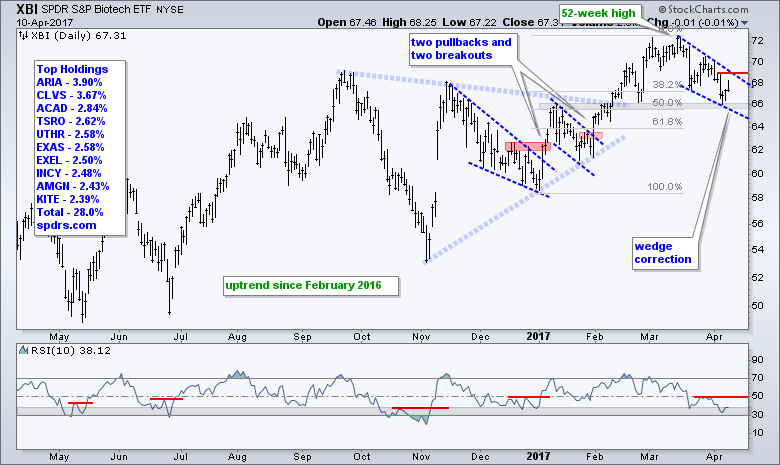
Chartists can measure relative chart performance by comparing individual biotech stock charts to the XBI chart. XBI fell around 7% over the last four weeks. Biotech stocks that are up or flat during this period are showing relative strength. This is something we should consider because stocks that hold up well when the market or industry group corrects often lead when the market and/or industry group turns up. Illumina (ILMN) held support in mid March and moved higher the last four weeks. Celgene (CELG) broke out in February and the breakout zone is turning into a support zone. The stock formed a pennant, which is a bullish continuation pattern, and a breakout at 127 would signal a continuation higher. ILMN reports on 24-Apr and CELG reports on 27-Apr.
Measured Move Target for NVDA
NVDA proves that technical analysis is dynamic and chartists need to re-evaluation after each new price bar. I thought the stock still looked bullish after the bounce off the support zone in early March. This bounce, however, stalled in late March and the stock broke down with a gap five days ago. This gap-breakdown signals a continuation of the prior decline and targets a move to the 87 area. Although not scientific, I am using the measured move technique to project a 21.5% decline from the late March high. This is the amount of the prior decline.
******************************************************
Spotting Pullbacks and Upturns within an Uptrend using RSI and MACD Histogram.
Difference between EMA and SMA - Using %Above 200-day EMA for Breadth Analysis.
Backtesting Different Moving Average Pairs with SPY, QQQ and IWM.
ETF Master ChartPack - 300+ ETFs organized in a Master ChartList and in individual groups.
Follow me on Twitter @arthurhill - Keep up with my 140 character commentaries.
****************************************
Thanks for tuning in and have a good day!
--Arthur Hill CMT
Plan your Trade and Trade your Plan
*****************************************


