 |
.... Broad Market Breadth Remains Weak .... SPY Stalls within Pullback .... Bearish Failure Swing forms in QQQ .... IJR Tests Consolidation Lows .... Tech, Discretionary and Staples Hold Up .... Utilities and Materials Stay Strong .... Finance, Industrials and Healthcare Correct .... XLE Attempts a Channel Breakout (plus XOM) .... Oil Holds Uptrend with Surge .... TLT Challenges Consolidation Resistance .... Gold Stalls near Prior High .... Watching the Wedges for the Dollar, Euro and Yen .... |
Stocks and Bonds Yawn as Oil Wakes Up
It was a rather weird week for the markets. There were plenty of news events to move the markets, but stocks and bonds did not do much. Stocks were slightly lower with SPY losing .23% and bonds were slightly higher with TLT gaining .21%. The weekly moves were quite small, but reflect a slight risk-off mood in the market. The big move came in the oil market with USO surging over 3% to keep its long-term uptrend alive.
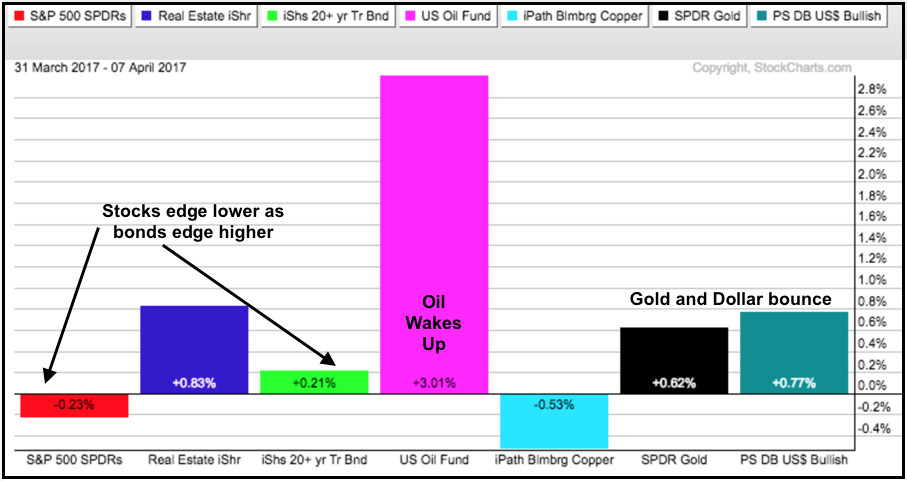
Elsewhere, the weirdness continued as both the Dollar and gold advanced. Perhaps this also reflects a short-term flight to safety in the markets. Overall, stocks remain in corrective mode with the sectors split. TLT is stuck in a consolidation and I am watching the swings within this consolidation for clues on other assets. An upside breakout in TLT would be negative for stocks and positive for gold, while a reversal near consolidation resistance could put a bid in stocks. The details are laid out in the charts below. Note that I am travelling this weekend and will not be able to post a video.
Broad Market Breadth Remains Weak
The first chart shows three key breadth indicators for the S&P 1500: the 10-day EMA of AD Percent ($SUPADP), High-Low Percent ($SUPHLP) and the Percentage of Stocks above their 200-day EMA. Links explaining these indicators can be found under the chart. Last week I noted that the seven-day thrust in AD Percent was not enough to pull the broader market out of corrective mode. This remains the case and I would like to see at least a move above +20% before reconsidering. High-Low Percent remains anemic and has not been above +10% since March 1st. A move above +5% is needed before reconsidering.

The bottom window shows a user-defined index for the %Above 200-day EMA. This indicator broke 70% on 23-March to signal enough deterioration in the broader market to warrant a correction. This indicator continues to drift lower and remains in the corrective camp. A move above 75% is needed to reconsider.
Related Links: How to create a user-defined index (@GT200SUP).
Understanding the AD Percent Indicators, High Low Indicators and %Above 200-day EMA Indicators.
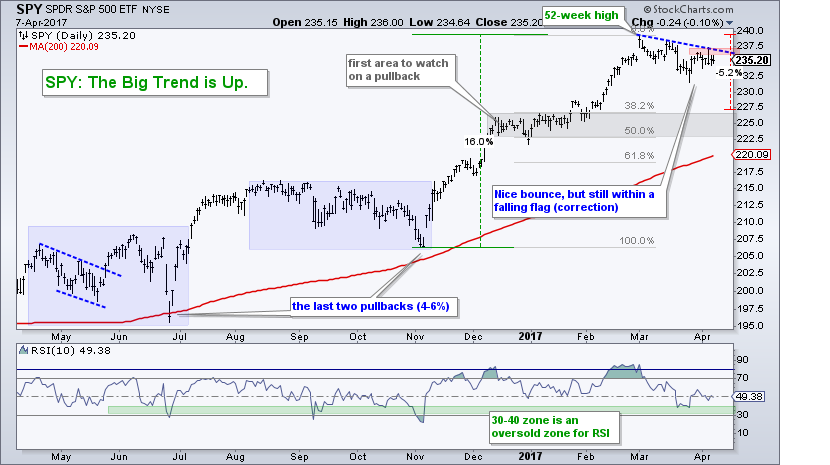
SPY Stalls within Pullback
There is not much change in my assessment of the S&P 500 SPDR (SPY), which serves as my benchmark for the stock market. The big trend is up, but the ETF is currently in corrective mode with the first target in the 227 area. This target represents a 38% retracement and a 5% pullback from the high. There is always the chance of a deeper or shallower pullback because I am making an educated guess here. Shorter term, SPY failed in the 237 area the last two weeks and a breakout at 237.5 could signal a end to the correction. At the very least, this would warrant a re-assessment and a breadth check to evaluate the robustness of move.
Bearish Failure Swing forms in QQQ
QQQ remains the strongest of the big three (QQQ, SPY, IJR) and has yet to break down. Nevertheless, I would not expect QQQ to buck the broader market and I expect it to join the correction as long as SPY remains in corrective mode. The bearish failure swing is taking shape in RSI because the indicator did not exceed 70 on the latest bounce (red dashed line). A follow through below 50 would confirm this bearish signal and reinforce the correction argument.
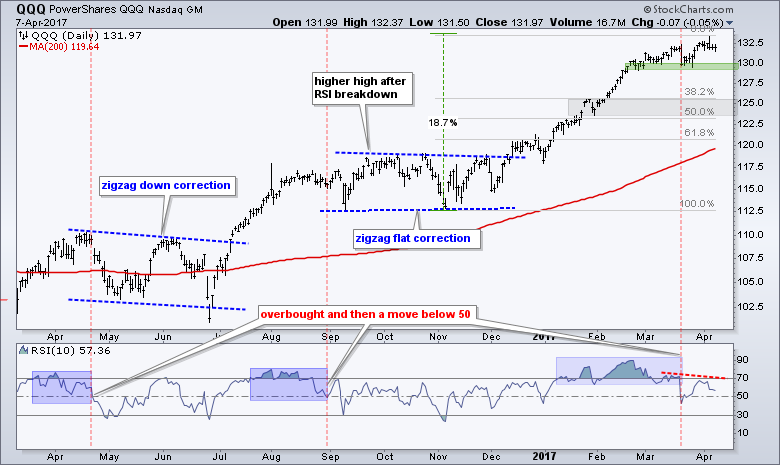 Note that a bearish failure swing is NOT the same as a bearish divergence, even though a bearish divergence is also taking shape. The bearish failure swing is independent of price. A bearish failure swing occurs when RSI exceeds 70, declines below 70, bounces, fails to exceed 70 on this bounce and then breaks below the low of the bounce.
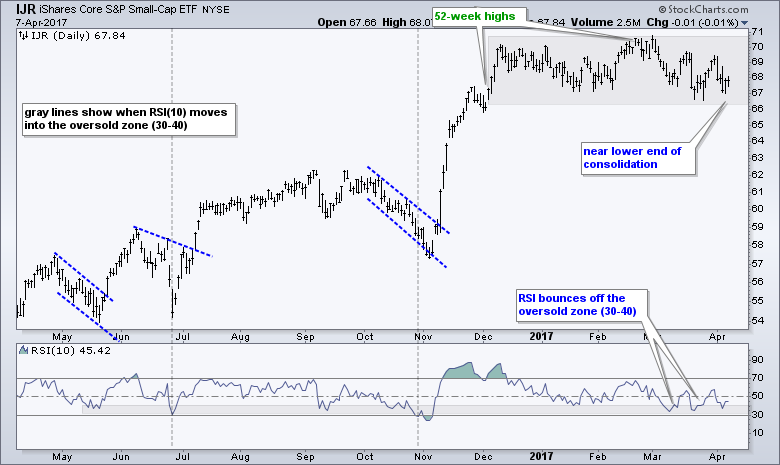
IJR Tests Consolidation Lows
The S&P SmallCap iShares (IJR) remains stuck in a consolidation and a difficult call at the moment. IJR is in a long-term uptrend and near consolidation support, but small-caps stocks are lagging the broader market and weighing on the breadth indicators. Since I am in the corrective camp for the broader market, I would not be surprised to see a break below the consolidation lows and a deeper pullback.
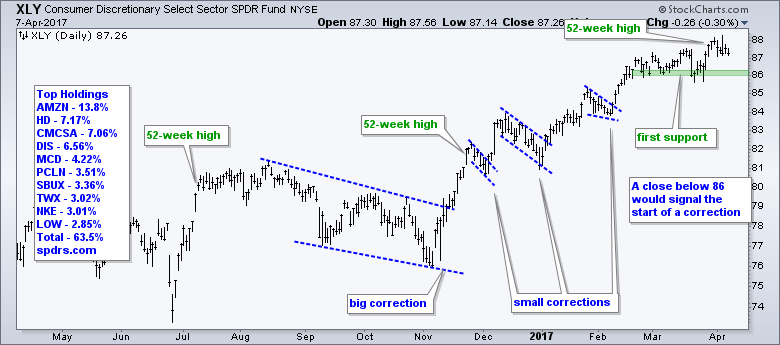
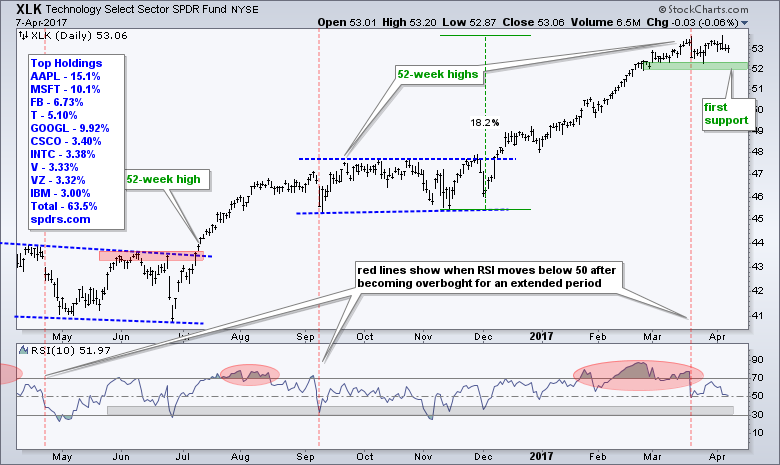
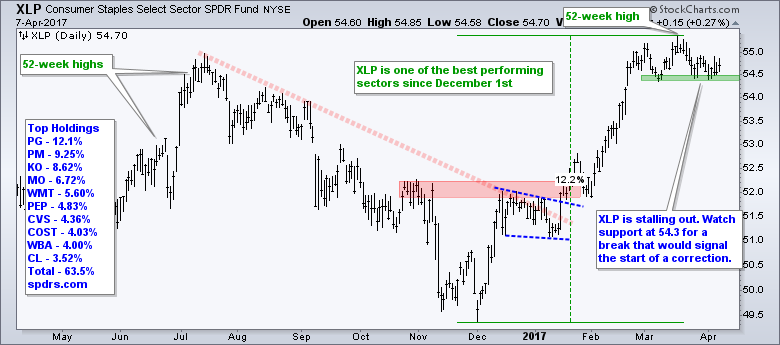
Tech, Discretionary and Staples Hold Up
The nine sector SPDRs remain split with five holding above support and four in downtrends or corrections. Technology, consumer discretionary, consumer staples, materials and utilities are holding up and keeping the market buoyant. These five sectors account for around 50% of the S&P 500, which means the other four account for the other 50%. It is a true split and I am watching to see which sectors will crossover and tilt the balance. Support breaks in XLK, XLY or XLP would tilt the balance towards the bears.
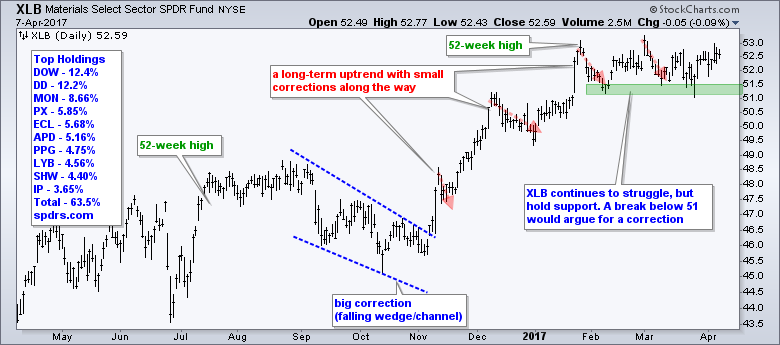
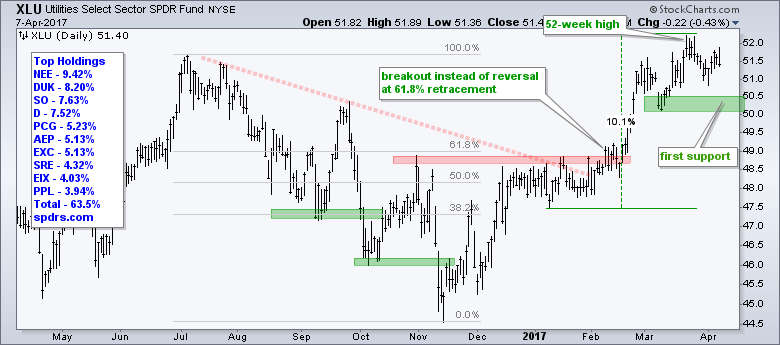
Utilities and Materials Stay Strong
XLB and XLU each account for around 3% of the S&P 500. Breakdowns in one or both would affect the market balance, but not as much as the other three sectors.
Finance, Industrials and Healthcare Correct
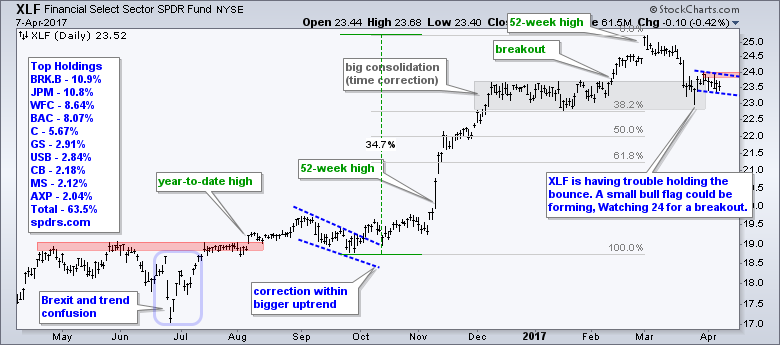
XLF bounced off the support zone in late March and then consolidated last week. This consolidation gives us something to watch for next week. A close above 24 would break resistance and signal a continuation of the late March reversal. This would be quite beneficial to the broader market.
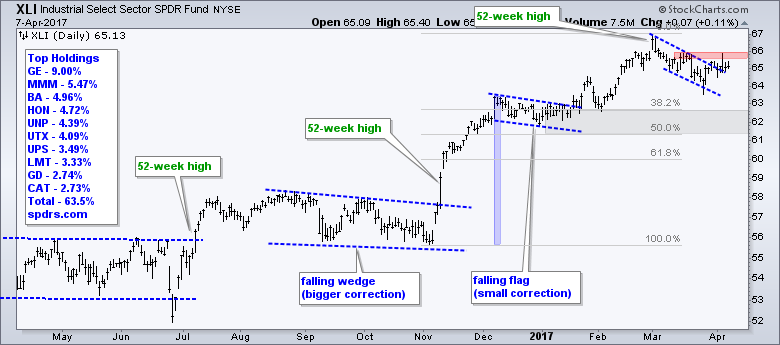
 XLI also got a bounce in late March and then stalled the past week. A flag breakout could be in the making, but I would like to see some follow through with a close above 66 before taking it seriously.
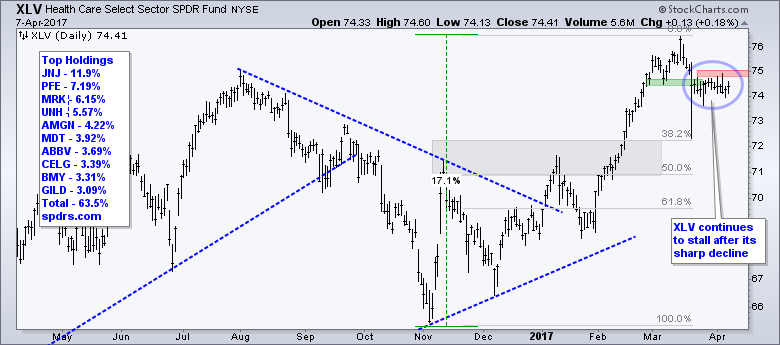
 The HealthCare SPDR (XLV) fell sharply in mid March and broke below first support. This break is holding as the ETF consolidates below the break. A move above 75 is needed to negate to breakout and re-evaluation.
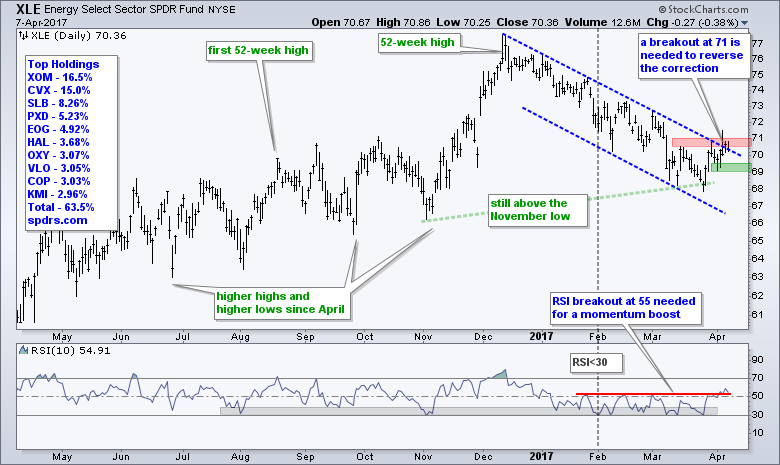
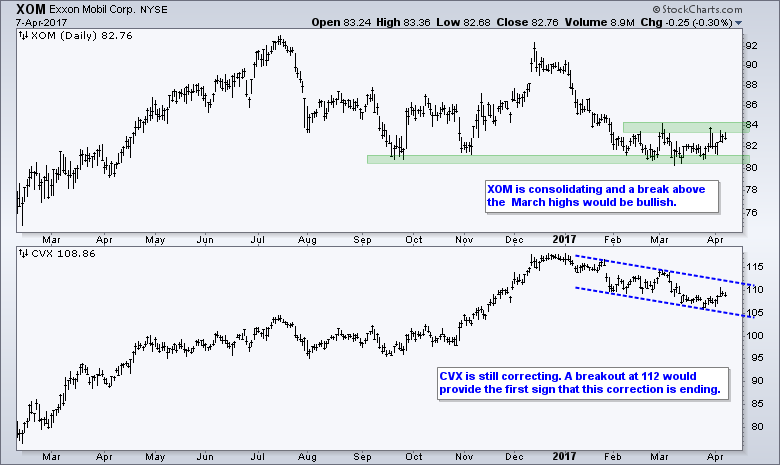
XLE Attempts a Channel Breakout (plus XOM)
The Energy SPDR (XLE) made a bid to break out of its falling channel and RSI exceeded the March highs for a momentum breakout of sorts. It looks like XLE is turning the corner here and a lot will depend on XOM, which accounts for a whopping 23% of the ETF. CVX, the smaller gorilla in the room, accounts for 15.5% of XLE.
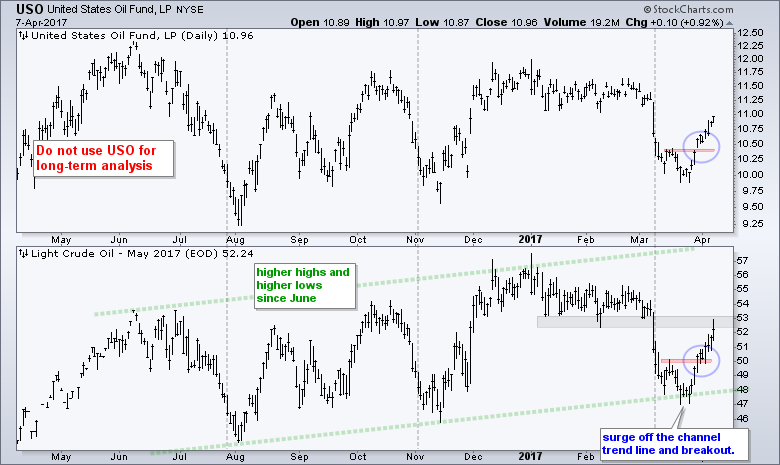
Oil Holds Uptrend with Surge
May Crude (^CLK17) surged off the channel trend line with a move to the low 50s over the last two weeks. This breakout is bullish and keeps the long-term uptrend alive. Short-term, we could see some resistance from broken support in the 52-53 area. Long-term, my target is towards the upper channel trend line in the upper 50s.
TLT Challenges Consolidation Resistance
The 20+ YR T-Bond ETF (TLT) attempted a break above consolidation resistance this week and failed to hold the breakout. Long-term, I still think the trend is down and this is a consolidation within that downtrend. The consolidation highs mark a clear resistance level at 122 and chartists should watch the swing within the consolidation. A move below 120 would break short-term support and reverse this upswing. Such a move would be bullish for banks and stocks, but bearish for gold.
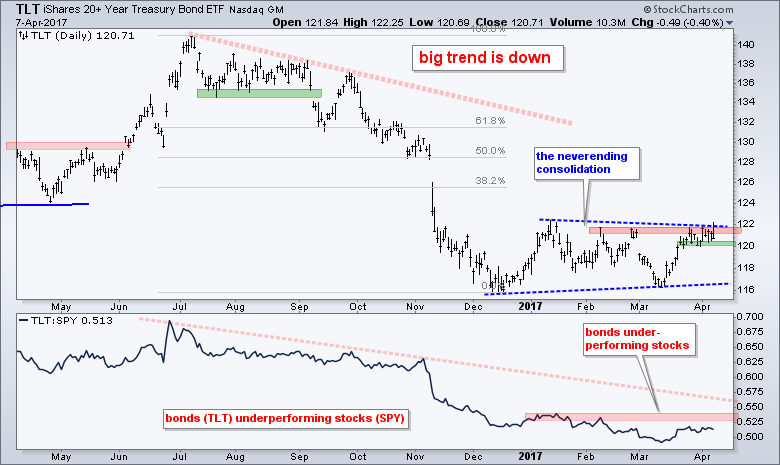 Even though I think this is a bearish consolidation within a bigger downtrend, there is always a chance of an upside breakout that could throw cold water on my thinking. A close above 122 would be bullish and target a move to the 128 area (50% retracement). Such a move would be bearish for banks and stocks, but bullish for bullion.
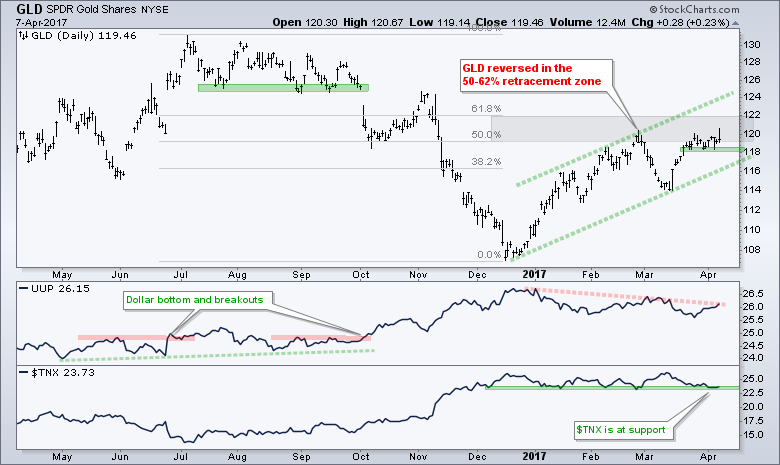
Gold Stalls near Prior High
Gold had a chance to move higher this week, but a bounce in the Dollar kept the bullion in check. Overall, GLD stalled in the 118-121 area the last two weeks. This is a potential reversal zone marked by the prior high and the 50-61.8% retracement zone. A close below first support at 118 would provide the first sign of a short-term reversal.
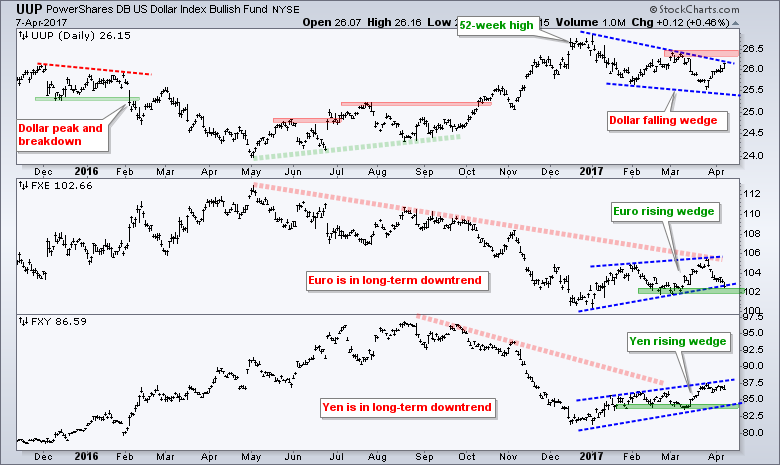
Watching the Wedges for the Dollar, Euro and Yen
The US Dollar ETF (UUP) chart shows a battle of the wedges. UUP is in a falling wedge that looks like a correction after a 52-week high. The Euro ETF (FXE) and the Yen ETF (FXY), on the other hand, formed rising wedges over the last three months. I will be watching these wedges for breaks to reverse their immediate trends. For example, watch 26.5 for an upside breakout in the Dollar ETF.
 ******************************************************
Spotting Pullbacks and Upturns within an Uptrend using RSI and MACD Histogram.
Difference between EMA and SMA - Using %Above 200-day EMA for Breadth Analysis.
Backtesting Different Moving Average Pairs with SPY, QQQ and IWM.
ETF Master ChartPack - 300+ ETFs organized in a Master ChartList and in individual groups.
Follow me on Twitter @arthurhill - Keep up with my 140 character commentaries.
****************************************
Thanks for tuning in and have a good day!
--Arthur Hill CMT
Plan your Trade and Trade your Plan
*****************************************


