.... SPY Remains with Bearish Bollinger Band Signal
.... QQQ Counters with Bullish Band Signal
.... GOOGL Springs to Life - Plus FB, AMZN, AAPL, MSFT
.... A Year of Frustration for IJR
.... Airlines Remain Strong Overall
.... Stocks: CTRL, FEYE, SQ, TDC, MDT and MRK ....
The major stock indices are downright boring right now and this is reflected in the BandWidth indicator. The chart below shows SPY with the Bollinger Bands in pink and BandWidth in the indicator window. Notice that BandWidth dipped below 2 over the past week. This means the distance between the Bollinger Bands is narrowing and volatility is contracting. As far as signals, Bollinger Bands trigger when there is a band break after the bands contract. I would suggest that we are on a bearish signal since March 21st. This is when BandWidth dipped below 2 and price closed below the lower Bollinger Band. Not much has happened since this signal and this signal has yet to be proven otherwise. Actually, a second signal triggered on Friday with the close below the lower band.
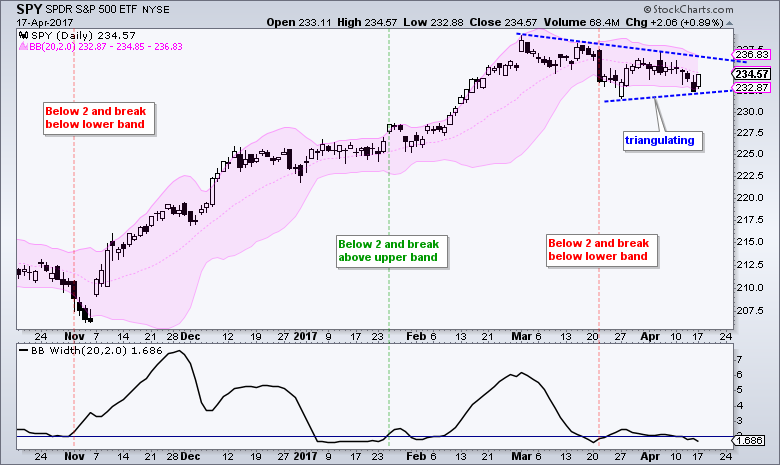
Separately, SPY could be forming a triangle consolidation on the price chart. This is typically a bullish continuation pattern that marks a rest after an advance. SPY made its first move towards a breakout with the bounce on Monday. Also note that RSI(5), which is not shown, moved above 30. This bounce certainly looks well and good for a mean-reversion trade and early jump on the breakout. A follow through move above 237 would break the upper Bollinger Band and triangle line.
Even though a bullish setup is in the making, I am still in the correction camp and this makes me suspicious of short-term bullish setups or signals. I believe we will see more correction because I have yet to see a strong enough catalyst to suggest an end to the correction. I provided some bullish stock setups at the end of this commentary, but these too should be treated carefully because we are in earnings season and in the midst of a correction.
QQQ Counters with Bullish Band Signal
In contrast to SPY, QQQ is on a bullish signal for the Bollinger Band squeeze. Notice that BandWidth dipped below 3 in mid March and the ETF closed above the upper band a few days later. BandWidth remains below 3 and QQQ continues to move sideways. This signal, however, has yet to be negated with a close below the lower band. The setting for low Bandwidth is a judgment call. Based on historical observation, I thought 2 was good for SPY and 3 for QQQ.
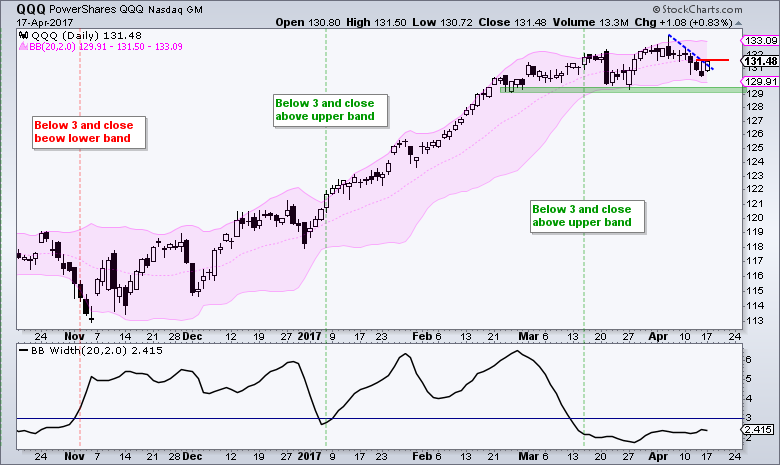
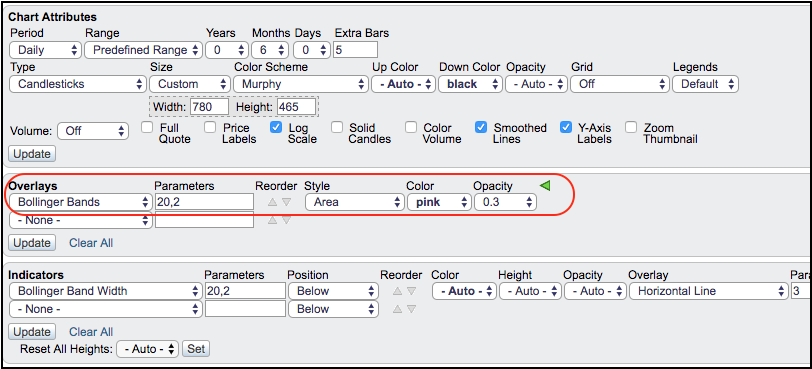
The blue trend line marks the downswing over the last eight days and the red line marks resistance at 131.50. A break above this level would reverse the small downswing and suggest that QQQ will make an attempt at a new high. The image below shows the SharpChart settings used to display the Bollinger Bands as a shaded area.
GOOGL Springs to Life - Plus FB, AMZN, AAPL, MSFT
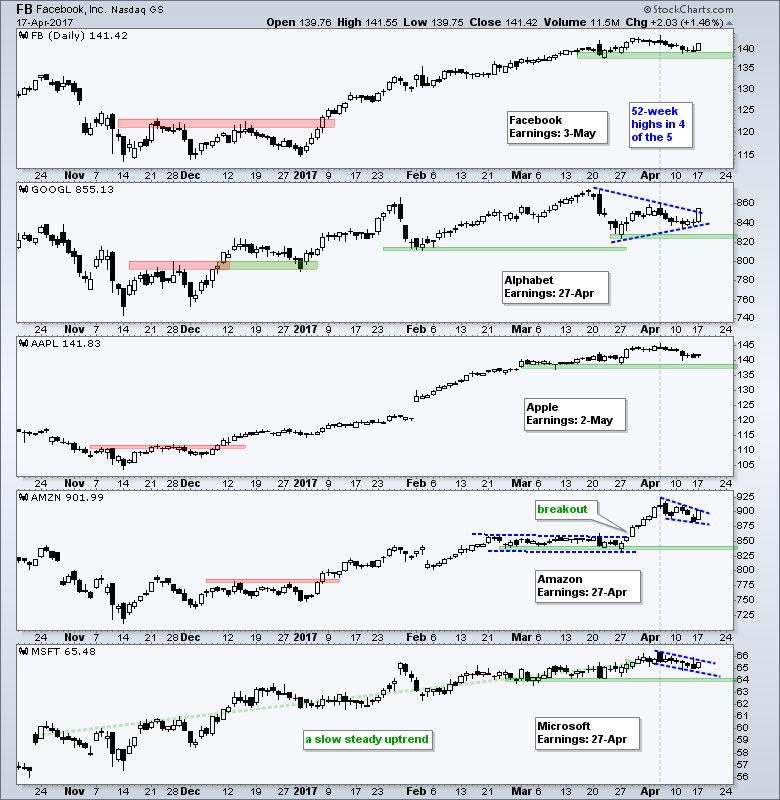
QQQ is only as strong as the Fab Five (Facebook, Alphabet, Amazon, Apple and Microsoft - FAAAM). These stocks report earnings between 27-Apr and 3-May so we can expect some fireworks soon. All five are in long-term uptrends and four of the five hit 52-week highs on 5-Apr. GOOGL was the weakest of the lot, but the stock turned up sharply yesterday. AMZN is the strongest and has a bullish pennant working. MSFT has a very slow and steady uptrend since November. It is boring, but certainly not bearish.
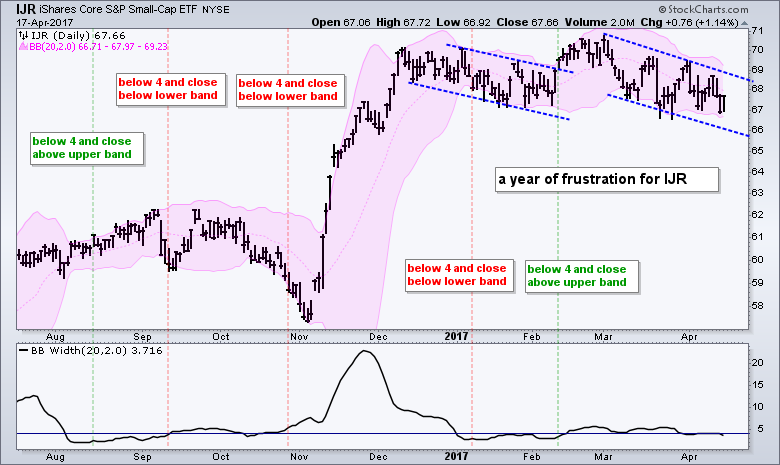
A Year of Frustration for IJR
The next chart shows the S&P SmallCap iShares (IJR) with the Bollinger Bands and BandWidth. Notice that I chose 4 as the level for low BandWidth and the indicator has been hovering around this level the entire year. This reflects the fact that IJR has gone nowhere in 2017. It looked like a breakout was underway in mid February when the ETF closed above the upper band and broke channel resistance, but this failed to hold as IJR fell back to the 67 area. Another channel is taking shape with resistance marked around 69.
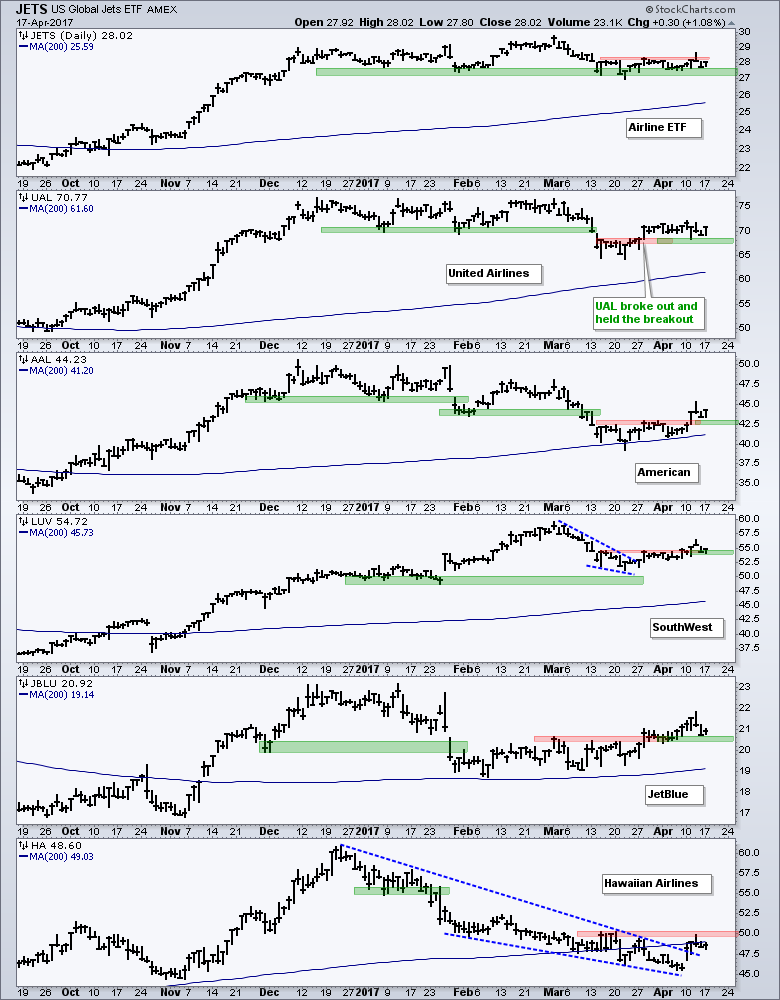
Airlines Remain Strong Overall
The next chart shows the Airline ETF (JETS) and five airline stocks. First, note that SPY is down around 1% over the last four weeks and four of these stocks are up more than 3% over this same period (AAL, UAL, JBLU, LUV). These four are also above their rising 200-day SMAs. On the price charts, note that these four broke resistance levels and these breakout zones turned into support (red-green shading). HA is the only one that has yet to break resistance and move above its 200-day SMA. The stock surged last week and stalled for four days. Look for a follow through breakout at 50 to reverse the falling wedge.
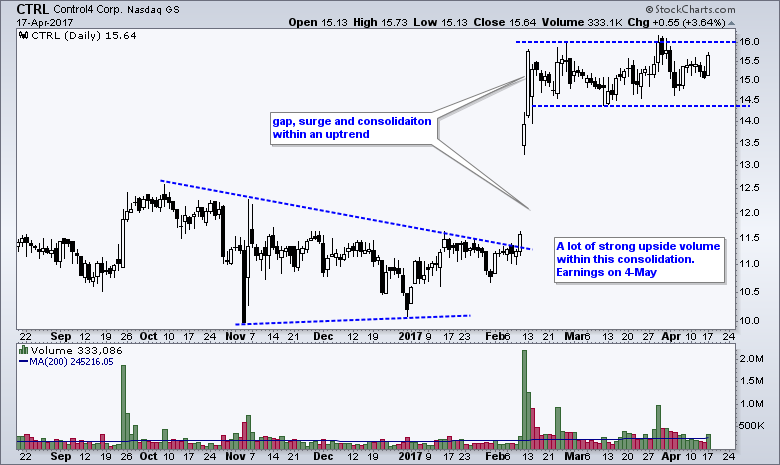
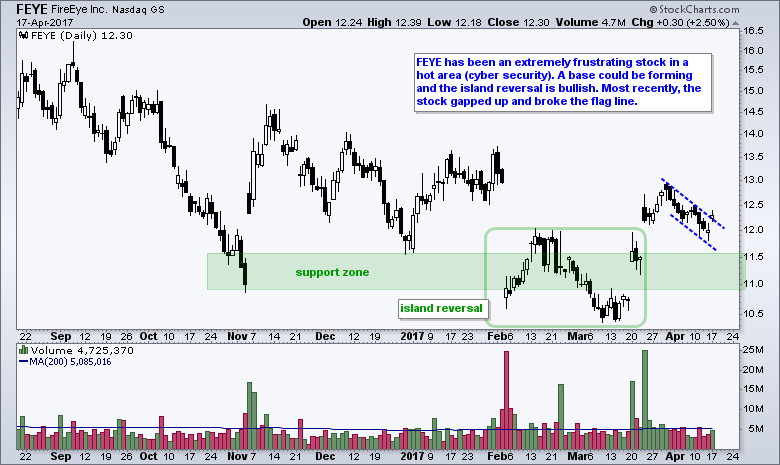
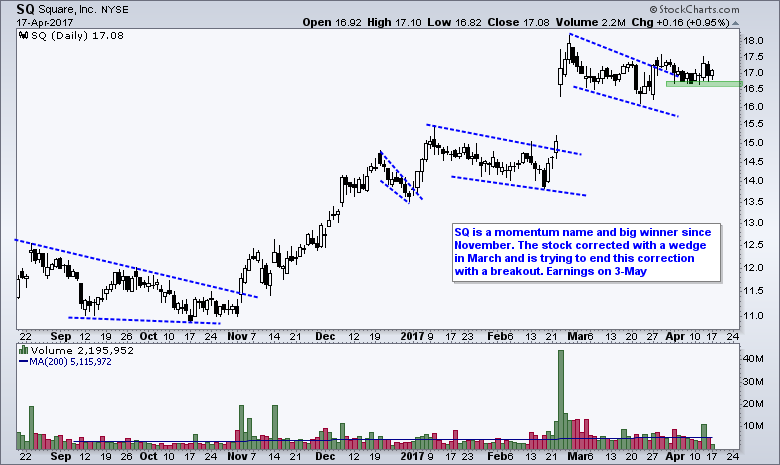
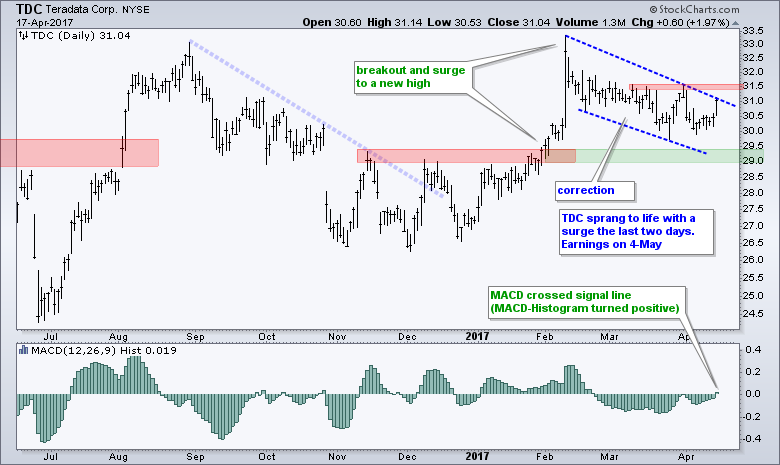
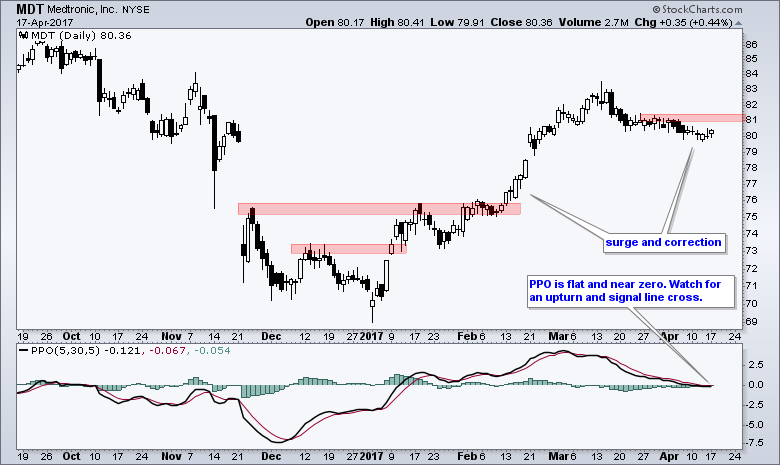
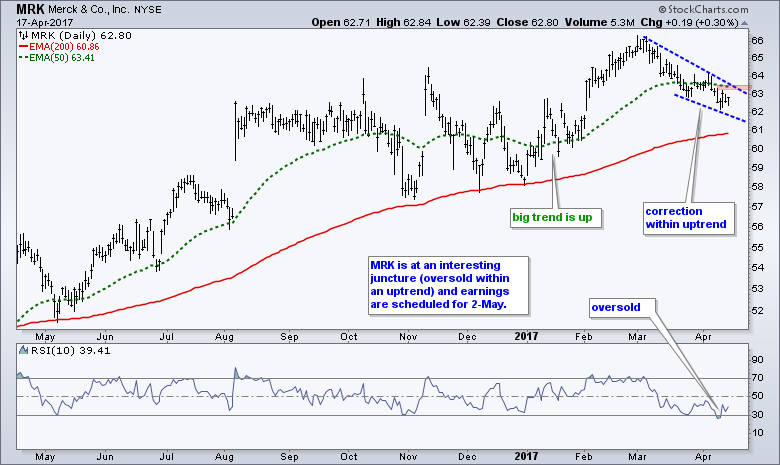
Stocks: CTRL, FEYE, SQ, TDC, MDT and MRK
******************************************************
Spotting Pullbacks and Upturns within an Uptrend using RSI and MACD Histogram.
Difference between EMA and SMA - Using %Above 200-day EMA for Breadth Analysis.
Backtesting Different Moving Average Pairs with SPY, QQQ and IWM.
ETF Master ChartPack - 300+ ETFs organized in a Master ChartList and in individual groups.
Follow me on Twitter @arthurhill - Keep up with my 140 character commentaries.
****************************************
Thanks for tuning in and have a good day!
--Arthur Hill CMT
Plan your Trade and Trade your Plan
*****************************************


