----- Video Link ----- Art's Charts ChartList (updated 14-Apr) -----
Note that the Art's Charts ChartList has been updated with 30 annotated charts covering the industry group ETFs. Not all of these charts are covered in the written commentary. See the video timeline (above) for details.
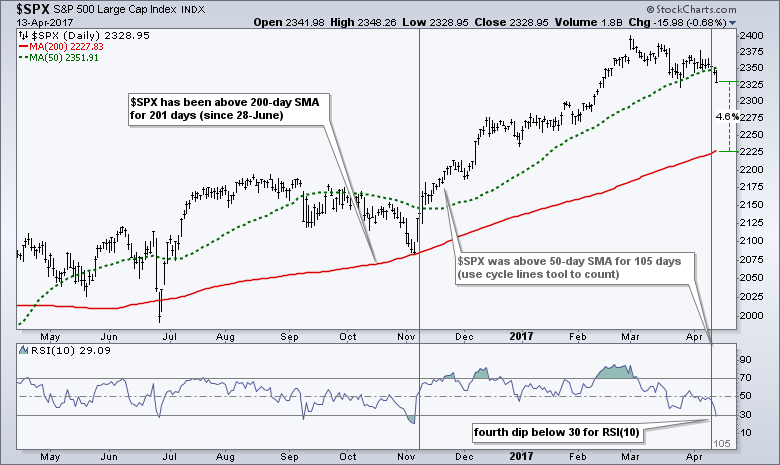
S&P 500 Breaks 50-day SMA Streak
Stocks took it on the chin this past week with the S&P 500 closing below its 50-day SMA for the first time since November 8th. Even so, the index is still less than 3% from an all time high and 4.6% above its rising 200-day SMA. For those keeping score at home, note that the S&P 500 has been above the 200-day SMA for 201 days now. A close below the 50-day SMA, however, does not mean that much. Statistics suggest that the index has a tendency to close lower one week later and higher one month later.
Overall, I am still in the correction camp for the broader market. I moved into this camp with a commentary on March 22nd and re-affirmed this stance in the Weekly Review on Friday, March 24th. My correction thesis is based on breadth signals, momentum breakdowns and relative weakness in small-caps. The breadth indicators for the S&P 1500 are shown below for reference and the links under this chart explain the indicators.
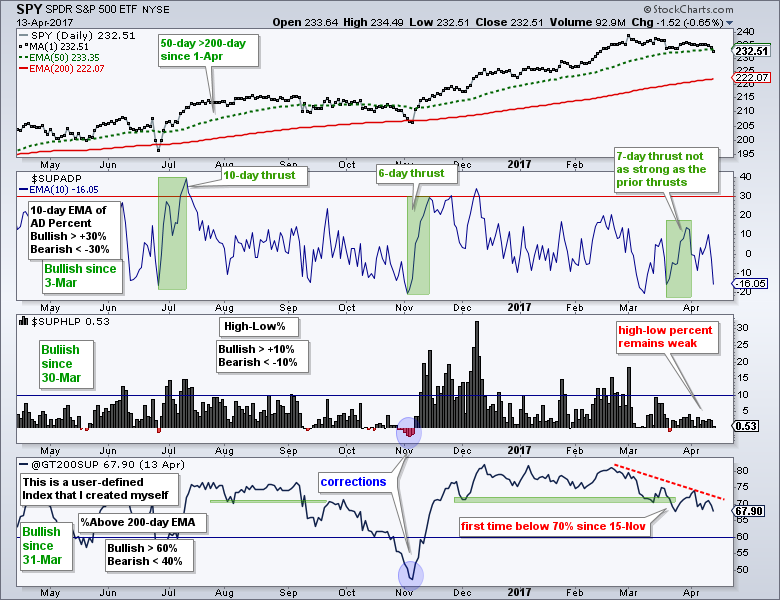
Related Links: How to create a user-defined index (@GT200SUP).
Understanding the AD Percent Indicators, High Low Indicators and %Above 200-day EMA Indicators.
I do not know how long this correction will extend or what form it will take. Assuming this correction extends, I would expect most stock indexes, sectors and industry groups to remain under pressure. There were be a few that buck the trend, but the majority will follow the broader market. This means we could be in for a difficult trading environment over the next few weeks, perhaps months. The long-term trends are up, but the short-term trends are down for the S&P 500, S&P MidCap 400 and S&P Small-Cap 600. This puts traders between a rock (long-term uptrend) and a hard place (correction), and means discretion may be the better part of valor for the next few weeks.
Correction Targets for SPY
It is pretty amazing that even with a strong sell off in the final hour on Friday the S&P 500 SPDR (SPY) still only declined .65% on the day. Overall, SPY peaked in early March and formed a series of lower highs the last six weeks. The ETF is still less than 3% from an all time high, but is clearly in corrective mode right now. Notice that a small rising wedge formed from late March to early April and the ETF broke wedge support with the decline over the last three days. This signals a short-term continuation lower and a resumption of the correction. The early April high marks first resistance at 237.5.
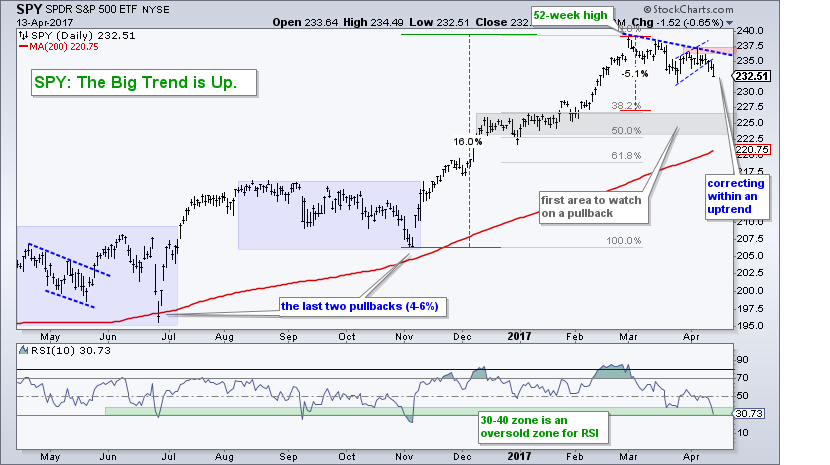
Being in the correction camp, I am targeting a move to at least the 223-226 area. Take these levels with a grain of salt because they are guesstimates. A 5% pullback and 38% retracement would extend back to the top of the December-January consolidation. A 50% pullback would near the low of this consolidation (gray zone). In the worst-case scenario, there is always a chance that the correction extends back to the rising 200-day SMA and 61.8% retracement. And finally, RSI(10) is nearing oversold and this usually means I should be on alert for a bounce or bullish reversal. Instead of an alert, I am calling an audible here and ignoring short-term oversold conditions because I think the market is currently correcting and that correction has yet to end.
QQQ Holds Above Support Despite Failure Swing
QQQ continues to hold above first support in the 129-130 area and is the only major index that has yet to embark on a correction. Nevertheless, I am calling for a correction in QQQ because of my broad market stance and because of the RSI signals. First, RSI was overbought for an extended period and then moved below 50 on 21-March (red line). Even though QQQ moved to a new high after this signal, the loss of momentum is clear and RSI continues to weaken.
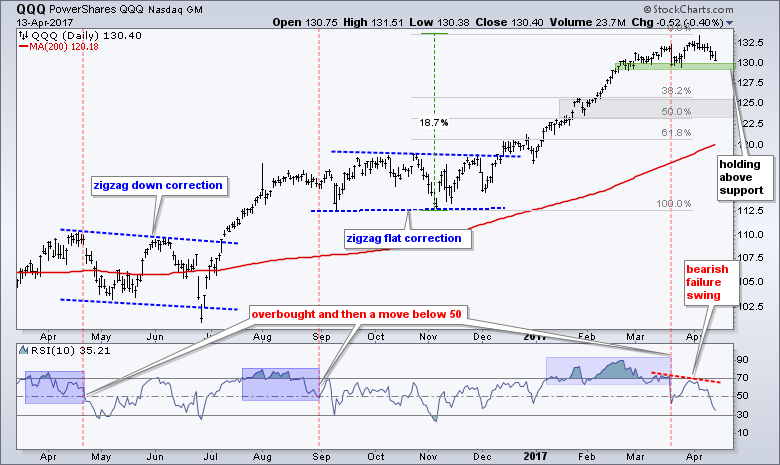
As noted last week, RSI also formed a bearish failure swing, which is a signal/pattern identified by Wells Wilder, creator of RSI. Note that a bearish failure swing is NOT the same as a bearish divergence, even though a bearish divergence is also formed. The bearish failure swing is independent of price. A bearish failure swing occurs when RSI exceeds 70, declines below 70, bounces, fails to exceed 70 on the bounce and then breaks below the low of the bounce. RSI is currently at its lowest level since early November and this means momentum has weakened.
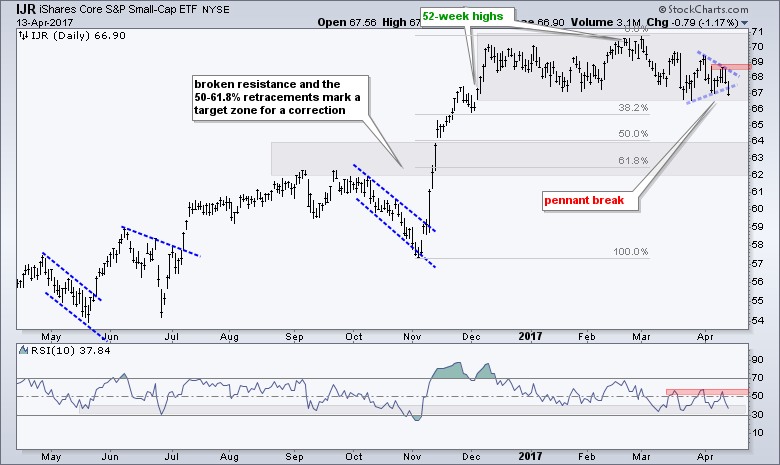
Small-caps Lead Lower with Pennant Break
The S&P SmallCap iShares (IJR) remains the weakest of the big three (QQQ,SPY,IJR). Even so, the ETF is still less than 6% from its all time high. With a sharp decline the last two days, the ETF broke the pennant line and is near the lower end of the four-month consolidation. As long as my broad market view is for more correction, I would expect IJR to weaken further and the downside target is the 62-64 area. Broken resistance and the 50-61.8% retracement zone define this area. A break above 69 in IJR and 60 in RSI would call for a reassessment.
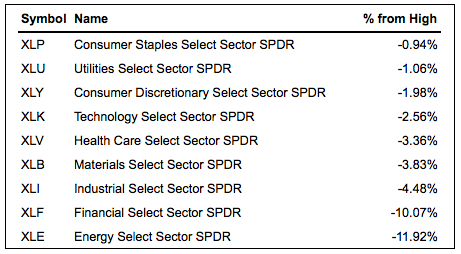
Ranking the Sectors by Percent below High
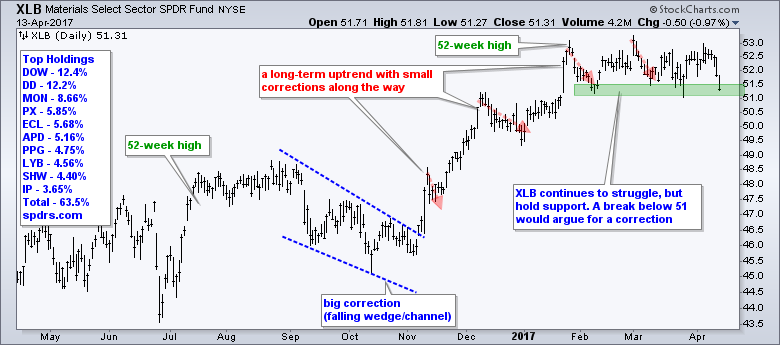
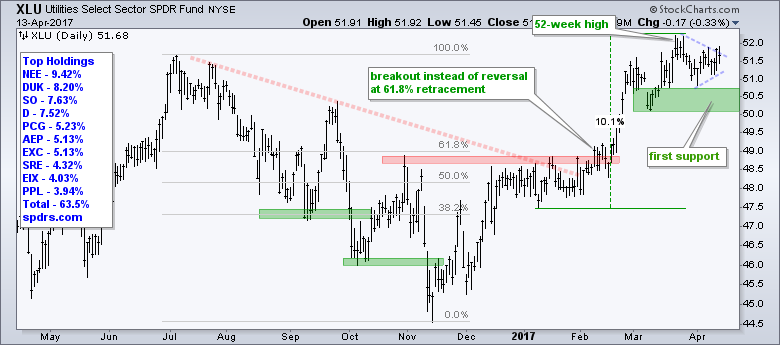
The tables below show how far each sector is below its 52-week high. In other words, how much of an advance is required to reach the 52-week high. This gives us an idea of which sectors are holding up the best and which are leading lower. The first table shows the sector SPDRs, which represent large-caps. Staples and utilities are the closest to their 52-week highs. Energy and finance are the furthest. Notice that seven of the nine sectors are still within 5% of a 52-week high.
The next table shows the equal-weight sector ETFs, which represent the average stock in the S&P 500 sectors. Utilities, healthcare and technology are holding up the best here. Finance and energy are the weakest. It is interesting to see that the average healthcare stock is holding up well.
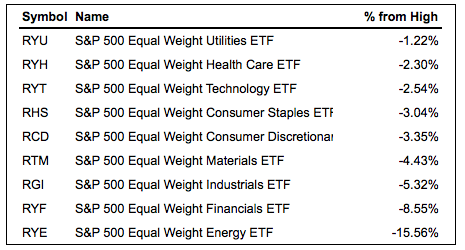
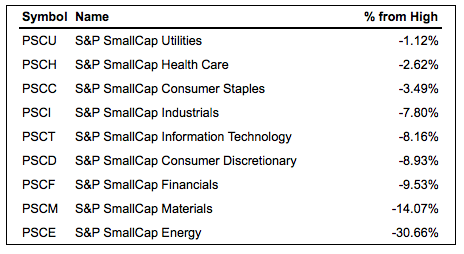
The next table shows the small-caps sector ETFs. Utilities and healthcare are holding up the best. Again, it is interesting to see that small-cap healthcare stocks are holding up well. Materials and energy are faring the worst. Notice that six of the nine small-cap sector ETFs are more than 7% below their 52-week highs. This is why the S&P Small-Cap 600 is lagging the S&P 500.
You can add this line of scan code to the end of your scan to generate this number:
Rank by [[[close - max(260,high)] / close] * 100]
Technology Props up the S&P 500
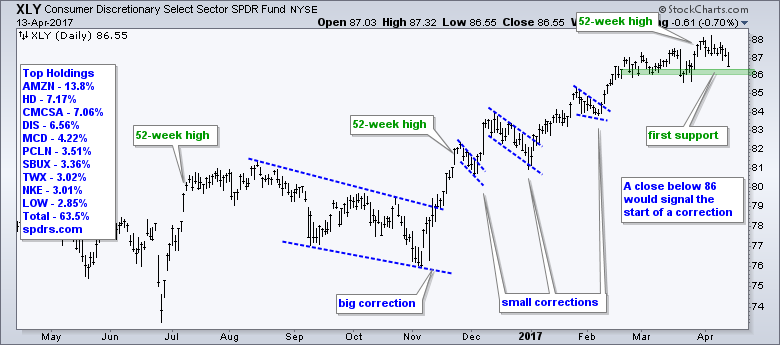
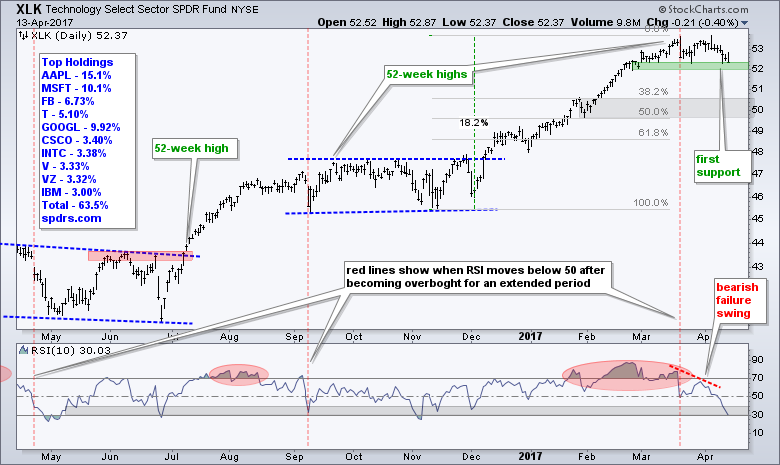
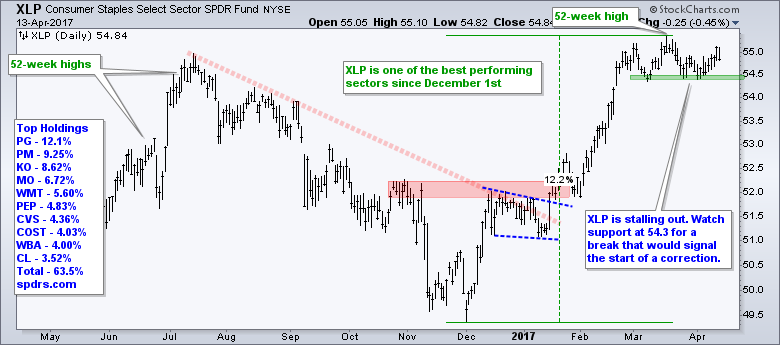
Breaking down the sectors, five are holding above support and these five account for around 52% of the S&P 500. The other four sectors are in corrective mode or downtrends (XLE) and these account for around 45% of the S&P 500. I am still leaving REITs (3%) out of the equation and I am lumping telecom (2.4%) with technology. Overall, it seems that strength in technology and limited weakness in healthcare propped up the S&P 500. As with last week, I am watching the Consumer Discretionary SPDR (XLY), the Technology SPDR (XLK) and the Consumer Staples SPDR (XLP) for breakdowns that would clearly tilt the sector balance to the bears. The first five charts show the sectors that are holding up and the support levels to watch.
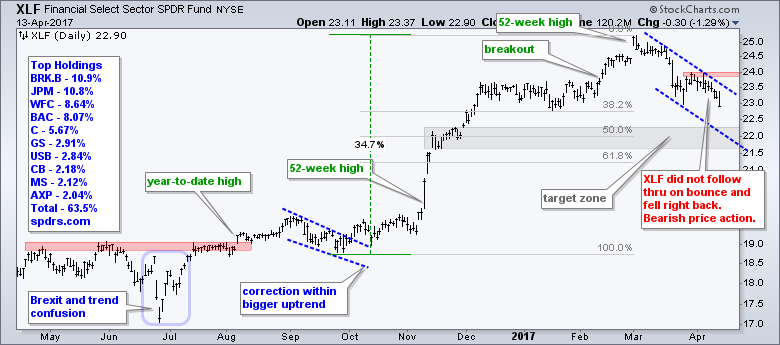
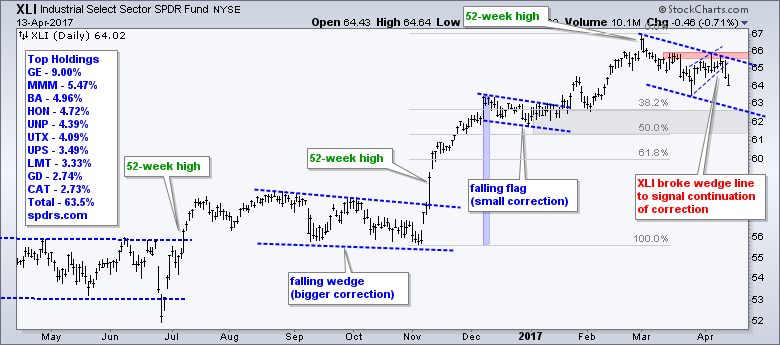
Finance and Industrials Weigh Negative
The Finance SPDR (XLF) and the Industrials SPDR (XLI) are clearly weighing on the market. Both peaked in early March and are in short-term downtrends. Because of the 52-week highs in early March, I view these declines as corrections within a bigger uptrend. Nevertheless, I do not see any signs of firming in either one just yet. XLF led the market lower this week and XLI broke a rising wedge line to signal a continuation of its correction. The gray zones mark target areas for these corrections.
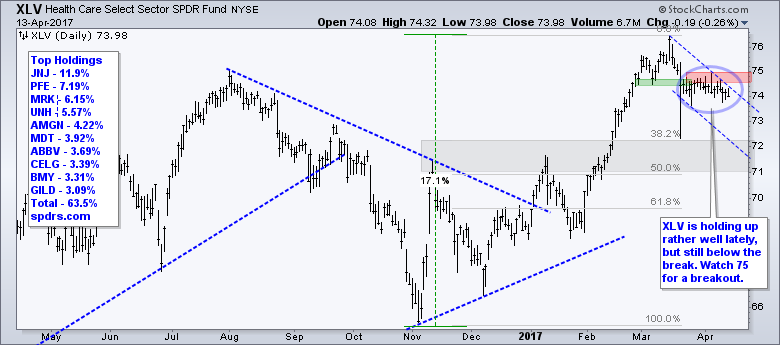
Healthcare Firms Below Support Break
The HealthCare SPDR (XLV) also fell this week and remains below the mid March support break. Nevertheless, I am noticing some firmness the last two weeks and would keep an eye on this defensive sector. It was not too long ago that healthcare was the talk of the town. The ETF led the market in February and hit a new high in mid March. The long-term trend is up and I view this pullback as a correction within the bigger uptrend. Look for a break above 75 to signal an end to this correction.
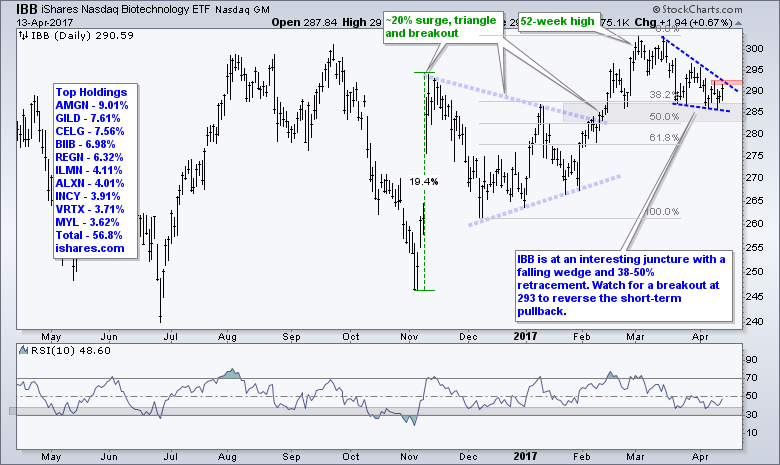
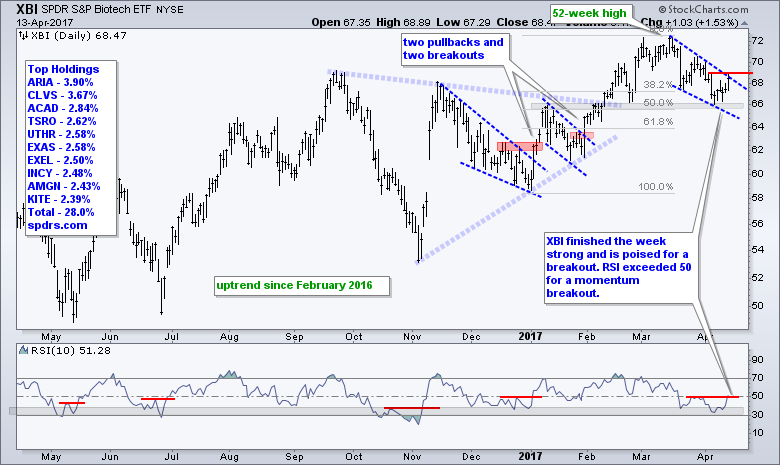
Biotechs Buck the Selling Pressure
The Biotech SPDR (XBI) and the Biotech iShares (IBB) closed up on Thursday and bucked the selling pressure this past week. Strength in the face of broad market weakness is worth further investigation. On the price charts, both hit 52-week highs in Mach and then corrected with falling wedges the last few weeks. The corrections retraced 38.2-50% of the prior move and returned to the breakout area. This is the area to watch for an end to the correction and a resumption of the uptrend. The red lines mark wedge resistance and breakouts here would be bullish.
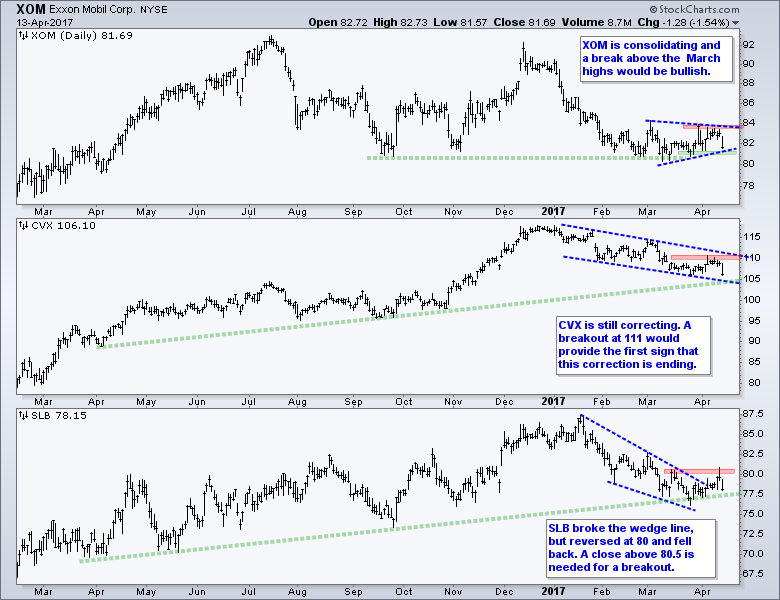
Big Three Weight on XLE
The Energy SPDR (XLE) remains the weakest of the nine sectors. XLE looked prime for a breakout on Wednesday, but fell sharply on Friday and broke the rising wedge line. RSI also failed to hold its breakout.
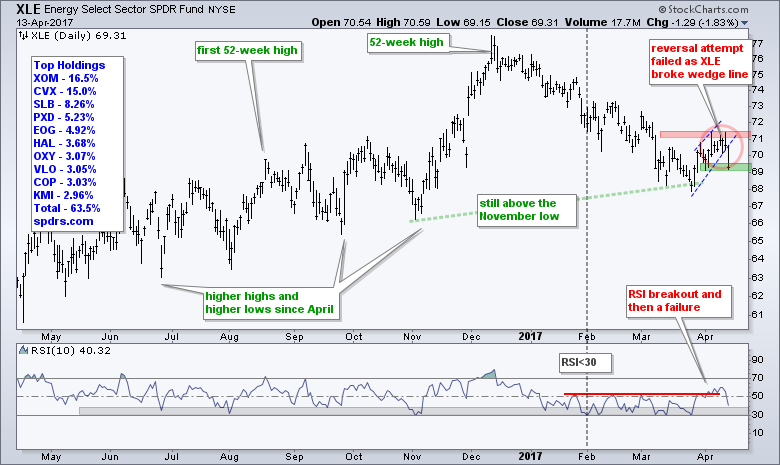
Look no further than ExxonMobil (XOM), Chevron (CVX) and Schlumberger (SLB) for the lackluster performance in XLE. These three stocks account for 46.83%% of the ETF and remain short of breakouts. XOM is the weakest of the three with a triangle forming. A break below 81 would be bearish and a break above 84 bullish. CVX and SLB are correcting and the red zones mark resistance. At the very least, two of the three need breakouts to lift XLE.
Oil Stalls at Potential Reversal Zone
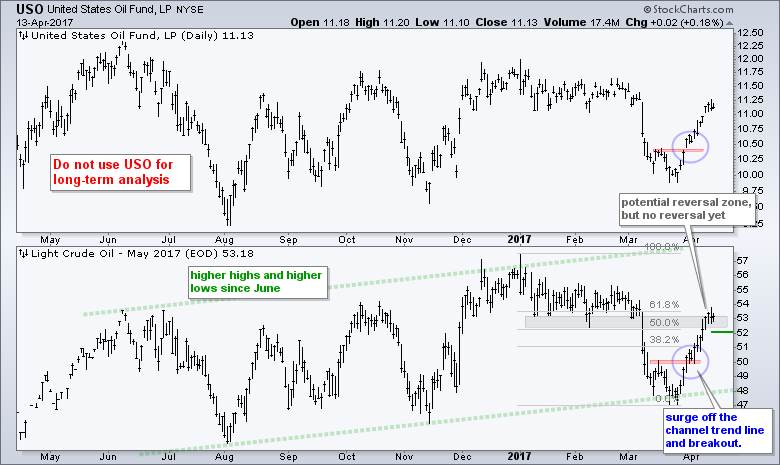
The Oil & Gas Equip & Services SPDR (XES) and Oil & Gas E&P SPDR (XOP) also fell along with XLE, but oil did not fall on Thursday and this makes me wonder if energy-related stocks just got caught up in broad market selling pressure. Perhaps the market threw out the baby with the bath water. A sharp move higher on Monday would suggest that Thursday was an over-reaction.
The chart below shows May Crude Futures (^CLK17) bouncing off the lower trend line of a rising channel and breaking out on March 30th. The channel points to a long-term uptrend and the breakout reversed the January-March downtrend. Oil hit a possible reversal zone (gray) and stalled for two days, but I have yet to see any short-term weakness to suggest a reversal. A close below 52 would suggest a reversal.
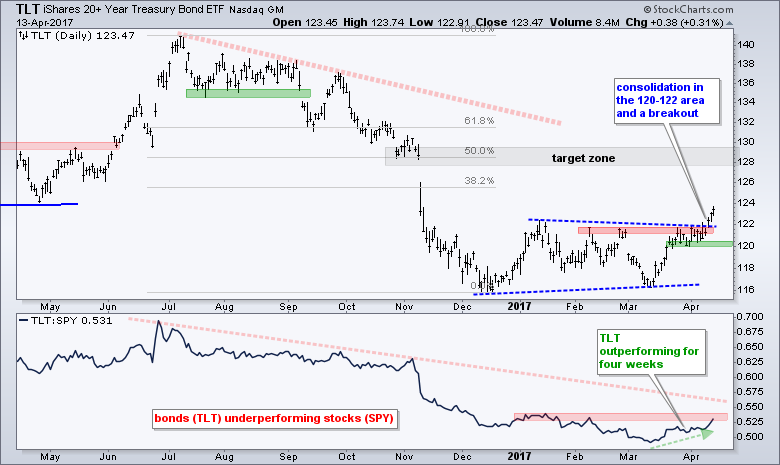
TLT Hits High of the Year (2017)
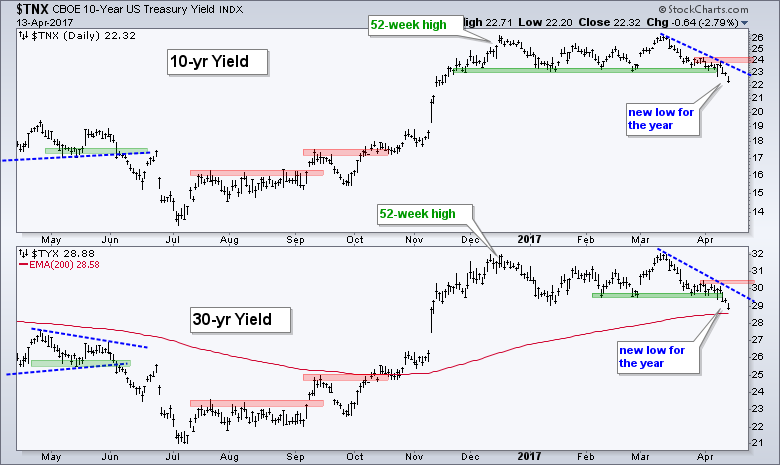
I am not sure if selling pressure in stocks (risk assets) is pushing bonds (safe-haven assets) higher or buying pressure in bonds is driving stocks lower. Either way, the advance and breakout in the 20+ YR T-Bond ETF (TLT) is negative for stocks, especially banking stocks. This means the 10-yr T-Yield ($TNX) is moving lower, which is bullish for utilities, staples, REITs and gold. TLT surged to resistance and consolidated in the 120-122 area. The ETF broke out on Monday and hit a new high for the year. Even though one could argue that the long-term trend is down, this breakout is bullish and the next target zone is in the 128-130 area. Support is set at 120.
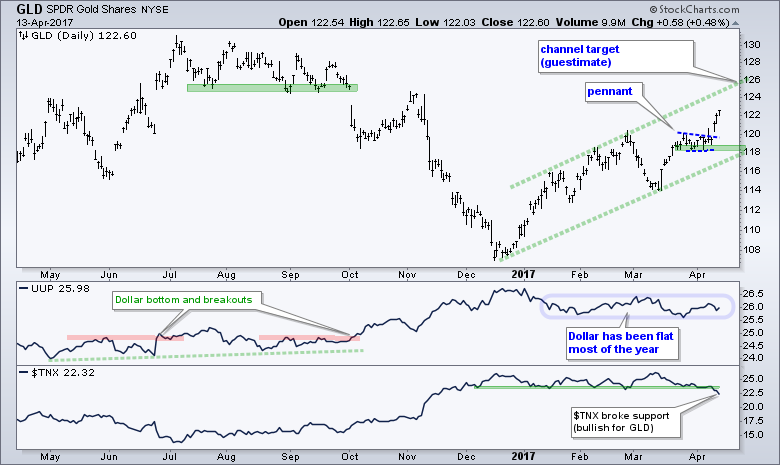
Gold Breaks Pennant and Extends Uptrend
Gold is totally moving in lock step with TLT (positive correlation) and counter to $TNX (negative correlation). The Dollar is on the back burner because it has been flat this month. On the price chart, GLD consolidated with a pennant as TLT consolidated in the 120-122 area. GLD broke pennant resistance on Monday with a gap and this signals a continuation of the late March move. The upper trend line of the rising channel marks a target around 126 and the pennant lows mark support at 118.
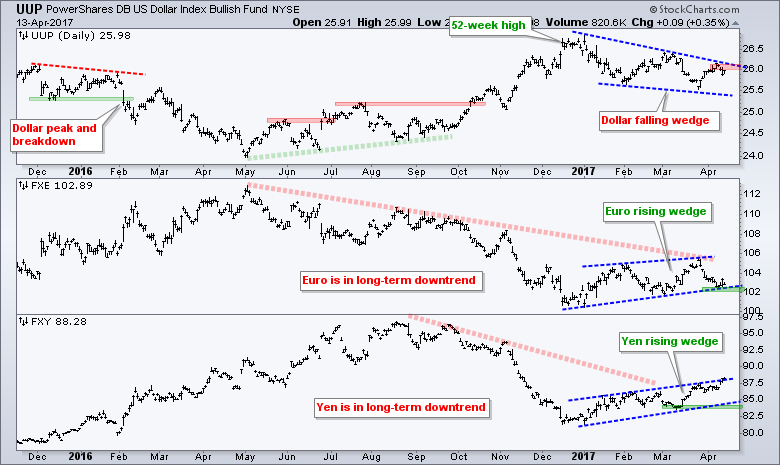
Still Watching the Wedges
As noted before, analyzing the US Dollar ETF (UUP) is like herding cats (a lesson in futility). Notice that UUP was trading around 26 in December 2015 and is now trading around 26, some 16 months later. In the mean time, UUP has been as high as 26.8 and as low as 24. Talk about a snoozer. Overall, I am still bullish on the Dollar long-term and I view the falling wedge as a correction. A breakout at 26.1 would end this wedge and signal a continuation higher. Watch FXE for a confirming break below 102.
******************************************************
Spotting Pullbacks and Upturns within an Uptrend using RSI and MACD Histogram.
Difference between EMA and SMA - Using %Above 200-day EMA for Breadth Analysis.
Backtesting Different Moving Average Pairs with SPY, QQQ and IWM.
ETF Master ChartPack - 300+ ETFs organized in a Master ChartList and in individual groups.
Follow me on Twitter @arthurhill - Keep up with my 140 character commentaries.
****************************************
Thanks for tuning in and have a good day!
--Arthur Hill CMT
Plan your Trade and Trade your Plan
*****************************************


