.... Still in Corrective Mode
.... Newmont Mining Stalls with Pennant
.... Surge in TLT and Bounce in the Dollar Baffles Gold
.... Watch Baker Hughes and ExxonMobil for Clues on Energy Stocks
.... Kellogg and Monster Turn Lower within Downtrends
.... Pfizer and Thermo Fisher Correct after Surge ....
Still in Corrective Mode
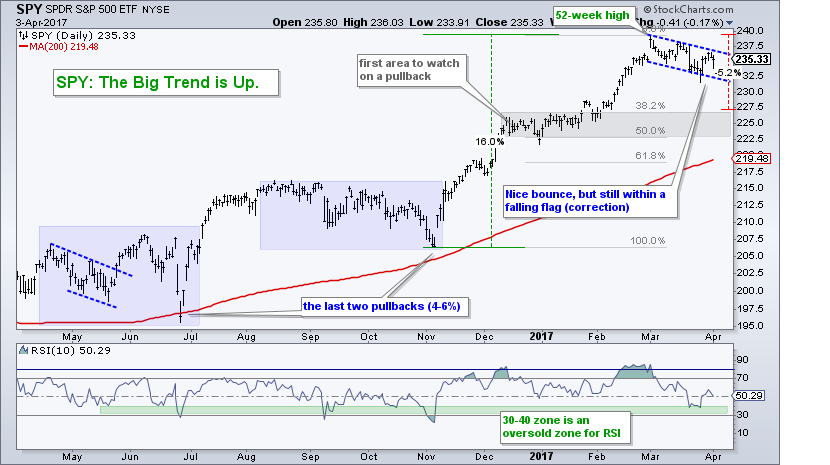
I have a few stocks and setups to show below, but first I should confirm that I remain in the correction camp. The long-term trend for the S&P 500 (market) is up, but I think we are in the midst of a correction within that uptrend. The rationale for this correction call was first detailed in a commentary on March 22nd and I put forth some correction targets on March 24th. We never know how long a correction will last or how far it will extends. The last two shaved around 5% from the S&P 500 SPDR and lasted two to three months. They were actually quite choppy affairs as the index moved sideways most of the time. I am using the S&P 500 SPDR to monitor the correction targets. The minimum expectation is a 5% pullback from the highs or a 38% retracement (227). The maximum is a return to the rising 200-day EMA or a 61.8% retracement (220). Note that most stocks and equity ETFs follow the S&P 500 so it would be a difficult period for trading should the current correction deepen.
Newmont Mining Stalls with Pennant
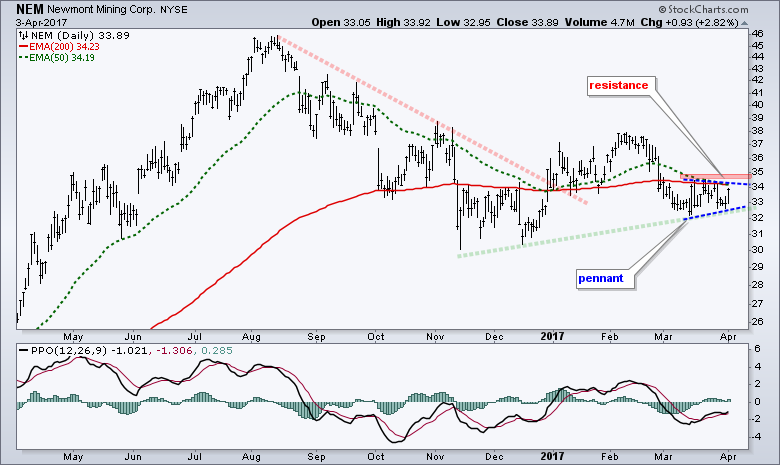
Newmont Mining (NEM), a gold stock, is stuck in a consolidation and I am watching the boundaries for the next directional clue. The stock traded quite flat since December and recently formed a pennant consolidation after a sharp decline in early March. A move below last week's lows would break pennant support and signal a continuation lower. On the upside, the stock established resistance in the 34-35 area and a breakout would be bullish. Notice that MACD is rising and above its signal line.
Surge in TLT and Bounce in the Dollar Baffles Gold
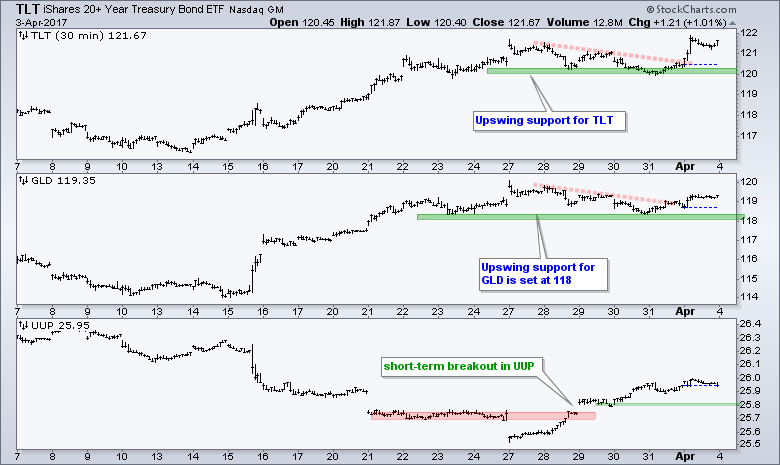
Gold will likely dictate the next move for gold stocks and it could be a wild week because the bond market is in focus. Several Fed representatives are speaking this week and there are a slew of economic reports. The 20+ YR T-Bond ETF (TLT) and the US Dollar ETF (UUP) clearly affect gold so we should watch these two for clues. The chart below shows 30-minute bars to focus on the short-term trends. TLT surged off its support zone on Monday and remains in a short-term uptrend as long as this level holds. This is positive for gold and a break below 120 would reverse the short-term uptrend. The US Dollar ETF (UUP) turned up over the last five days and this is negative for gold. However, the rise in TLT and decline in the 10-yr T-Yield overshadowed the bounce in the greenback. The Gold SPDR (GLD) bounced off the 118 area for the second time in two weeks and this is the level to watch, a break of which would reverse the short-term uptrend in GLD.
Watch Baker Hughes and ExxonMobil for Clues on Energy Stocks
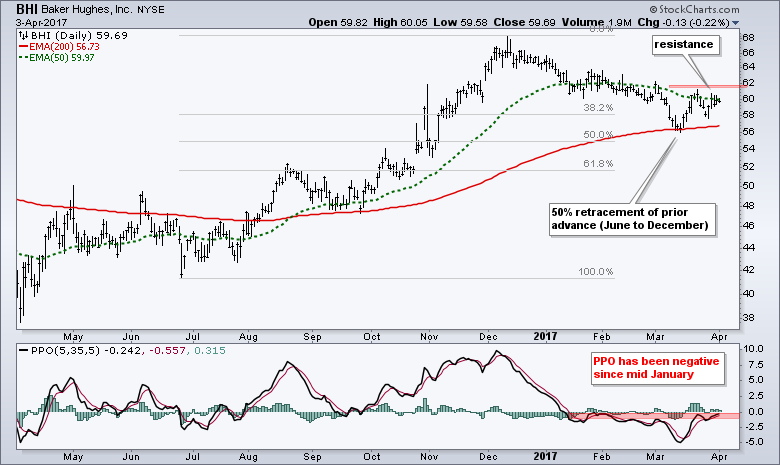
Oil got a pop last week and lifted energy-related shares. The sustainability of these bounces is tied to oil so chartists should keep a close watch on crude. Baker Hughes is a key component for the Oil & Gas Equipment & Services SPDR (XES) and ExxonMobil (XOM) is the biggest component for the Energy SPDR (XLE). In fact, XOM accounts for a whopping 22.97% of XLE. Breakouts in both would bode well for their respective ETFs and for energy-related stocks in general. After hitting a 52-week high in December, BHI retraced around 50% of the prior advance (June to December) with a correction back to the 56 area. The stock firmed for a few weeks and I would watch 62 for a breakout that would signal an end to the correction.
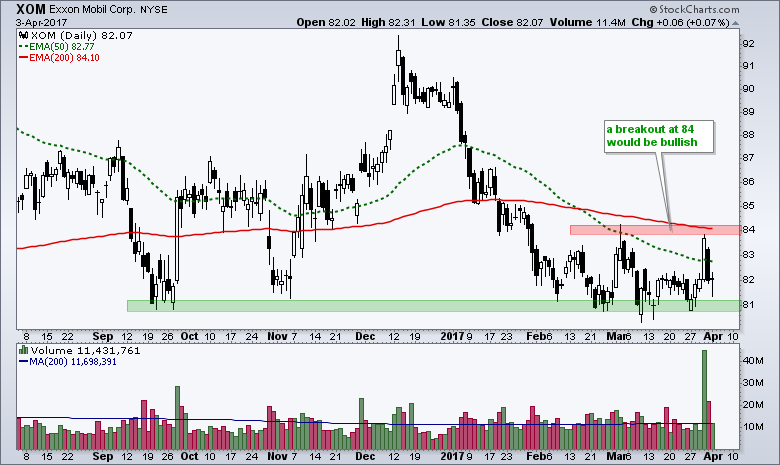
XOM fell sharply from mid December to early February and then consolidated near the September-November lows. Trading has been extraordinarily choppy the last two months as the stock struggled for direction. Last week's surge above 84 occurred on the highest volume in over a year, but the stock did not follow through and fell back. This established 84 as the level to beat for a bullish breakout.
Kellogg and Monster Turn Lower within Downtrends
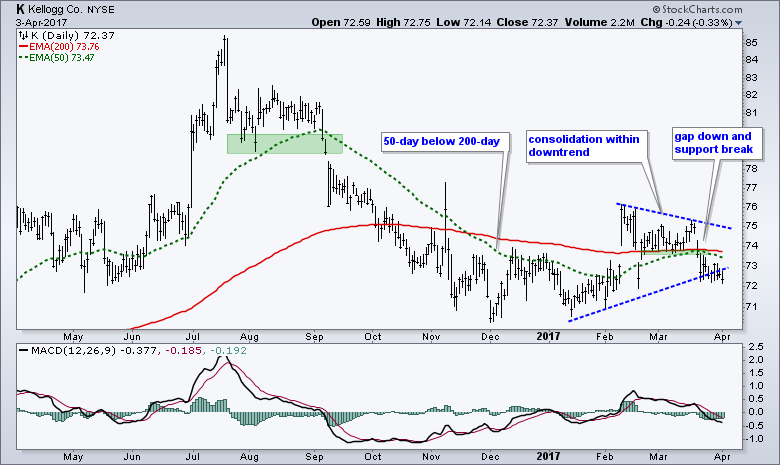
The next two stocks come from the consumer staples sector and they are looking bearish. First, note the 50-day EMA is below the 200-day EMA for both stocks, which implies that they are in long-term downtrends. The first chart shows Kellogg gapping down, breaking a short-term support level and moving below the triangle trend line. The indicator window shows MACD moving into negative territory.
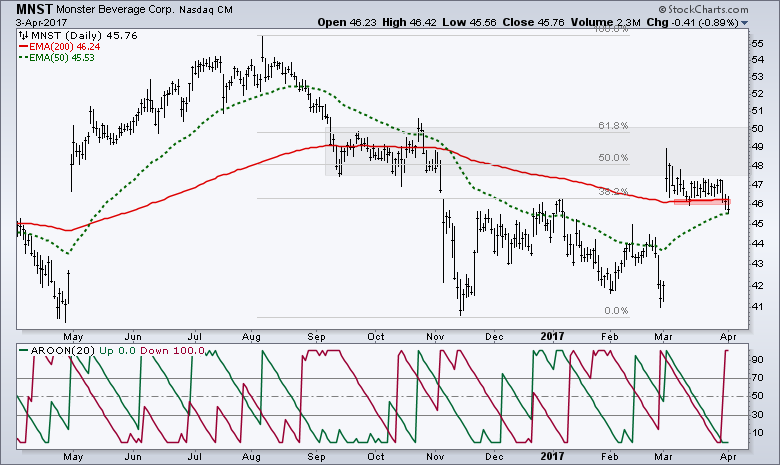
The second chart shows Monster Beverage (MNST) gapping up in early March, but failing to follow through on this surge. The stock consolidated after the gap and then broke support with a decline the last two days. Notice that Aroon Up and Aroon Down fell in parallel fashion and both moved below 20. This happens when there is a consolidation on the chart. Aroon Down surged above Aroon Up and hit 100 last Friday. This indicates that there was a bearish resolution to the consolidation. Note that Tushar Chande, creator of Aroon and StochRSI, now has a blog here at StockCharts.
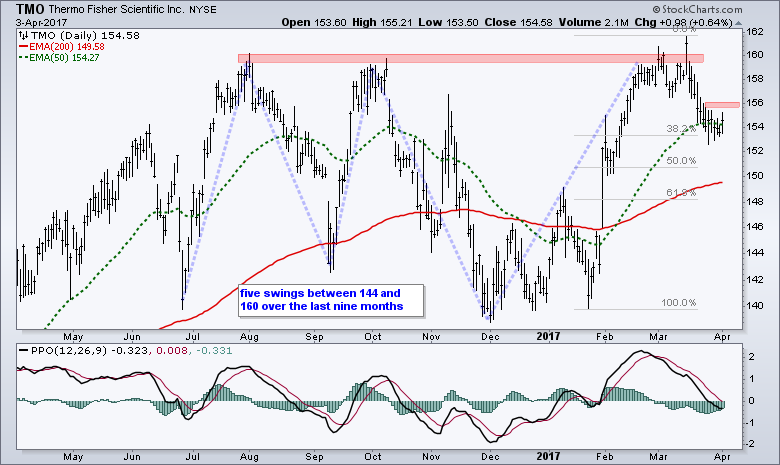
Pfizer and Thermo Fisher Correct after Surge
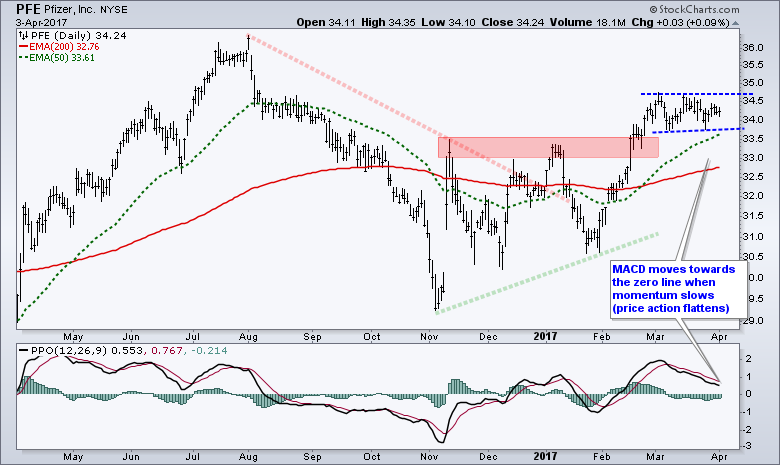
The next two stocks come from the healthcare sector, but are in different business segments. Pfizer is the big pharma company and Thermo Fisher makes analytical equipment. Pfizer (PFE) broke out with a big surge in February and then consolidated with a trading range. Look for an upside breakout to signal a resumption of the uptrend. The indicator window shows the PPO gravitating back towards the centerline (0) as PFE consolidates. This is normal because momentum slows when price action flattens. A move back above the signal line would show an upturn in momentum.
Thermo Fisher (TMO) surged to resistance from late January to early March and then fell back the last few weeks. This decline is steep, but the stock is entitled to a correction after a big surge. The stock is now stalling near the 38% retracement and the PPO is just below the zero line. Look for an upturn in the PPO and signal line cross to turn bullish on momentum again. Look for price to exceed 156 for a breakout.
******************************************************
Spotting Pullbacks and Upturns within an Uptrend using RSI and MACD Histogram.
Difference between EMA and SMA - Using %Above 200-day EMA for Breadth Analysis.
Backtesting Different Moving Average Pairs with SPY, QQQ and IWM.
ETF Master ChartPack - 300+ ETFs organized in a Master ChartList and in individual groups.
Follow me on Twitter @arthurhill - Keep up with my 140 character commentaries.
****************************************
Thanks for tuning in and have a good day!
--Arthur Hill CMT
Plan your Trade and Trade your Plan
*****************************************


