.... Universe and Trend Filter
.... Bollinger Band Setup Code
.... StockRSI Trigger Code
.... Rate-of-Change Sort Code
.... Scan Code in Full
.... TTM Technologies Setup and Signal
.... Conclusions and Suggestions ....
Scan Code for Bollinger Band Squeeze
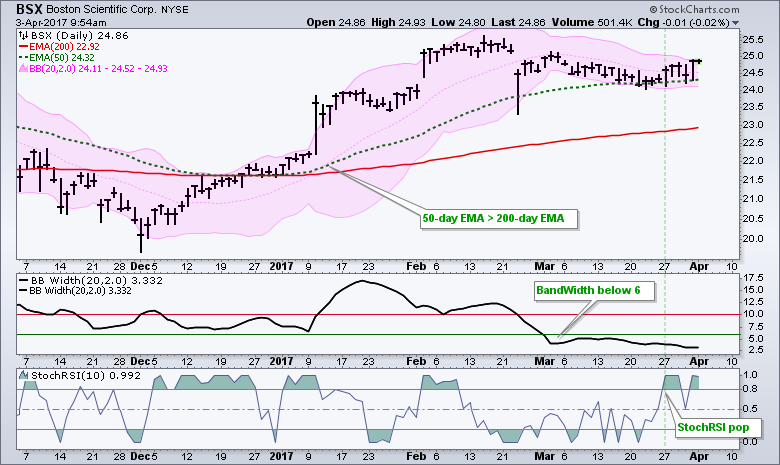
This article will focus on the scan code for last week's System Trader article featuring the Bollinger Band Squeeze. In addition to ready-to-use scan code, I will also explain the method behind the madness and share some coding techniques that can be applied to other scans. There are four parts to this scan. First, we select the symbol universe and add a basic trend filter. Second, we scan for the setup, which is the Bollinger Band squeeze. Third, we scan for the trigger or signal, which is the pop in StochRSI. Fourth, we add a "Rank by" function to sort the results. The chart below shows BSX with these indicators and the key levels.
Universe and Trend Filter
First, we select the symbol universe and filter for uptrends. There are two code lines shown below with explanations just above the code. Each code line acts as a filter to narrow down the symbol universe in our database. Notice that the explanations start with two forward slashes. The text following the two forward slashes is ignored by the scan engine and is used for explanation notes.
In the example above, each individual filter is enclosed with brackets [Group is SP500]. The first three filters are then enclosed by brackets (red) and separated by "or". I enclosed this entire line with brackets to ensure that these arguments are grouped. The next line of code ensures that the stock is in a long-term uptrend.
// stock's 50-day EMA is above 200-day EMA
[EMA(50,close) > EMA(200,close)]
Bollinger Band Setup Code
The next part of the scan produces the setup. The Bollinger Band squeeze uses the BandWidth indicator to find stocks with narrow Bollinger Bands. Unfortunately, not all stocks are equal when it comes to volatility. A utility stock, such as Southern (SO), will have lower volatility than a high growth stock such as Netflix (NFLX). This means the definition of low BandWidth will likely be different for these two stocks. I will, therefore, show two different methods to find narrowing Bollinger Bands (low BandWidth).
The first method looks for the 10-day low of BandWidth (20,2) to be below the lowest BandWidth value of the prior 115 days. The "Min" function is used to find the lowest value. For example, [Min(10,close)<50] would find stocks that had a value below 50 at some point over the last 10 days.
// The low of BandWidth over the last 10 days
// is below the low of BandWidth over the prior 115 days
[Min(10,BB Width(20,2)) < 11 days ago Min(115,BB Width(20,2))]
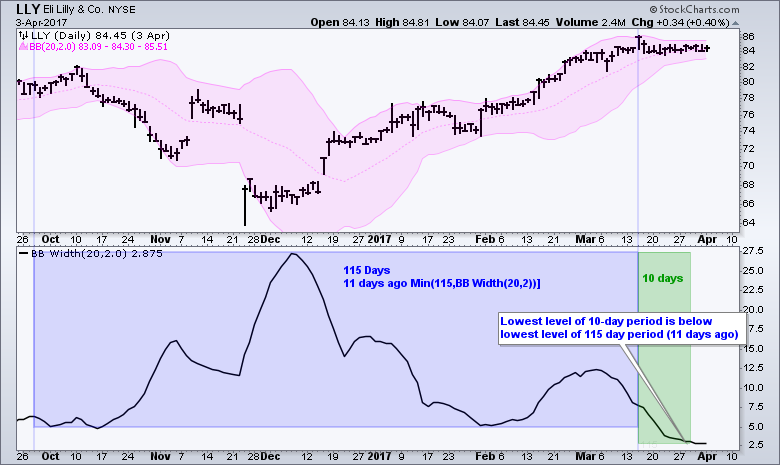
The second part of the filter (after the less than sign <) starts 11 days before the first part. It is looking for the lowest BandWidth value over the last 115 days starting 11 days ago. The chart below shows an example highlighting the last 10 days of BandWidth in green and the 115 days prior to that in blue. Notice that the lowest low of the10 day period is below the lowest low of the 115 day period.
The second method is more straightforward because I am simply looking for BandWidth to be below 6% at anytime over the last 10 days. Keep in mind that you can alter this code to fit your trading preferences. Chartists looking for fewer results can use a lower threshold for BandWidth (below 5 instead of 6). Chartists looking for more results can use a higher threshold. Study some charts and see what works best for you.
// BandWidth was below 6 at some point over the last 10 days
[Min(10,BB Width(20,2)) < 6]
When running through the results, I also decided to add another filter to insure that BandWidth had not already shot up. A surge in BandWidth would suggest that the stock already made its move and I would not want it in the results. Remember, BandWidth does not have a directional bias. It simply rises when the Bollinger Bands expand. This filter insures that current BandWidth is still below 10.
// BandWidth is currently below 10
[BB Width(20,2) < 10]
StochRSI Trigger Code
The next part of the scan code is the actual trigger. Some chartists may want to leave this out and simply look at the charts with narrow Bollinger Bands. Chartists looking for an actual signal can consider a surge in StochRSI. This filter looks for instances when StochRSI 10 crossed above .80.
// StochRSI(10) crosses above .80
[[Stoch RSI(10) x 0.80]
or [1 day ago Stoch RSI(10) x 0.80]
or [2 days ago Stoch RSI(10) x .80]]
You may notice that I also added two lines to find crosses that occurred on the previous two days. This is handy when you are not scanning every day or when you want to review recent signals. Again, notice that each filter is enclosed in brackets and separated by "or". The entire sequence (all three signals) is then enclosed by brackets.
Rate-of-Change Sort Code
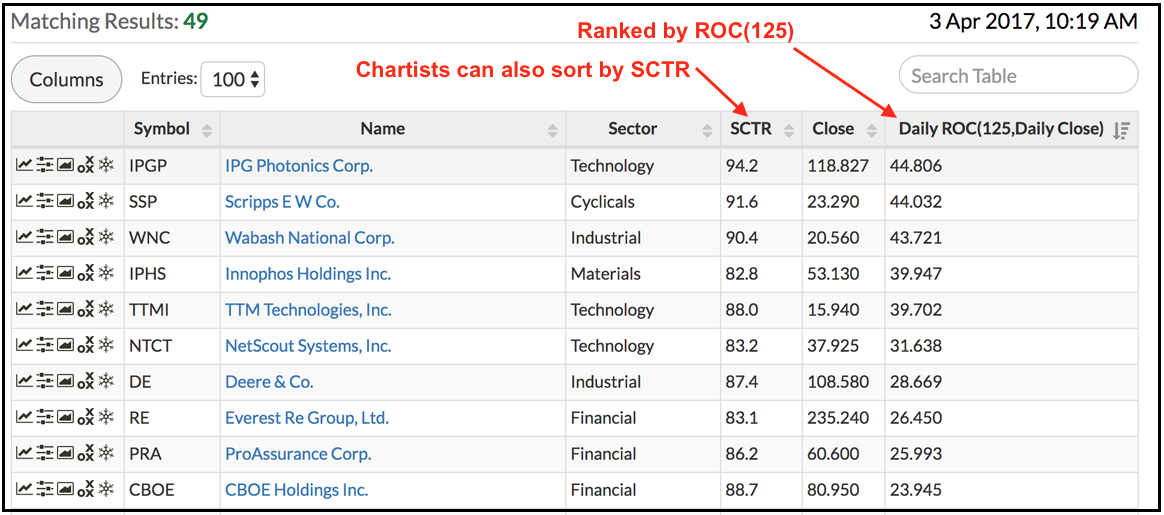
The final line is the "Rank by" function. This places the best performers at the top and acts as a selection mechanism when there are too many stocks to choose from. For example, we need to make a selection when we have 30 results and room for only 5 positions. The "Rank by" function is not a filter and does not require brackets. Using a ranking to sort is totally optional.
// results are ranked by 125-day Rate-of-Change
// this is the last line in the scan
Rank by ROC(125)
Scan Code in Full
The entire code is shown below. Notice that I added "AND" before the code lines (after the first line) to ensure that they are tied together. You do not need to precede the "Rank by" function with "AND" because it is not a filter.
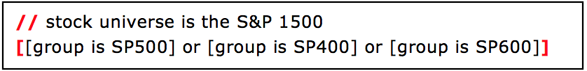
// stock universe is the S&P 1500
[[group is SP500] or [group is SP400] or [group is SP600]]// stock's 50-day EMA is above 200-day EMA
AND [EMA(50,close) > EMA(200,close)]// Method 1: The low of BandWidth over the last 10 days
// is below the low of BandWidth over the prior 115 days
AND [Min(10,BB Width(20,2)) < 11 days ago Min(115,BB Width(20,2))]// Method 2: BandWidth was below 6 at some point over the last 10 days
// You can use method 1, method 2 or both
AND [Min(10,BB Width(20,2)) < 6]// BandWidth is currently below 10
AND [BB Width(20,2) < 10]// StochRSI(10) crosses above .80
AND [[Stoch RSI(10) x 0.80]
or [1 day ago Stoch RSI(10) x 0.80]
or [2 days ago Stoch RSI(10) x .80]]// Sort by 125-day Rate-of-Change
Rank by ROC(125)
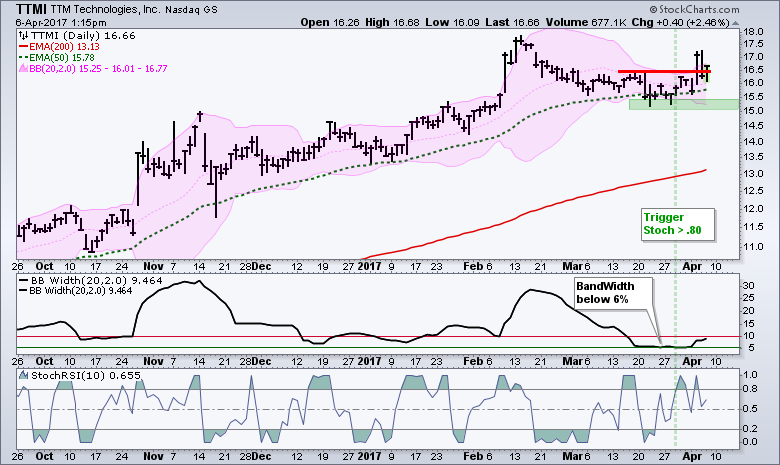
TTM Technologies Setup and Signal
The example below shows TTM with a setup and signal in late March. Notice that this signal triggered before the stock actually broke out. TTMI subsequently broke out and even fell back below the breakout the very next day. Even so, I would not consider this breakout a failure as long as the stocks holds support in the 15.15.5 area.
After running the scan and viewing the resulting charts, I notice that StochRSI often triggers a signal when the stock is still in the consolidation phase. In other words, StochRSI(10) pops above .80 and the stock is still within the narrowing bands. This signal can be a bit early (wrong) because the stock has yet to actually break out. The scan results represent the first cut. We should also look at the individual charts and apply our preferred methods for the trigger signal. Perhaps it is a MACD upturn, a high volume up day or a candlestick reversal.
Conclusions and Suggestions
This is a long only system designed to find stocks that are consolidating in some way shape or form. Although not part of the scan code, I also require the 50-day EMA of the S&P 500 to be above the 200-day EMA. This is my basic bull market filter. We cannot add this to the scan code, but it is something we should know already because it is a key metric for identifying bull and bear markets.
I did not add an exit because we cannot scan for the future! The exit in the original article was based on RSI(10) moving below 30. I would also suggest that traders consider using profit-based targets for exits. In other words, exit with a 15-20% profit or exit when the stock hits your profit target based on chart analysis. This is a good system to find entries, but requires more work for the exit part, which is always the hardest part.
******************************************************
Thanks for tuning in and have a good day!
--Arthur Hill CMT
Plan your Trade and Trade your Plan
******************************************************
Other Articles in the SystemTrader Series:
- Introduction to Key Performance Metrics - Quantifying the Golden Cross for the S&P 500
- Golden Cross and 5 Major Indexes - EMAs versus SMAs - Do Short Positions Add Value?
- Setting up Momentum Scans, Creating ChartLists and Exporting Lists. - Differences in Major Indexes - Do Trend Filters Work?
- MACD Crosses - Rules to Reduce Drawdowns and Increase Gains - Testing PPO Strategy
- Follow me on Twitter @arthurhill - Keep up with my 140 character commentaries.


