----- Video Link ----- Art's Charts ChartList (updated 22-Apr) -----
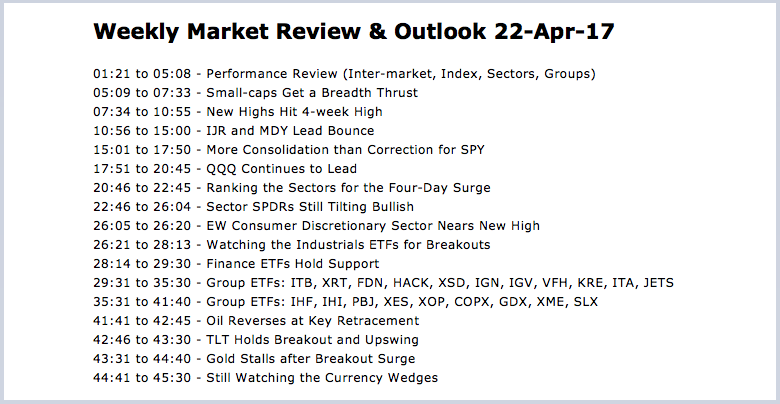
This video is a companion to the written commentary, which was posted on Friday. Small-caps and mid-caps led a market rebound this past week and we even saw a breadth improvement. This is an encouraging spark, but the S&P 500 SPDR (SPY) remains stuck in a consolidation and has yet to end its corrective period. I am still in the correction camp and will be watching three things next week. First, I would like to see MDY and SPY break out. Second, I would like to see an expansion in new highs. Third, I would like to see breakouts in finance, healthcare or industrials. The key charts are all covered in this week's video - along with 30 industry group ETFs.
****************************************
Thanks for tuning in and have a great day!
--Arthur Hill CMT
Plan your Trade and Trade your Plan
*****************************************
ETF Master ChartPack - 300+ ETFs organized in a Master ChartList and in individual groups.
Follow me on Twitter @arthurhill - Keep up with my 140 character commentaries.
Spotting Pullbacks and Upturns within an Uptrend using RSI and MACD Histogram.
Difference between EMA and SMA - Using %Above 200-day EMA for Breadth Analysis.
Backtesting Different Moving Average Pairs with SPY, QQQ and IWM.

