 |
.... Weekly Market Review & Outlook .... Economically Sensitive Groups Take the Lead .... Small-caps Get a Breadth Thrust .... New Highs Hit 4-week High .... IJR and MDY Lead Bounce .... More Consolidation than Correction for SPY .... QQQ Continues to Lead .... Ranking the Sectors for the Four Day Surge .... Sector SPDRs Still Tilting Bullish .... EW Consumer Discretionary Sector Nears New High .... Watching the Industrials ETFs for Breakouts .... Small-cap Healthcare Held up the Best .... Finance ETFs Hold Support .... Biotech ETFs Remain within Corrections .... Retail SPDR Gets a Breakout .... Defense and Airlines Help Industrials Sector .... Oil Reverses at Key Retracement .... TLT Holds Breakout and Upswing .... Gold Stalls after Breakout Surge .... Still Watching the Currency Wedges .... |
Economically Sensitive Groups Take the Lead
It was a big week for part of the stock market. There is still one more day left in the week, but this is shaping up to be the biggest week of the year for small-caps, the consumer discretionary sector, retailers, airlines. Anyone see a common thread? These are cyclical areas of the market mostly focused on the domestic economy. Also note that the PHLX Semiconductor ETF (SOXX), which is more global in nature, surged over 3%.
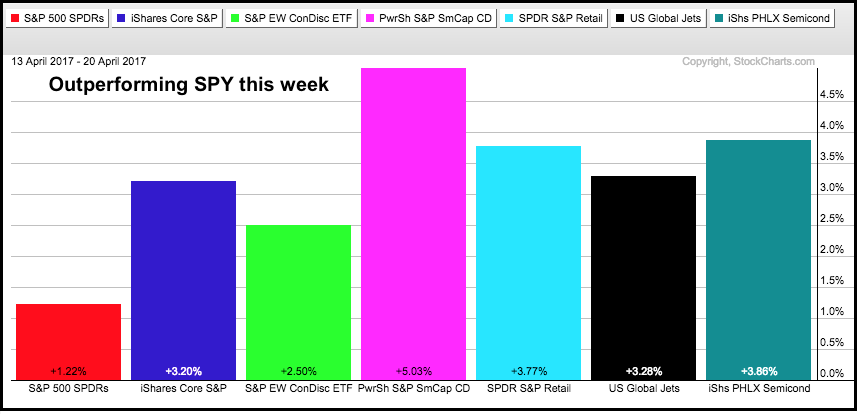
It is quite positive to see small-caps and the consumer discretionary sector leading the market. In fact, this week provided the first signs that the market correction may be ending. It has not been much of a correction because the major index ETFs area essentially range bound over the last five weeks or so.
I am not 100% ready to call for an end to the corrective period though. First, SPY remains short of a triangle breakout. Second, High-Low Percent remains below the 10% threshold required for critical rally mass. Third, I would like to see breakouts in the sector ETFs for finance, healthcare or industrials. Just one of the three would be enough to tilt the balance. A complementary video will be posted on Saturday morning.
Small-caps Get a Breadth Thrust
Small-caps led the market higher over the last four days and this strength can be see in by comparing the percentage of stocks above the 20-day EMA. The chart below shows this indicator for the S&P 500, S&P MidCap 400, S&P Small-Cap 600 and Nasdaq 100. Small-caps are leading with 74.12% above the 20-day EMA and mid-caps are second with 72.5%.
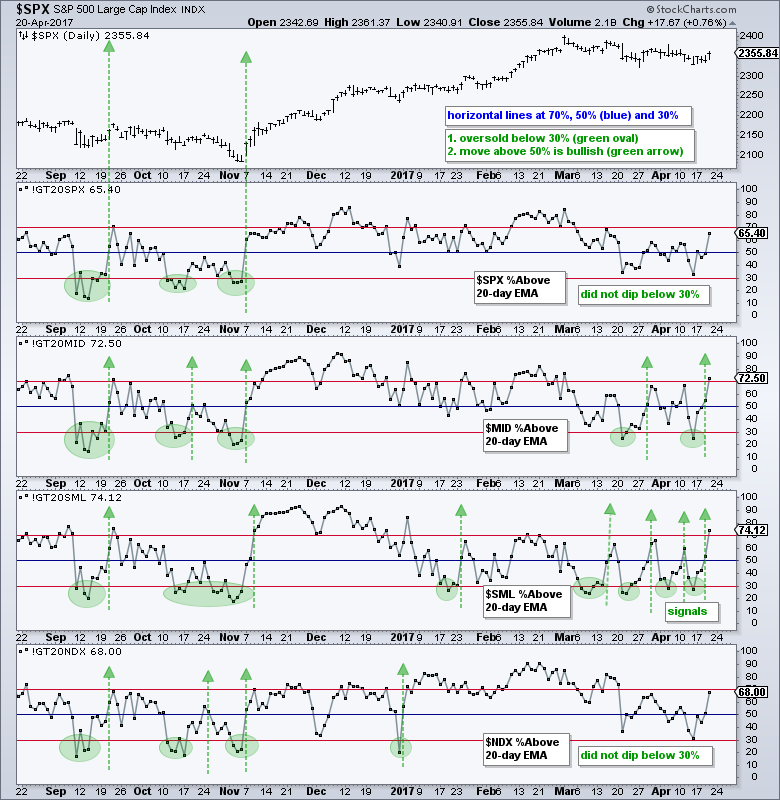
Typically, I use this indicator to identify short-term oversold conditions within a bigger uptrend. The indicator becomes oversold with a dip below 30% and a signal triggers with a subsequent move above +50%. !GT20SPX and !GT20NDX did not dip below 30 and held up the best over the last few months. !GT20MID triggered two signals in March-April and !GT20SML triggered four signals. Even though the S&P MidCap SPDR (MDY) and S&P SmallCap iShares (IJR) have gone nowhere since the signals, they have not broken down and remain above support. I will cover these two chart after the high-low chart.
New Highs Hit 4-week High
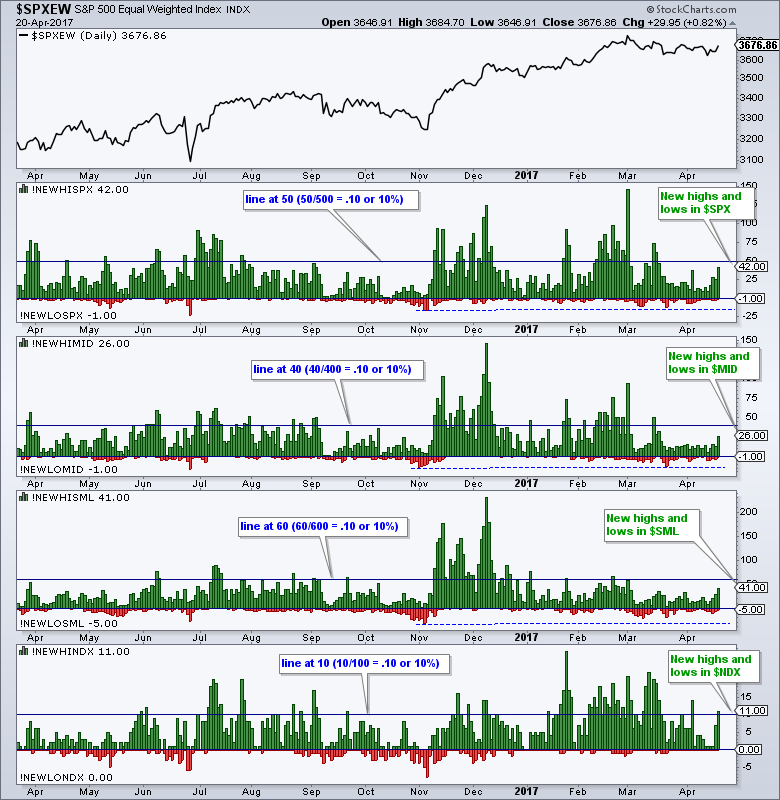
The surge over the last four days also produced the most new highs in four weeks (since 20-Mar) for the S&P 500 and S&P MidCap 400, and since 1-Mar for the S&P Small-Cap 600. The chart below shows the high-low pairs for these four indexes. The horizontal lines are set to mark the 10% threshold (i.e. 50 for the S&P 500). The Nasdaq 100 was the only one to exceed this threshold and remains the strongest index. The S&P 500 is the next closes with 42 new highs (8.4%). Even though small-caps are still short of the 10% threshold (60), the 41 news highs mark the most since March 1st and show a small expansion in participation. Look for a move above 60 to suggest some critical mass and give this bounce legs.
IJR and MDY Lead Bounce
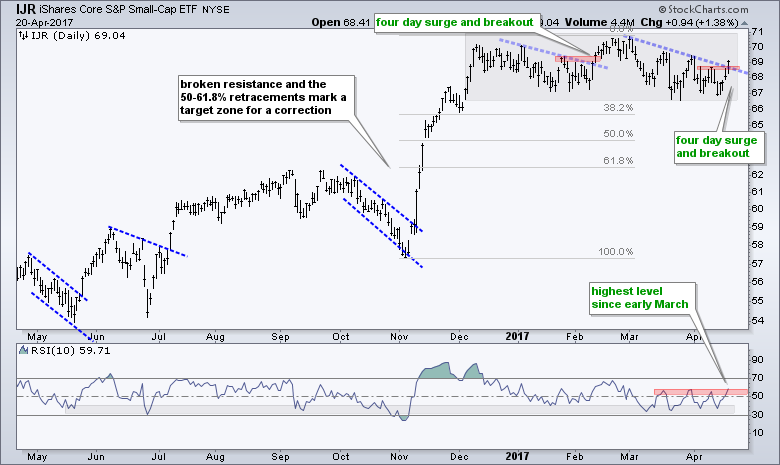
I am going to lead with the S&P SmallCap iShares (IJR) and the S&P MidCap SPDR (MDY) because these two led the market over the last four days. IJR is up over 3% and this is the biggest four-day surge since Valentine's Day (14-Feb). This week's surge produced a breakout that looks similar to the mid February breakout, which ultimately failed. The long-term trend is clearly up and we are in a bull market so I would give the benefit of the doubt to the bulls here. This breakout is bullish and valid as long as IJR holds above 67.5. A close below this level would erase two days of gains, negate the breakout and fill Wednesday's little gap.
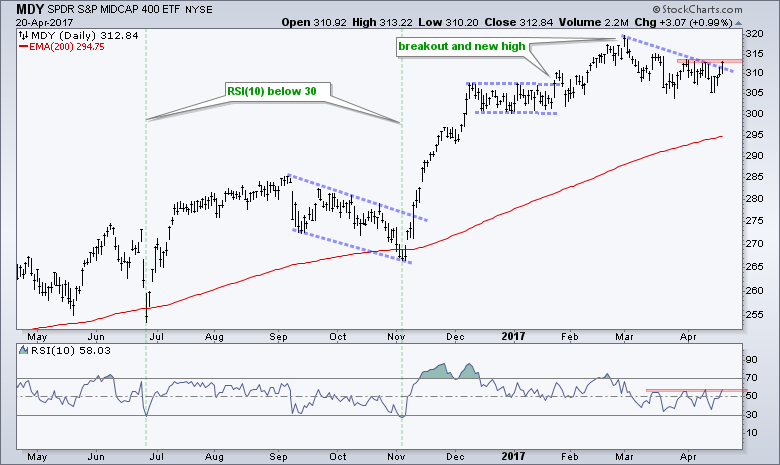
The S&P MidCap SPDR (MDY) broke the March trend line, but did not exceed the late March high. Also notice that RSI did not break out of its range. Thus, a little more work is required to get MDY on the same page as IJR.
More Consolidation than Correction
The S&P 500 SPDR (SPY) is still the 800-pound gorilla in the room and this market benchmark remains in a consolidation pattern. Selling has been contained during the correction because the ETF formed a triangle over the last six weeks. Triangles are typically continuation patterns and a breakout would signal a continuation of the bigger uptrend. A support break would be negative and argue for a deeper correction.
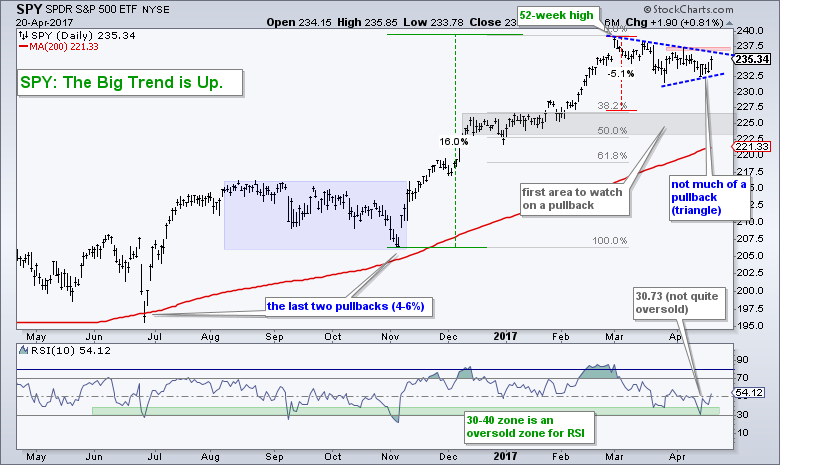
The indicator window shows RSI(10) hitting 30.73 last week and bouncing back above 50 this week. Ideally, RSI should dip below 30 for a "true" oversold reading. Also notice that RSI(10) for IJR, MDY and QQQ did not dip below 30 in March or April. Thus, we have not seen much of a pullback at all and this lack of selling pressure may be testament to underlying strength.
QQQ Continues to Lead
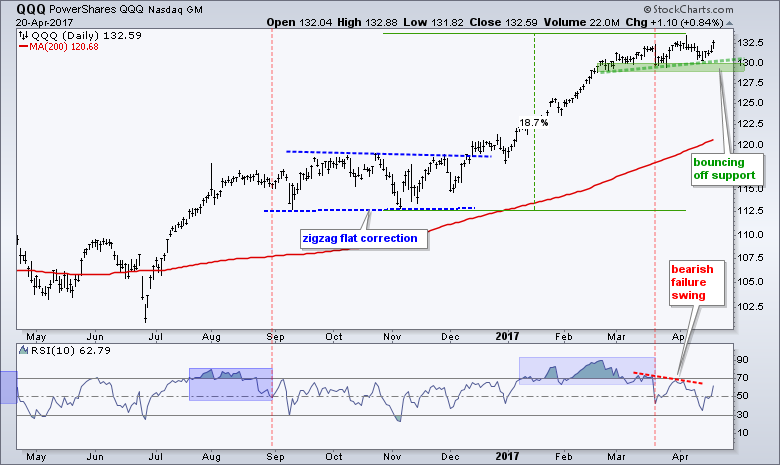
Indicators provide indications, but price is the ultimate arbiter. I identified a momentum breakdown in RSI on March 21st and a bearish failure swing on March 28th. RSI (momentum) was zigzagging lower and QQQ was zigzagging higher. How can this be? The zigzaq down in RSI means upside momentum in QQQ is slowing. It does not mean QQQ is moving lower. Also keep in mind that RSI only covers 10 days worth of price action and QQQ has been zigzagging higher since early March (30+ days). RSI(10) just covers moving portions (10 days) of this move. On the price chart, the ETF again bounced off support this week and remains in a clear uptrend as long as 129 holds.
Ranking the Sectors for the Four Day Surge
The next chart shows the percentage of stocks above the 20-day EMA for the S&P 500 and the nine sectors. It is sorted by this value with the highest percentage at the top (technology) and the lowest at the bottom (energy). In addition to this ranking, I am also interested in the steepness of the move over the last four days. The four green arrows show steep surges in technology, consumer discretionary, industrials and consumer staples. These four sectors led over the last four days. Utilities and energy were the weakest with declines (red arrows).

Sector SPDRs Still Tilting Bullish
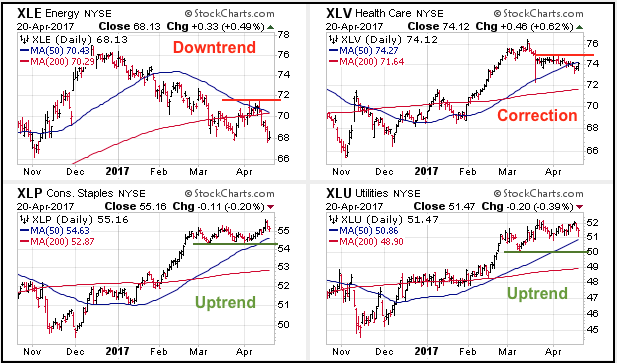
The CandleGlance charts show SPY and the nine sectors with the 50-day and 200-day SMAs. Eight of the nine are above their 200-day SMAs and the 50-day SMA is above the 200-day SMA for all nine. XLE is on the verge of a death cross. Each chart is labeled with correction (3), uptrend (5) or downtrend (1). With five of the nine still in uptrends, it should not be surprising that SPY is within 2% of an all time high. The green lines mark support for these five sector SPDRs. The balance of power will not tilt to the bears until at least two of these sectors SPDRs break support.
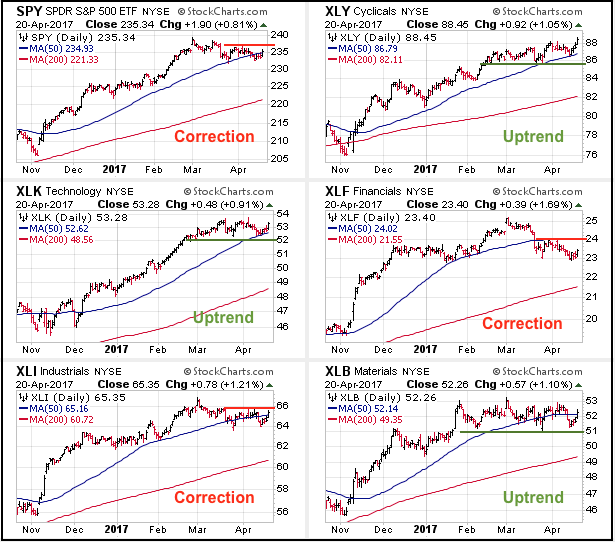
The red lines mark resistance for the three corrections and the one downtrend (XLE). Upside breakouts in one or two would suggest even more strength in the stock market and power the next leg higher.
EW Consumer Discretionary Sector Nears New High
I am most interested in the industrials and consumer discretionary sectors right now because these two could lead the next market move. Instead of looking at just the sector SPDRs, I am going to show charts with the sector SPDR, the equal-weight sector ETF and the small-cap sector ETF. The sector SPDRs are dominated by large-caps. Adding the equal-weight and small-cap versions will provide a better assessment of the sector as a whole.
The first chart shows the EW Consumer Discretionary ETF (RCD), the SmallCap Consumer Discretionary ETF (PSCD) and the Consumer Discretionary SPDR (XLY). XLY hit a new high this week and is clearly leading. The equal-weight version, however, is not far behind and less than 1% from a 52-week high. How bad can things be when the equal-weight version of the most economically sensitive sector is within spitting distance of a new high? Not that bad. The small-cap version (middle window) seriously perked up this week with a surge to its highest level since January 4th. Also note that XLY High-Low% ($XLYHLP) hit 13% on Thursday and 70% of XLY stocks are above their 200-day EMA (!GT200XLY). All told, the consumer discretionary sector is looking good and this is positive for stocks in general.

Watching the Industrials ETFs for Breakouts
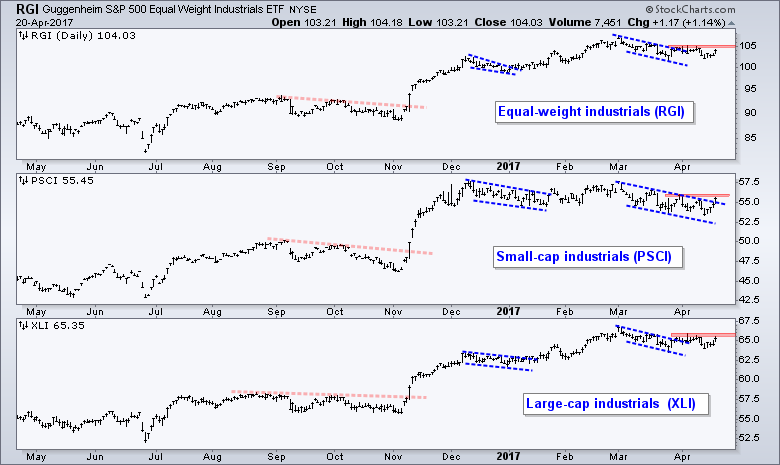
The next chart shows the EW Industrials ETF (RGI), the SmallCap Industrials ETF (PSCI) and the Industrials SPDR (XLI) correcting with falling channels or flags in March. These three stabilized in April as price action flattened, but they remain short of upside breakouts. Look for two of the three to break above their red resistance zones to put the industrials sector back on the bullish track.
Small-cap Healthcare Held up the Best
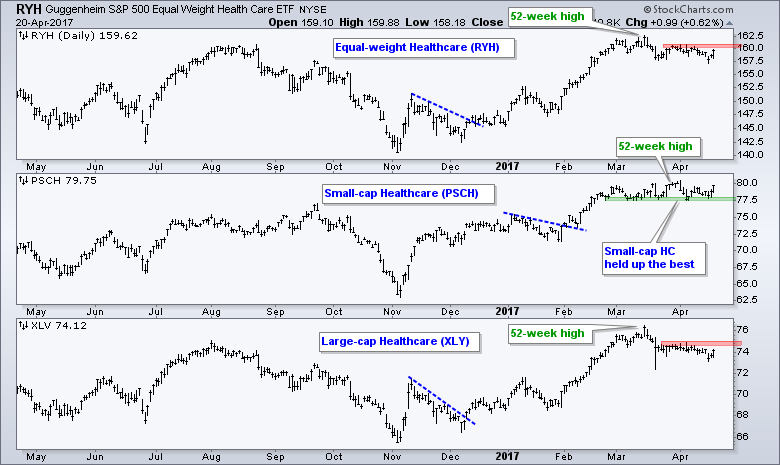
The next chart shows the EW Healthcare ETF (RYH), the SmallCap HealthCare ETF (PSCH) and the HealthCare SPDR (XLV). The equal-weight and large-cap healthcare ETFs corrected and remain just below resistance (red zones). Upside breakouts would be bullish for this sector. The small-cap healthcare ETF (top window) did not break its March lows and traded flat the last six weeks. It held up much better than the other two and shows some relative strength. Note that Healthcare led the new high list on Thursday as XLV High-Low% ($XLVHLP) hit 15%. And, 78% of stocks in the sector are above their 200-day EMA (!GT200XLV).
Finance ETFs Hold Support
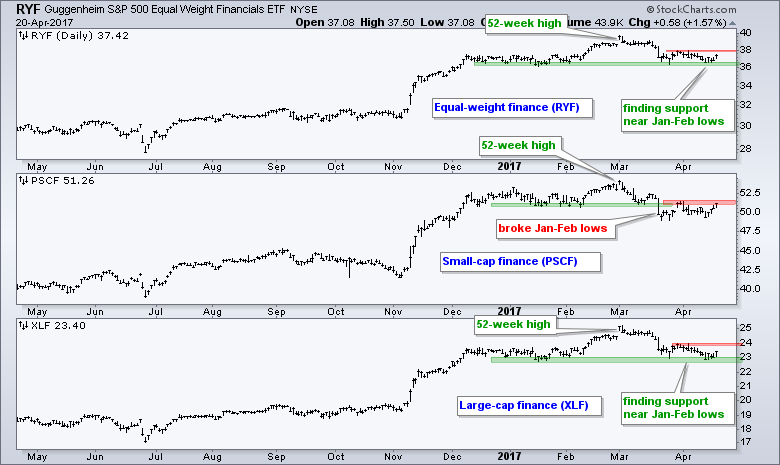
The finance sector gets a lot of the blame for stock market weakness in March (energy too). However, a look at the finance ETFs shows that they are not THAT weak. The EW Finance ETF (RYF) and Finance SPDR (XLF) fell around 9% in March, but both firmed the last few weeks and did not break their January-February lows. The SmallCap Financials ETF (middle window) broke these lows, but is trying to break back above. The red zones mark first resistance and breakouts here would be bullish for the finance sector. Conversely, breaks below the green support zones would be bearish. With both zones quite close, we could see a move sooner rather than later.
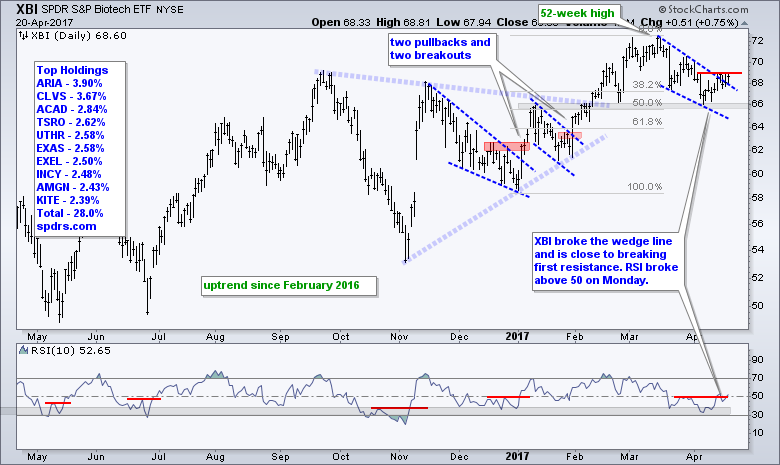
Biotech ETFs Remain within Corrections
The next chart group highlights some industry group ETFs with interesting setups. First, the Biotech iShares (IBB) continues to firm in a potential reversal zone. I marked the 285 area as a potential reversal zone because of broken resistance and the 38-50% retracements. The ETF hit a new high and then corrected back to this area. Look for a break above 293 to signal a continuation of the bigger uptrend. The second chart shows the Biotech SPDR (XBI) already making a move and looking stronger than IBB.

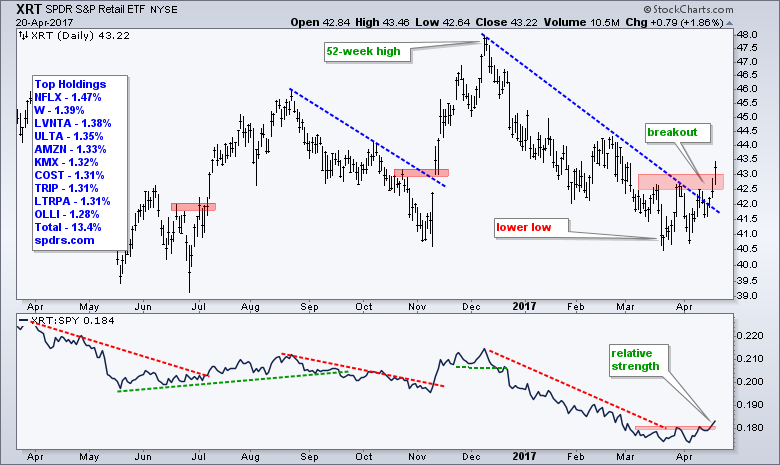
Retail SPDR Gets a Breakout
The consumer discretionary sector got a big boost from the Retail SPDR (XRT) this week. Note that retailers account for 30% of the EW Consumer Discretionary ETF. XRT firmed in the 41 area with two troughs and then broke out at 43 with a surge the last four days. The indicator window shows the price relative turning up and breaking out too. The broken resistance zone around 42.5-43 turns first support. A strong breakout should hold and this means chartists should re-evaluate on a close below 42.50.
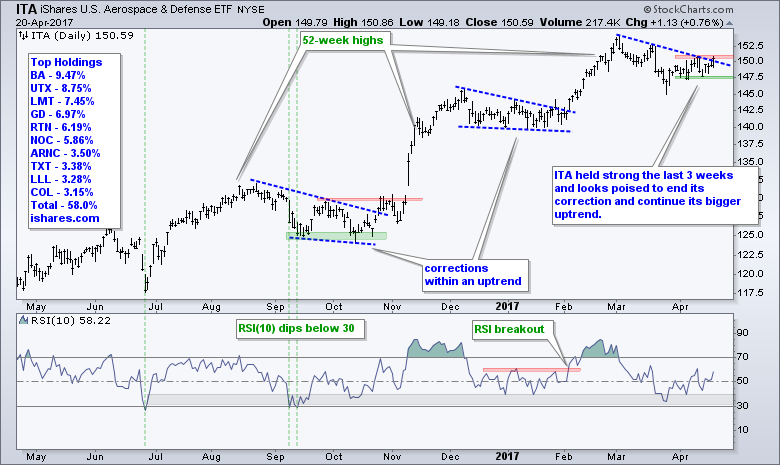
Defense and Airlines Help Industrials Sector
The iShares Aerospace & Defense ETF (ITA) is helping the industrials sector with a bounce this week. It looked like ITA would extend its correction after the decline late last week, but the ETF rebounded and looks poised to break first resistance.
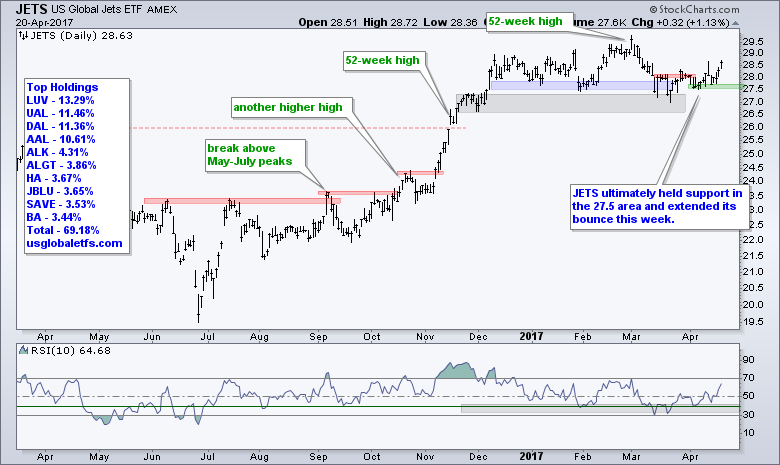
The Airline ETF (JETS) shrugged off the negative events at UAL and surged over the last three days. Overall, JETS held the support zone around 27.5 and extended its bounce this week.
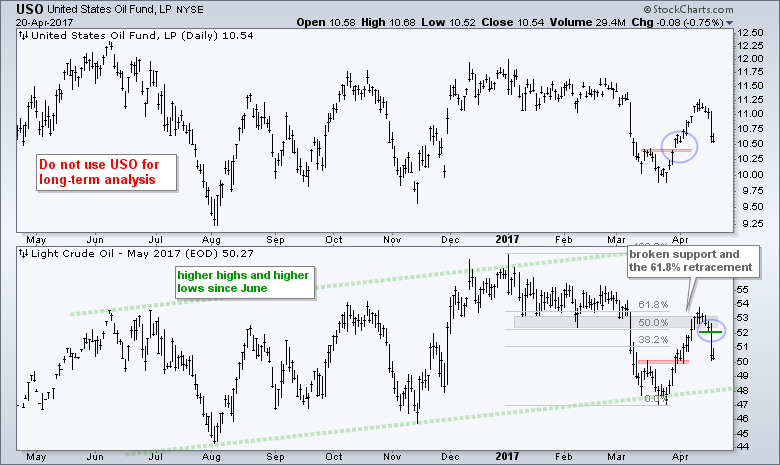
Oil Reverses at Key Retracement
May Crude (^CLK17) surged from 47 to 54 and then hit resistance from broken support. This area also marks a 61.8% retracement of the Jan-Mar decline. Together, broken support and the retracement marked a potential reversal zone and oil obliged with a sharp decline on Wednesday. Frankly, the oil chart is just one big mess. Oil has traded between 44 and 56 for most of the past year and crossed the $50 level over a dozen times. There is still a slight upward trajectory possible, but the cup is suddenly half full after this week's sharp decline.
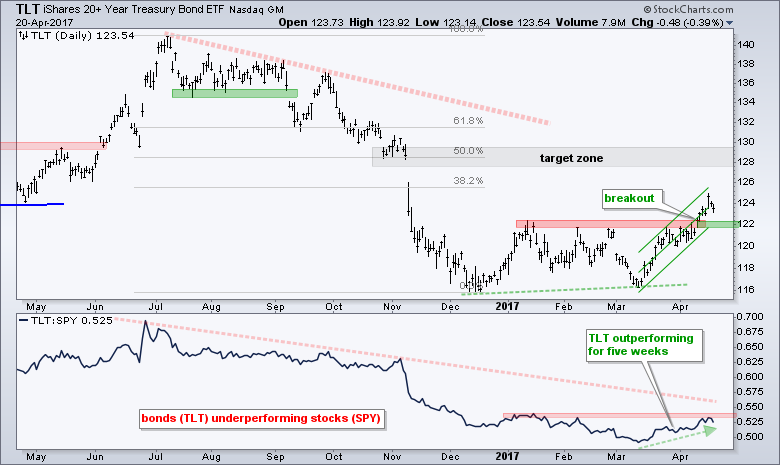
TLT Holds Breakout and Upswing
The 20+ YR T-Bond ETF (TLT) surged around 7% over the last five weeks and broke above the January-February highs in the process. This breakout is bullish until proven otherwise and the breakout zone turns first support. The five week advance is quite steep so I am using a Raff Regression Channel to define this move. The lower trend line matches with broken resistance to mark upswing support at 121.6. A close below this level would reverse the upswing and suggest a failed breakout.
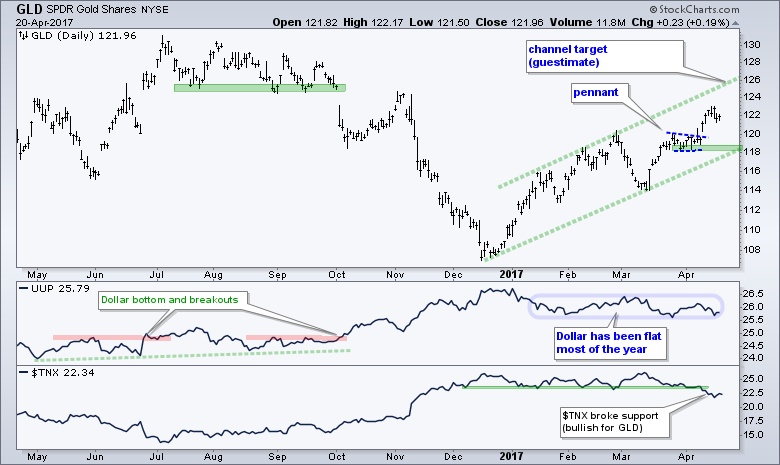
Gold Stalls after Breakout Surge
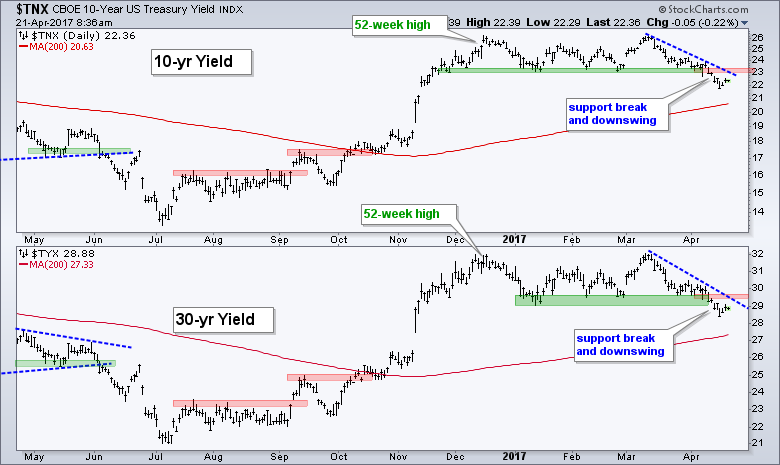
There is no real change on the Gold SPDR (GLD) chart. The ETF broke pennant resistance, surged to 122 and stalled. The breakdown in the 10-yr T-Yield ($TNX) triggered this surge so gold traders need to watch $TNX closely. Overall, a rising channel is possible with an upside target in the 126 area. The pennant lows and lower trend line mark uptrend support at 118.
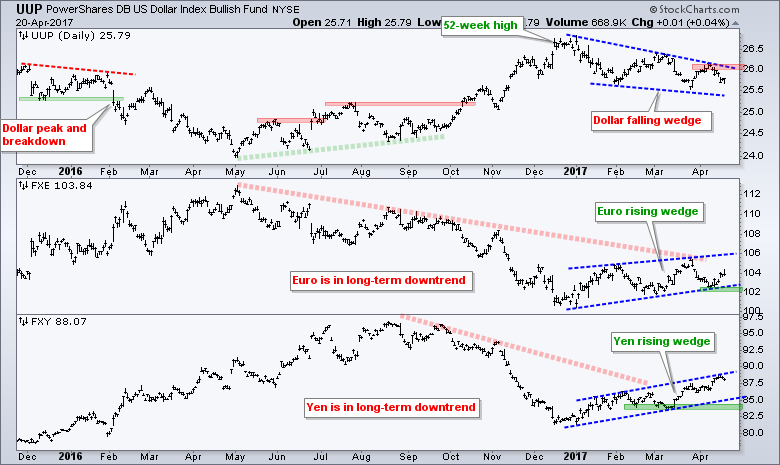
Still Watching the Currency Wedges
There is no change in the Dollar as we head into the French elections. The Dollar remains within a falling wedge, which looks like a correction within a bigger uptrend. The Euro ETF (FXE) remains in a rising wedge, which looks like a bounce within a bigger downtrend. A breakout at 26.1 would be Dollar bullish, while a break below 102 would be Euro bearish.
******************************************************
Spotting Pullbacks and Upturns within an Uptrend using RSI and MACD Histogram.
Difference between EMA and SMA - Using %Above 200-day EMA for Breadth Analysis.
Backtesting Different Moving Average Pairs with SPY, QQQ and IWM.
ETF Master ChartPack - 300+ ETFs organized in a Master ChartList and in individual groups.
Follow me on Twitter @arthurhill - Keep up with my 140 character commentaries.
****************************************
Thanks for tuning in and have a good day!
--Arthur Hill CMT
Plan your Trade and Trade your Plan
*****************************************


