.... XLF Lags as TLT Surges
.... A Classic Corrective Sequence for KRE
.... TLT Holds Breakout and Nears 200-day
.... T-bond Correlations in Play
.... Large-caps Continue to Lead New High List
.... Utilities and Staples Lead Sector New High List
.... Charts: MMC, CB, TRV, MDLZ, KHC, DPS, CMCSA, AAL, JBLU, MDT ....
XLF Lags as TLT Surges
The Finance SPDR (XLF) and the Regional Bank SPDR (KRE) are not reacting well to the recent surge in the 20+ YR T-Bond ETF (TLT). The first chart shows XLF gapping up, stalling in the 23.75-24 range and then gapping down last week. It is not a perfect island reversal, but the essence of this bearish reversal pattern is there and the gap down is bearish as long as it holds. I will mark resistance at 24 and require a close above this level to reverse the current downtrend. Barring such a breakout, the downside target is around 22. Note that the finance sector accounts for 14% of the S&P 500.
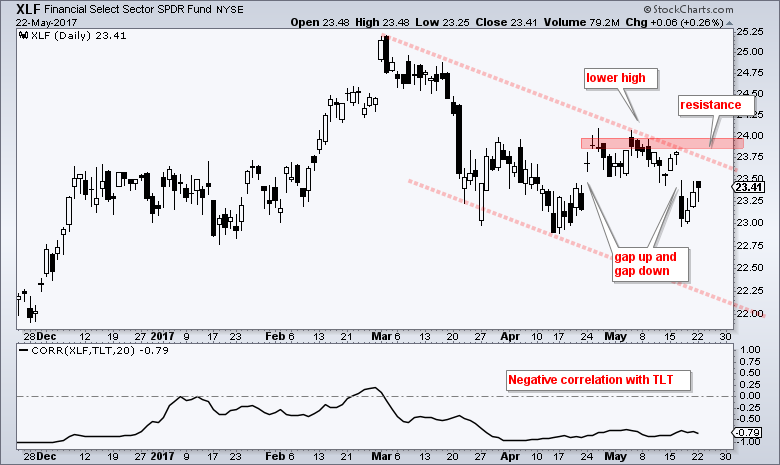
The indicator window shows the Correlation Coefficient (XLF, TLT) in negative territory for most of the last six months. This means XLF and TLT tend to move in opposite directions with strength in TLT translating into weakness in XLF. Put another way, XLF is positively correlated to long-term Treasury yields and tends to rise when yields rise.
A Classic Corrective Sequence for KRE
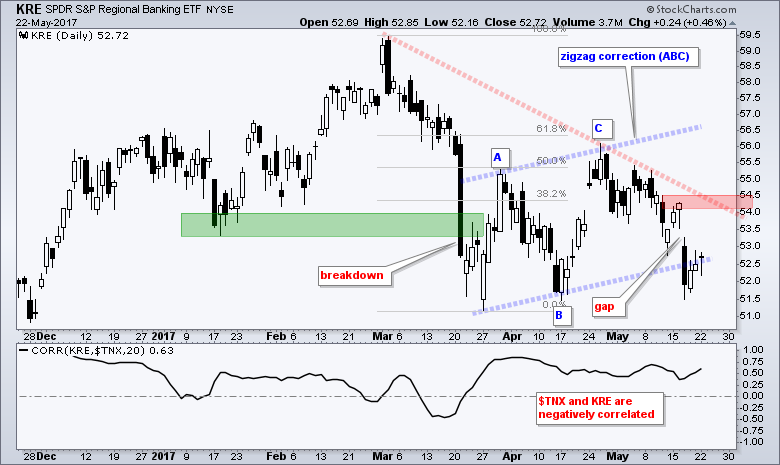
The next chart shows KRE with some classic Elliott Wave at work. I do not use Elliott wave very much and I generally refrain from wave counts. My general strategy is to look for corrective moves after some sort of impulse move. See this ChartSchool article for more details. Note that I am just focusing on THIS chart and THIS timeframe. I am sure we could look at a weekly chart and see a different pattern. The March decline looks like an impulse wave down and the bounce in April-May looks like a zigzag correction that retraced 50-61.8% of the prior decline. KRE turned down in May and broke the channel trend line last week. Even though it bounced over the last three days, I would not take this bounce seriously unless KRE can close above 54.5. The indicator window shows a negative correlation between the 10-yr T-Yield ($TNX) and KRE. Note that the finance sector accounts for 16.34% of the S&P Small-Cap 600.

TLT Holds Breakout and Nears 200-day
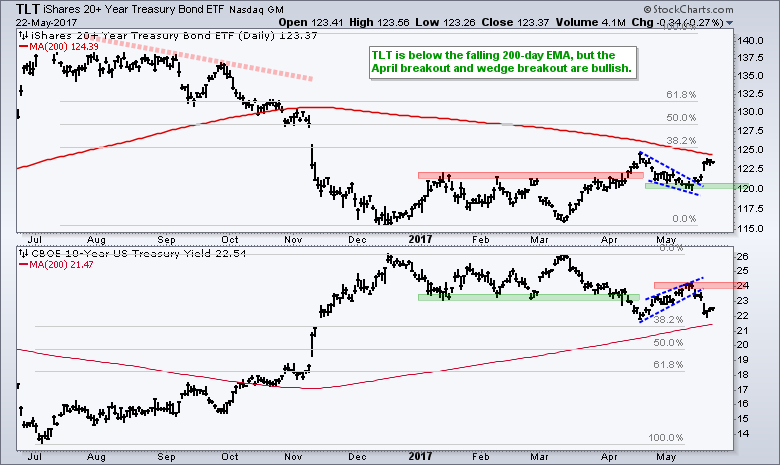
The next chart shows the 20+ YR T-Bond ETF (TLT) with a breakout in April, a pullback into May and a wedge breakout last week. Even though TLT remains below the falling 200-day SMA, this is bullish price action for the long bond ETF. The May lows mark support at 120 and a break here is needed to turn bearish. The 10-yr T-Yield ($TNX) broke the rising wedge line last week and resistance is set at 24.30 (2.43%). Rising bonds and falling yields are bullish for utilities and gold, but bearish for the finance sector and banks.
T-bond Correlations in Play
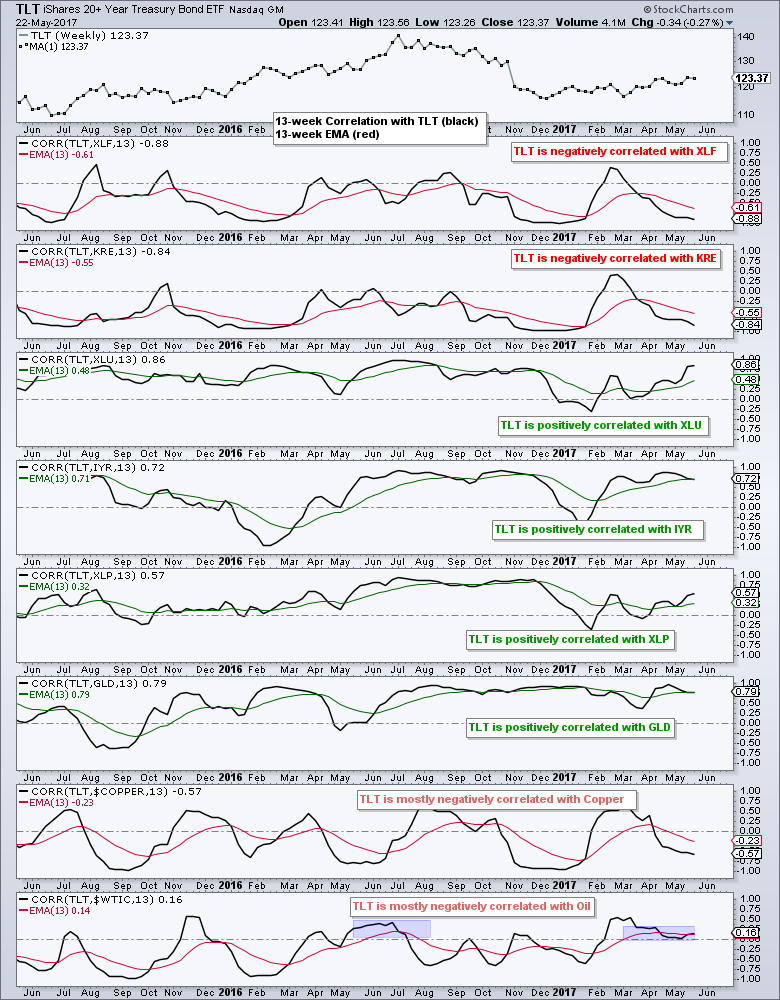
The next chart shows the 20+ YR T-Bond ETF (TLT) and the Correlation Coefficient for eight other symbols. XLF and KRE are at the top and negatively correlated. XLU, XLP, IYR and GLD are positively correlated. This means they should benefit from a rise in TLT. I highlighted the XLU breakout in Monday's DITC and I profiled four utility stocks in Art's Charts last Tuesday (16-May). Copper and oil are negatively correlated for the most part. It is not clear if copper/oil are leading TLT or vice versa. I would think that lower commodity prices would be deflationary and this would be positive for TLT.
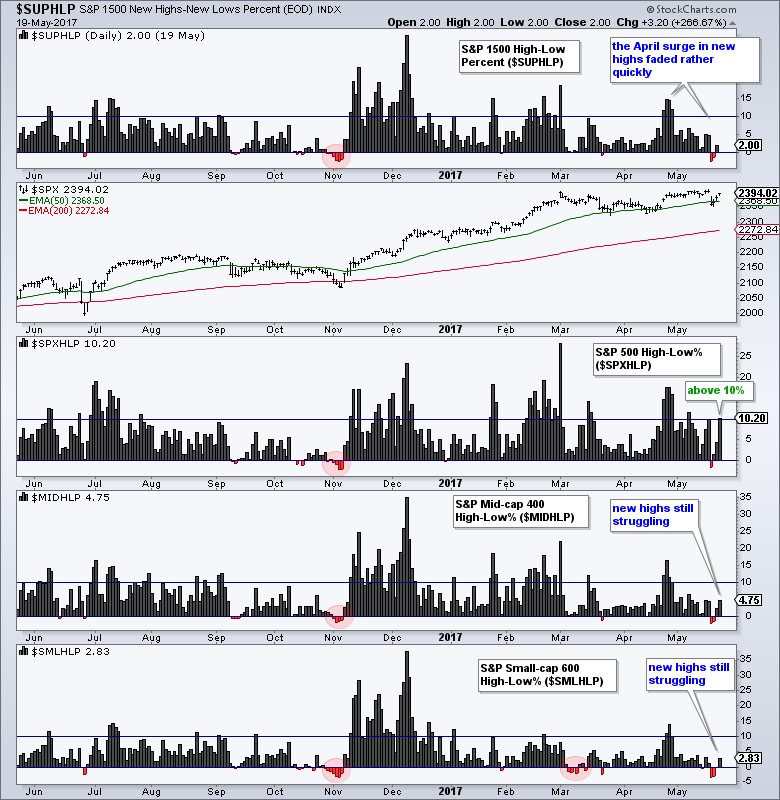
Large-caps Continue to Lead New High List
S&P 500 High-Low% ($SPXHLP) and Nasdaq 100 High-Low% ($NDXHLP) exceeded +10% on Monday, but S&P 600 High-Low% ($SMLHLP) and S&P 400 High-Low% ($MIDHLP) did not exceed 5%. Note that $NDXHLP is not shown on the chart below. Large-caps are dominating the new high list and still the place to be.
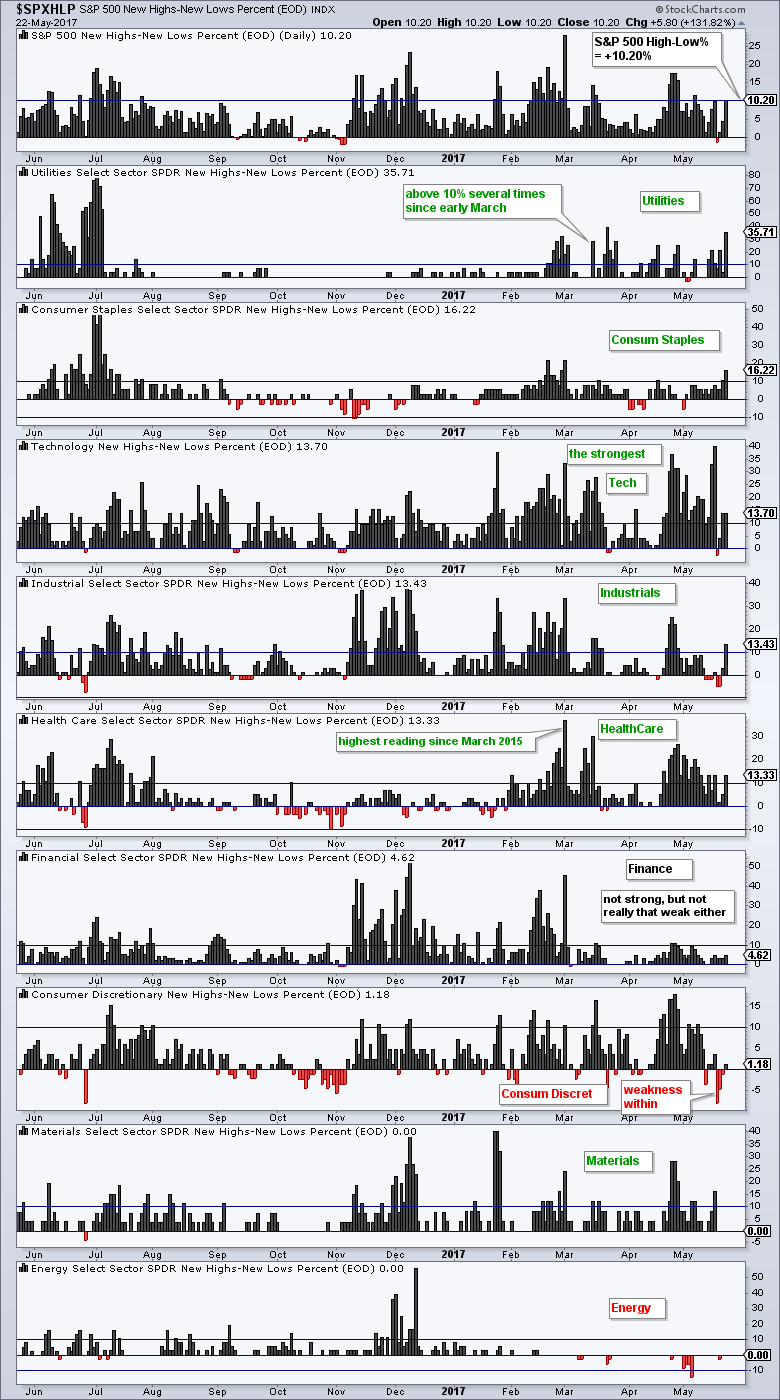
Utilities and Staples Lead New High List
The next chart shows High-Low Percent for the nine sectors and it is sorted by Monday's value, which is the number on the right of each histogram. Utilities High-Low% ($XLUHLP) hit 35% and Consumer Staples High-Low% ($XLPHLP) hit 15% to lead the new high list. Elsewhere, note that Industrials High-Low% ($XLIHLP), Healthcare High-Low% ($XLVHLP) and Technology High-Low% ($XLKHLP) exceeded 10%. This points to strength within five sectors and these five account for around 59% of the S&P 500. Elsewhere, note that the Utilities SPDR (XLU) and EW Consumer Staples ETF (RHS) hit new highs for 2017.
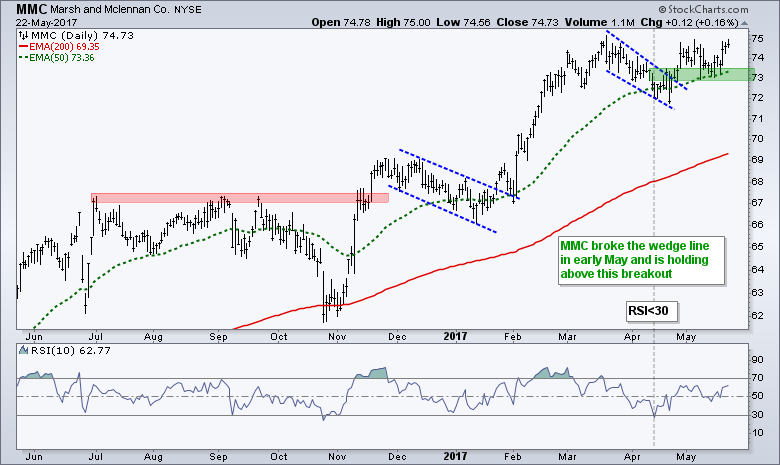
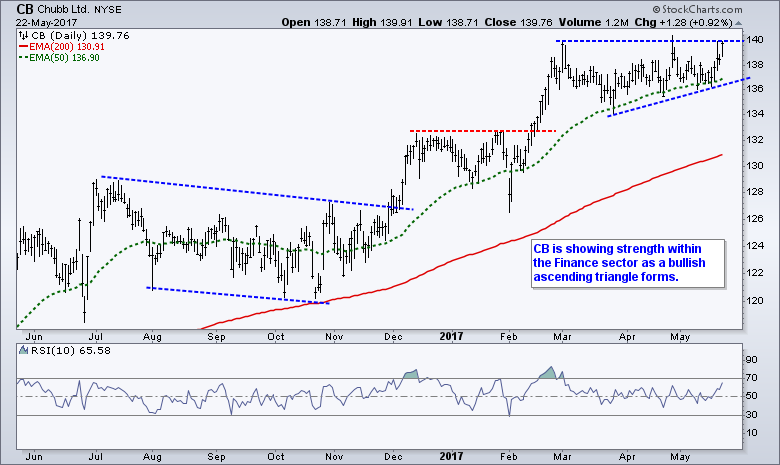
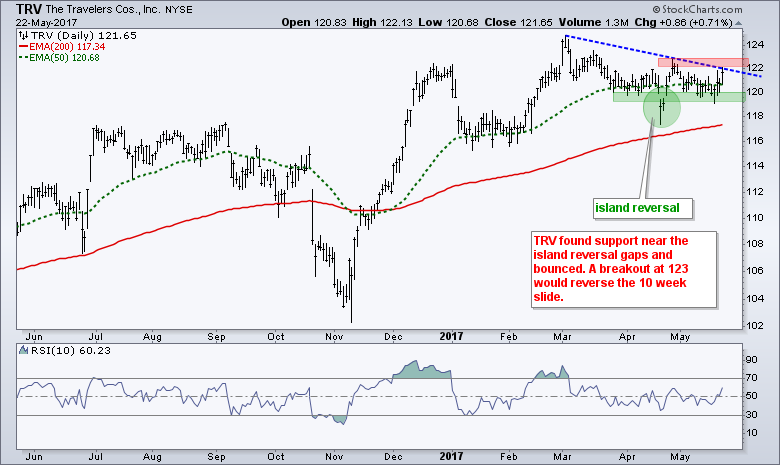
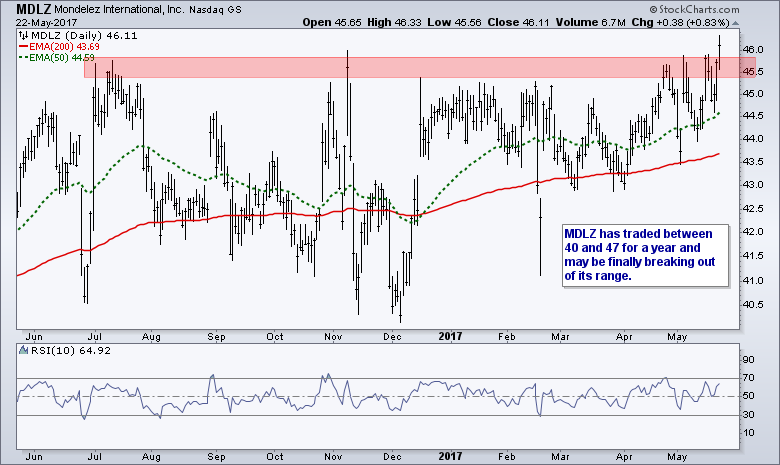
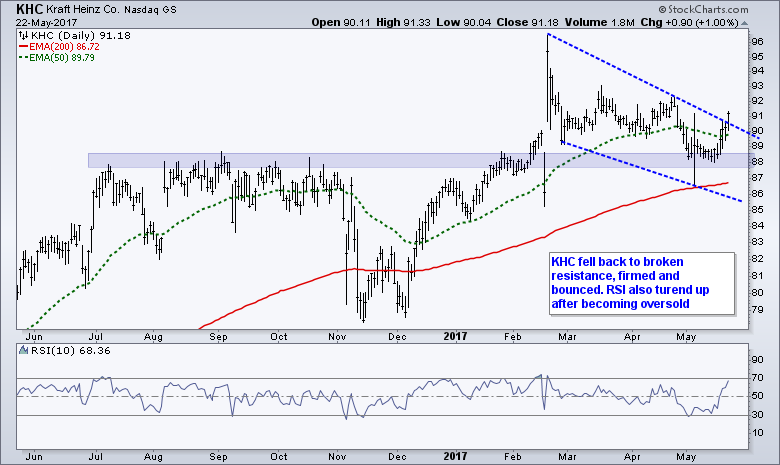
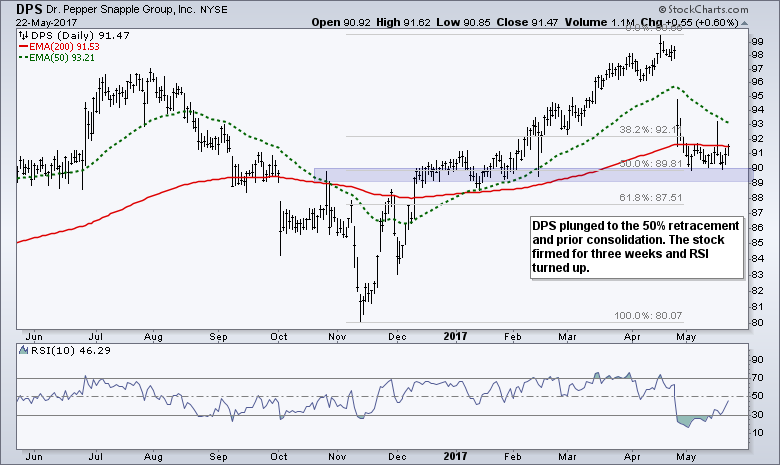
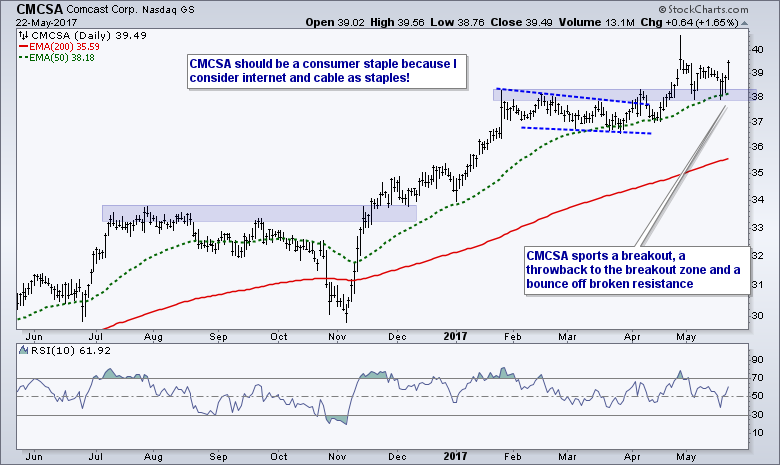
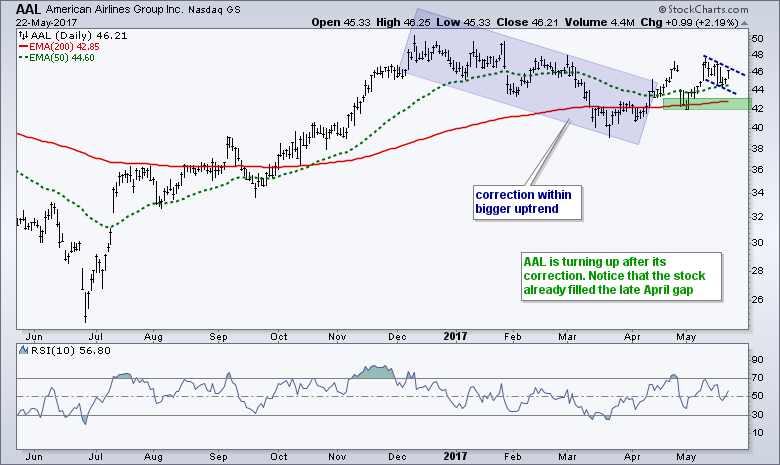
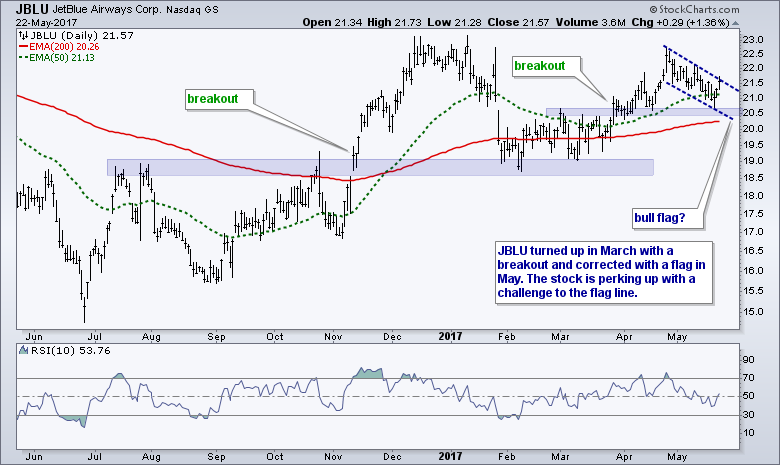
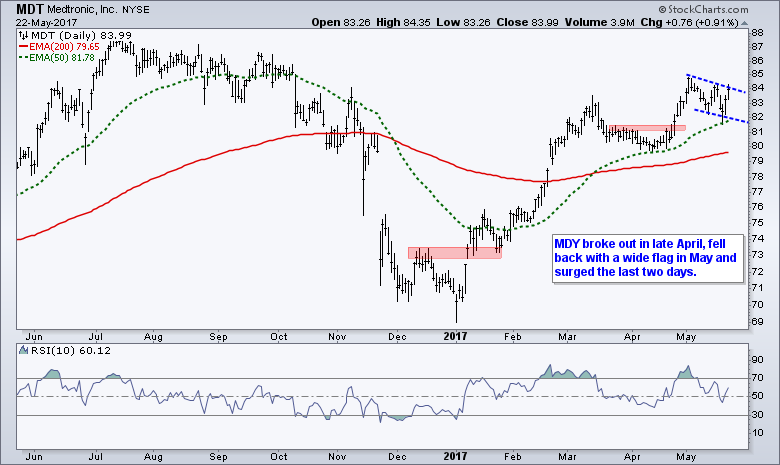
Charts: MMC, CB, TRV, MDLZ, KHC, DPS, CMCSA, AAL, JBLU, MDT
As noted in Thursday's commentary, it is a real stock pickers market right now. Of the S&P 1500, around 700 stocks are up since March 1st and 800 are down (edge to the bears). 272 stocks are up more than 10% and 310 stocks are down more than 10% (edge to bears). Despite an edge for the bears, over 200 stocks sport very nice short-term gains and this means it is a stock-pickers market. At the very least, this means traders should expect an even win-loss ratio (half winners and half losers). The next charts show some bullish setups to consider going forward.
******************************************************
ETF Master ChartPack - 300+ ETFs organized in a Master ChartList and in individual groups.
Follow me on Twitter @arthurhill - Keep up with my 140 character commentaries.
****************************************
Thanks for tuning in and have a good day!
--Arthur Hill CMT
Plan your Trade and Trade your Plan
*****************************************


