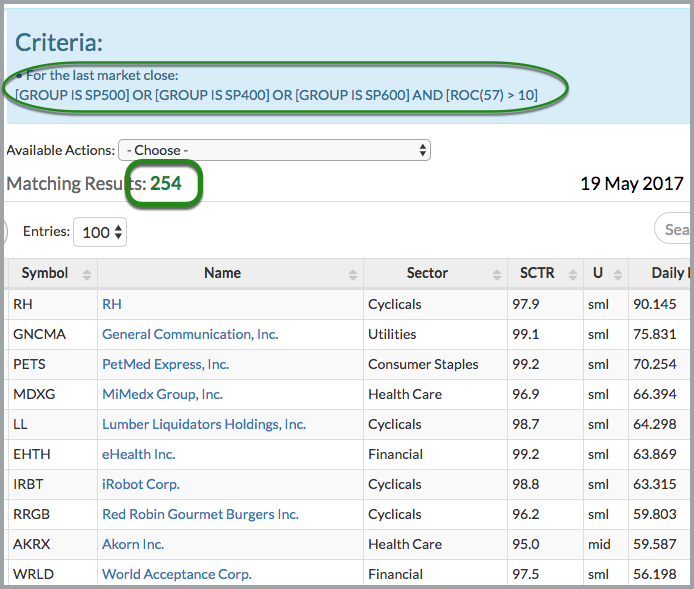
The stock market has been in correction mode since early March when looking at the EW S&P 500 ETF (RSP) and S&P MidCap SPDR (MDY). Together, these two ETFs represent 900 stocks and cover the majority of the market, and they have been flat since March 1st. Throw in a flat correction for the S&P Small-Cap 600 since December and this covers 1500 stocks. This correction, however, has been a bit stealthy because 254 of the stocks in the S&P 1500 are up more than 10% since March 1st. Thus, there are clearly plenty of nice winners since then. On the flip side, note than 327 stocks are down more than 10%. Thus, more stocks are down than up and this is net negative. Nevertheless, it is a stock pickers market because there are plenty of winners out there. As noted in Thursday's post, we just need to find them and put them in a ChartList.
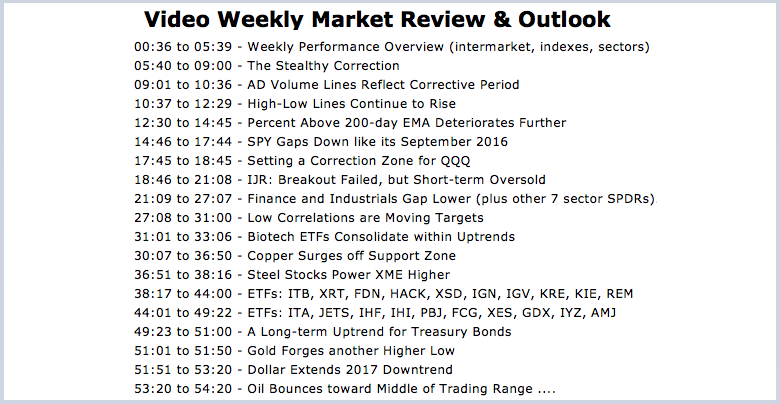
As today's video explains, evidence of a deeper correction in the stock market is building. The AD Volume Lines for the major indexes are falling, the percentage of stocks above the 200-day EMA is falling and stocks were hit with broad selling pressure on Wednesday. Stocks rebounded on Thursday-Friday and this kept the triangle breakout alive in the S&P 500 SPDR (SPY). I am watching this breakout zone because a close back below Wednesday's low would negate the breakout and suggest that the broad market correction is here. Such a signal would carry added weight because we will move into the weakest four-month period in June (System Trader article).
 ----- Full Written Commentary ----- Art's Charts ChartList (updated 20-May) -----
******************************************************
ETF Master ChartPack - 300+ ETFs organized in a Master ChartList and in individual groups.
Follow me on Twitter @arthurhill - Keep up with my 140 character commentaries.
****************************************
Thanks for tuning in and have a good day!
--Arthur Hill CMT
Plan your Trade and Trade your Plan
*****************************************


