 |
.... Do stops really help? |
Do stops really help?
We have all heard the motto: cut your losses and let your profits run. It certainly sounds good in theory, but do stop-losses really improve returns? Today I will test a basic trend system using a moving average crossover for buy and sell signals. I will then add a stop-loss to see if it helps or hurts the system. I will also test profit targets to see if we can improve returns by taking profits at certain levels. The test will cover the S&P 500, S&P Mid-Cap 400, S&P Small-Cap 600 and S&P 1500. Thus, it is a stock picking system designed to offer signals every month and, hopefully, outperform buy-and-hold.
Setting the Benchmark
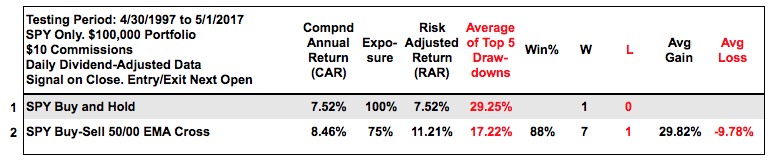
SPY will be the benchmark using buy-and-hold and the golden cross for Compound Annual Return benchmarks. The table below shows buy-and-hold returning 7.52% per year with an average drawdown of 29% over the last 20 years. Note that I am using the average of the top five drawdowns. Buying when the 50-day EMA crosses above the 200-day EMA and selling when the 50-day EMA crosses below the 200-day EMA beat buy-and-hold and reduced the drawdown. The SPY golden-cross system returned 8.46% per year with an average drawdown of 17.22%, which is pretty hard to beat.
System Ground Rules
Even though the golden cross system for SPY is hard to beat, there were only 10 signals over the last 20 years so it is not a very active system. We can increase the number of signals by using stocks and shortening the moving averages. First, here are some of the general guidelines for stock selection.
- Bull market: Only long positions are considered and positions are only considered when the S&P 500 is in a long-term uptrend (50-day EMA above the 200-day EMA).
- Long-term uptrend: The stock must also be in a long-term uptrend (50-day EMA above the 200-day EMA).
- Liquid: Average dollar volume for the stock must be above $5 million per day. This requirement does not affect stocks in the S&P 500 so much, but it does whittle down the S&P 1500 by filtering out around 10%.
- Historical Constituents: The stock universe will be based on the historical constituents for the S&P 500, S&P MidCap 400, S&P Small-Cap 600 and S&P 1500. This means a test in the year 2010 will be based on the stocks that were in the index at that particular time.
- The testing period runs from 30-April-1997 to 1-May-2017, which is twenty years. The system starts in the middle of a bull run (1997), and there were two bear markets and two bull markets afterwards.
- The portfolio begins at $100,000 and commissions were set at $10 per trade. There were 20 equal weight positions in the portfolio. I did not account for slippage, which can occur for the less liquid stocks.
- Buy-Sell signals were generated based on closing prices, while the entry and exit prices were based on the next open. Thus, this is an end-of-day (EOD) system. There are no signals or trades intraday.
- Tie Break: In the event there are more signals than available positions in the portfolio, the 65-day Rate-of-Change is used to break the tie. The stock with the highest Rate-of-Change is then chosen and this favors the stocks with the strongest 3-month momentum.
There are three very important filters to emphasize. First, the broad market environment must bullish. Thus, it is favorable to own stocks when the S&P 500 is in a long-term uptrend. Second, the long-term trend is the dominant force and I want the trend on my side. Thus, the stock must be in a long-term uptrend. Third, we need a momentum factor to pick stocks showing relative strength. There are often more signals than available positions and this 65-day Rate-of-Change filter looks for the strongest.
Consulting, Software and Data
Cesar Alvarez of AlvarezQuantTrading.com provided feedback for the code and system development. Cesar has a great blog and provides consulting services for system development (click here). I used Amibroker to test the code and Premium Data from Norgate. Just like StockCharts, the data is adjusted for dividends to reflect the total return and provide realistic return data.
Putting Some Basic EMA Crossovers to the Test
Let's get started with some basic EMA crossover systems using stocks in the S&P 500. Test 1 buys when the 50-day EMA crosses above the 200-day and sells when the 50-day EMA crosses back below the 200-day. The Compound Annual Return is 7.73% with an average drawdown of 19.34%. The returns are good, but there were only 427 trades over a 20 year period (less than two per month).
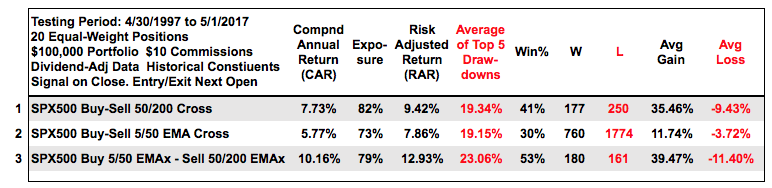
Test 2 buys when the 5-day EMA crosses above the 50-day EMA and sells when the 5-day EMA crosses back below the 50-day EMA. There were more trades (889 in total), but the Compound Annual Return fell below 6% and the Win% was just 30% because there were lots of whipsaws. Test 3 buys when the 5-day EMA crosses above the 50-day EMA and sells when the 50-day EMA crosses below the 200-day EMA. This wider sell signal improved the returns and Win% significantly, but this system had the fewest trades of all (341 or 1.4 per month).
Base System and Sample Charts
There is clearly some merit in Test 3 above so I will use this as my starting point for testing stop-losses and profit targets. Keep in mind that this system triggers buy signals when the 50-day EMAs for the S&P 500 and the stock are above their respective 200-day EMAs. A buy signal triggers when the 5-day EMA for the stock crosses above the 50-day EMA and a sell signal triggers when the 50-day EMA for the stock crosses below the 200-day EMA. The chart below shows Estee Lauder (EL) with a winning trade.
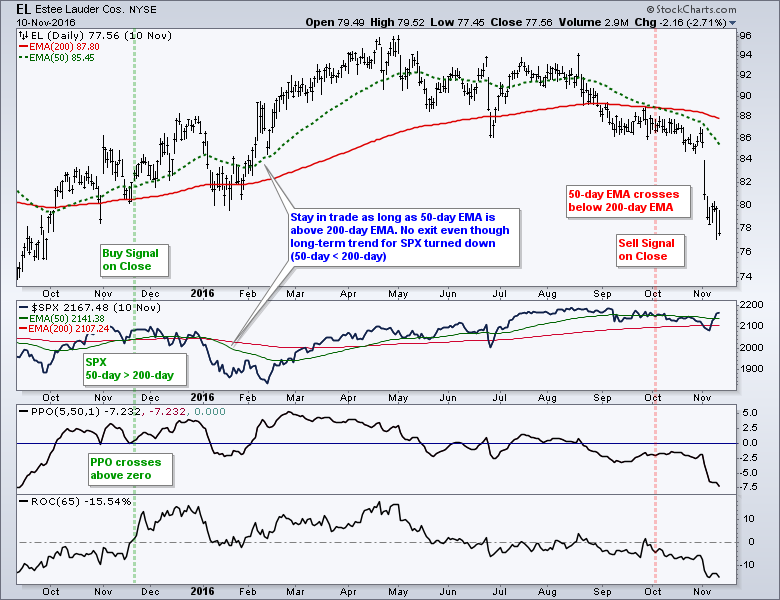
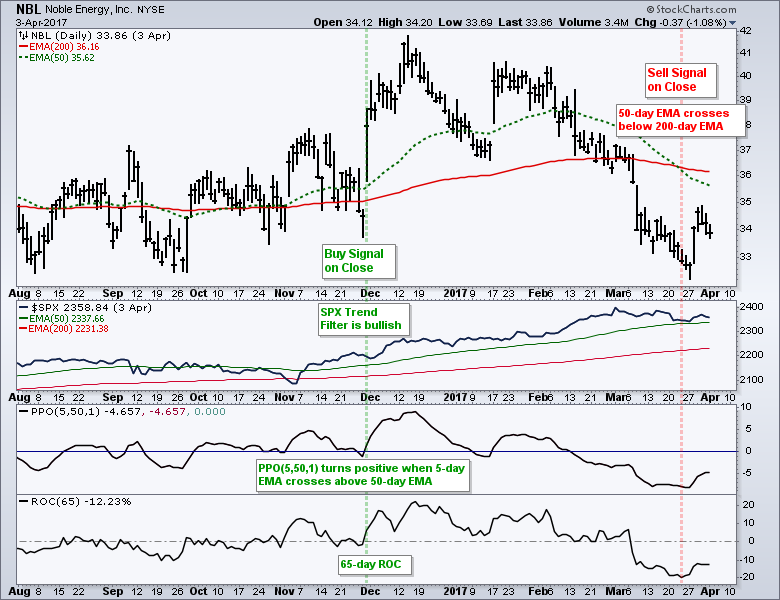
The buy signal can be measured using the Percentage Price Oscillator (PPO(5,50,1)), which turns positive when the 5-day EMA crosses above the 50-day EMA. The sell signal acts like a risk-of-ruin stop-loss that will exit when the long-term trend turns down. The second chart shows Noble Energy (NBL) with a sample entry-exit that lost money. Pro tip: Don't try to tweak the system based on two charts. Study at least 100 charts before considering tweaks.
Trailing Stops, Profit Targets and a Combination
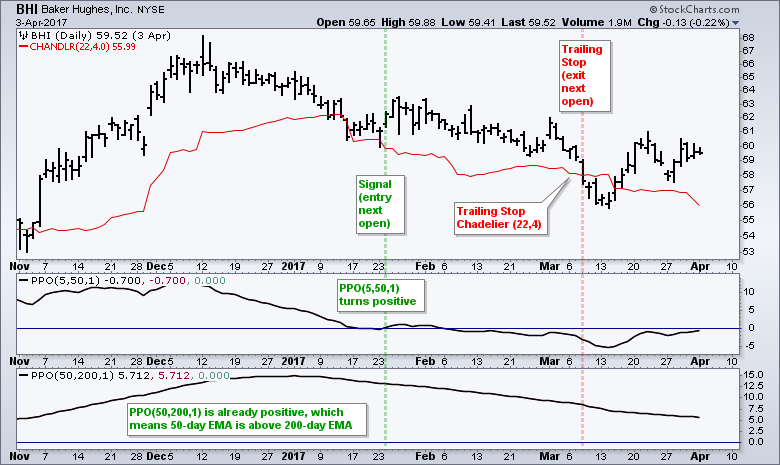
The next three tests will use the buy-sell signals above with a trailing stop, a profit target and a combination of the two. The first is a trailing stop-loss using the Chandelier Exit (22,4). This trails a stop-loss that is four ATR(22) values below the 22-day high. You can read more about the Chandelier Exit in our ChartSchool article. The Baker Hughes chart below shows an example.
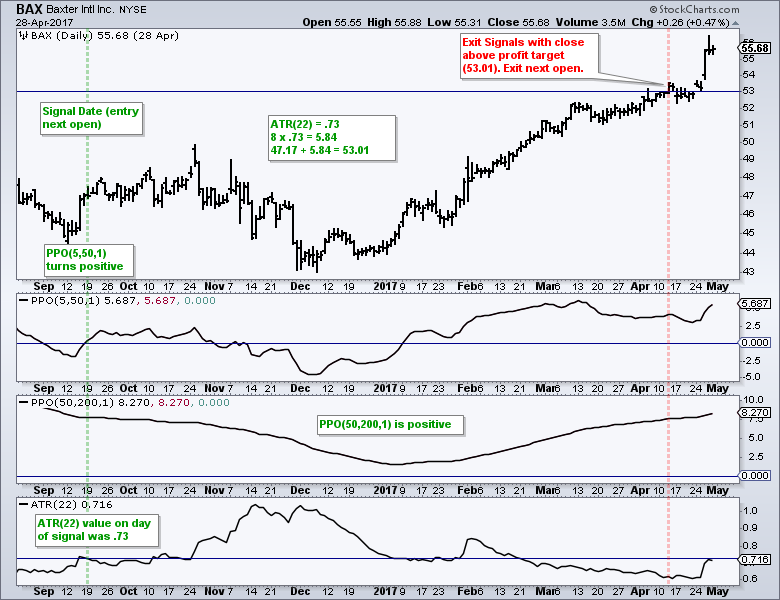
The next tests uses a profit target that is eight ATR(22) values above the entry point. The example below shows Baxter (BAX) with a signal on September 19th with ATR(22) at .73. The entry was on the next open at 47.17 and the profit target was 53.01 (horizontal line). BAX closed above the target on April 12th (red line) and the exit was the next open. The choice of close, high-low range or good-til-canceled (GTC) order is entirely yours! You can read more about the Average True Range in our ChartSchool.
Backtest Results
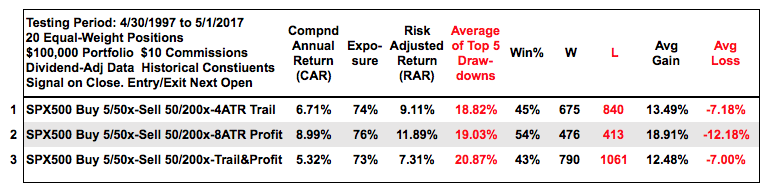
The table below shows the results when using a trailing stop, a profit target and both. Notice that the Compound Annual Return fell below 7% when using a trailing stop-loss and was 2% highs when using a profit target (8.99%). The average drawdowns were about the same. The Win% was much higher when using the profit target, but the Avg Gain/Avg Loss ratio was better when using the trailing stop-loss. Overall, I think the profit target works better than the stop-loss. And finally, notice that the worst results were when using a trailing stop-loss and a profit target together.
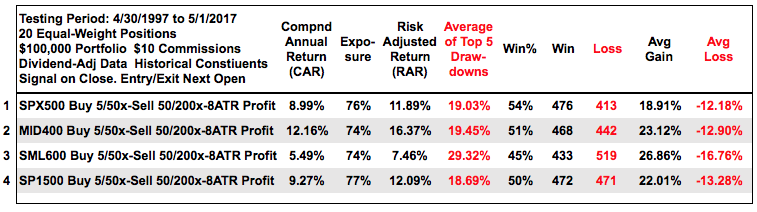
The next table breaks down this system using the 8ATR profit target for the S&P 500, S&P Mid-Cap 400, S&P Small-Cap 600 and S&P 1500. Overall, mid-caps performed the best and small-caps the worst. Using the S&P 1500 as a trading universe delivered good returns with a 9.27% Compound Annual Return, an 18.69% average drawdown and a decent Avg Gain/Avg Loss ratio. Note, I have not yet looked into trailing a stop-loss average a certain profit target. Perhaps that is for a future test.
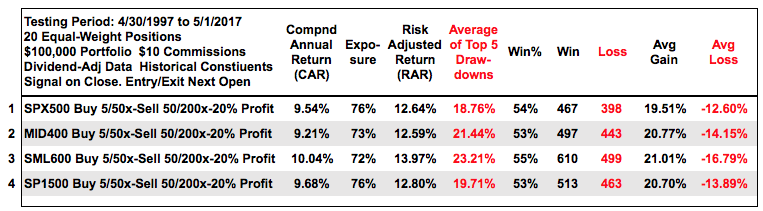
Testing a Percent Profit Target
I decided to take this one step further by using a simple percent profit target (20%). An exit signal triggers when the close is more than 20% above the entry price and the exit is the next open. The results were quite good with the average Compound Annual Return around 9.5%, the average drawdown around 19.5% and the average Win% around 54%.
Conclusions and Caveat Emptor
We should not take old Wall Street axioms for granted and figure out for ourselves if something works or not. Trailing stops certain work for some traders, but it is possible to make money and avoid ruin without trailing stops. The tests above clearly show some merit in taking profits and moving on to the next position. Perhaps a bird in the hand is better than two in the bush when it comes to trading stocks. Even if not using stops, it is important to have an exit strategy to avoid big losses (think FSLR, PRGO and TRIP on 2016). Exiting when the 50-day EMA crosses below the 200-day EMA will prevent a major loss.
Portfolio level backtesting means I am testing a basket of stocks. I never know which picks will be winners and which will be losers. These systems are profitable because the profit from the winners exceeds the losses from the losers. Also note that the results are based on taking every trade and sticking with the system, which is hard in real life. And finally, keep in mind that past results to not guarantee future results.
Scan Code
Here is the scan code for finding stocks in the S&P 1500 that trade at least 5 million in Dollar volume per day and are in long-term uptrends. The scan looks for the 5-day EMA to cross above the 50-day EMA and then sorts the results by the 65-day Rate-of-Change. Here is a link to some other scan code.
// set stock universe
[group is SP500] or [group is SP400] or [group is SP600]// insure daily Dollar Volume is greater than $5 million
AND [SMA(20,close) * SMA(250,volume) > 5000000 ]// only stocks that are in long-term uptrend
AND [EMA(50,close) > EMA(200,close)]// 5-day EMA crossed above the 50-day EMA
AND [EMA(5,close) x EMA(50,close)]// Rank by 65-day Rate-Of-Change
Rank by ROC(65)
******************************************************
Thanks for tuning in and have a good day!
--Arthur Hill CMT
Plan your Strategy and Trade your Strategy
******************************************************
Other Articles in the SystemTrader Series:
- Introduction to Key Performance Metrics - Quantifying the Golden Cross for the S&P 500
- Golden Cross and 5 Major Indexes - EMAs versus SMAs - Do Short Positions Add Value?
- Setting up Momentum Scans, Creating ChartLists and Exporting Lists. - Differences in Major Indexes - Do Trend Filters Work?
- MACD Crosses - Rules to Reduce Drawdowns and Increase Gains - Testing PPO Strategy âÂÂÂÂÂÂÂÂ
- Follow me on Twitter @arthurhill - Keep up with my 140 character commentaries.


