.... IJR and MDY Tests their Breakouts
.... Stocks and Junk Outperforming Treasuries
.... Watch BAC, C, GS and JPM for Big Banks
.... Watch USB, FITB, HBAN and ZION for Regionals
.... Aroons Signal Consolidaiton for Arconic
.... A Small Correction for Natty?
.... BHI and XOM Held Up Better than their Peers
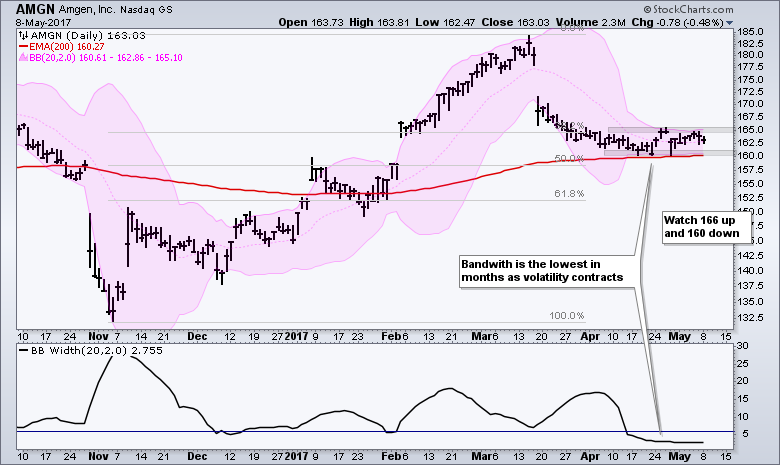
.... Charts to Watch: MET, UPS, HRL and AMGN ....
IJR and MDY Tests their Breakouts
I will first update the short-term mean-reversion strategy for IJR. In short, the system buys when RSI(5) moves above 30 and sells when IJR moves below the Chandelier Exit. See this article for more details. RSI moved above 30 three times in March-April and IJR did not close above its Chandelier Exit until April 20th. The entry signals triggered, but the exit setup did not materialize until later. The ETF closed below the Chandelier Exit last Monday (April 28th) and this triggered an exit for a 3% profit on the trade. The system is now on the sidelines and waiting for the next setup.
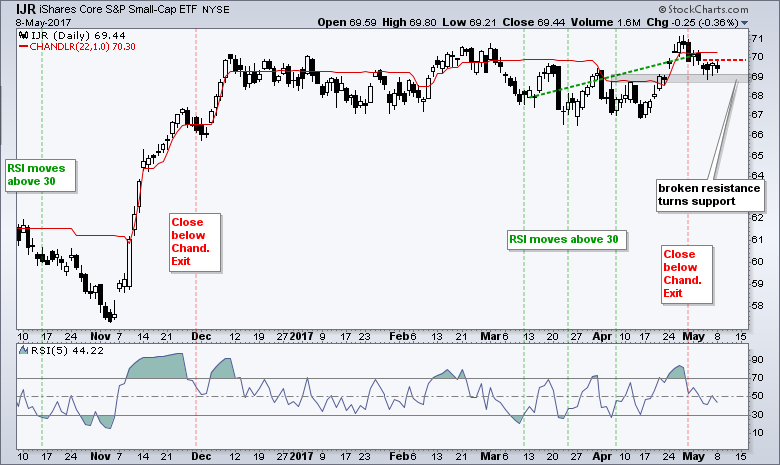
Looking at the price chart, the next bullish setup could be here now. Notice that IJR broke a resistance zone around 69 and surged to a new high in late April. The long-term trend is up and the pullback to the breakout zone could be an opportunity, not a threat. IJR stalled for four days and I would watch for a breakout at 70 to signal a resumption of the late April surge.
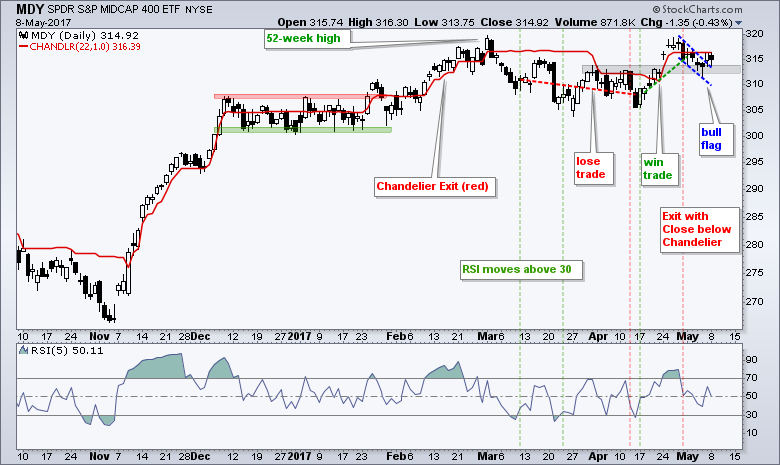
The S&P MidCap SPDR (MDY) chart highlights a losing mean-reversion trade from March 12th to April 12th and a winning trade from April 17th to May 1st. MDY formed a falling flag last week and broke out with a surge on Friday. This breakout is bullish as long as MDY holds above 313. Note that I only use end-of-day (EOD) prices and do not take signals on intraday moves. It is a personal preference.
Stocks and Junk Outperforming Treasuries
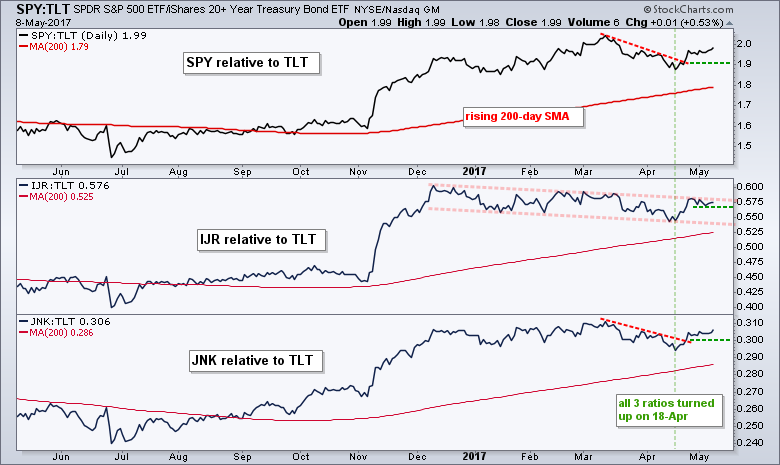
Chartists can get a feel for the risk appetite in the markets by comparing stocks to Treasury bonds and junk bonds to Treasury bonds. Stocks represent risk assets and Treasuries represent safe-have assets. Junk bonds are highly correlated to stock prices and quite sensitive to economic prospects. The S&P 500 SPDR (SPY) started outperforming the 20+ YR T-Bond ETF (TLT) again as the SPY:TLT ratio turned up over the last few weeks. The IJR:TLT ratio also turned up, but remains in a downtrend since December because small-caps are still struggling. A break above the channel line would show relative strength in small-caps and this would be bullish for the risk appetite. The bottom window shows the High Yield Bond SPDR (JNK) relative to TLT. Even with the plunge in oil prices, this ratio turned up the last few weeks and this is also a healthy sign for the stock market. The green dotted lines mark short-term levels to watch for a downturn that would throw cold water on my thesis.
Watch BAC, C, GS and JPM for Big Banks
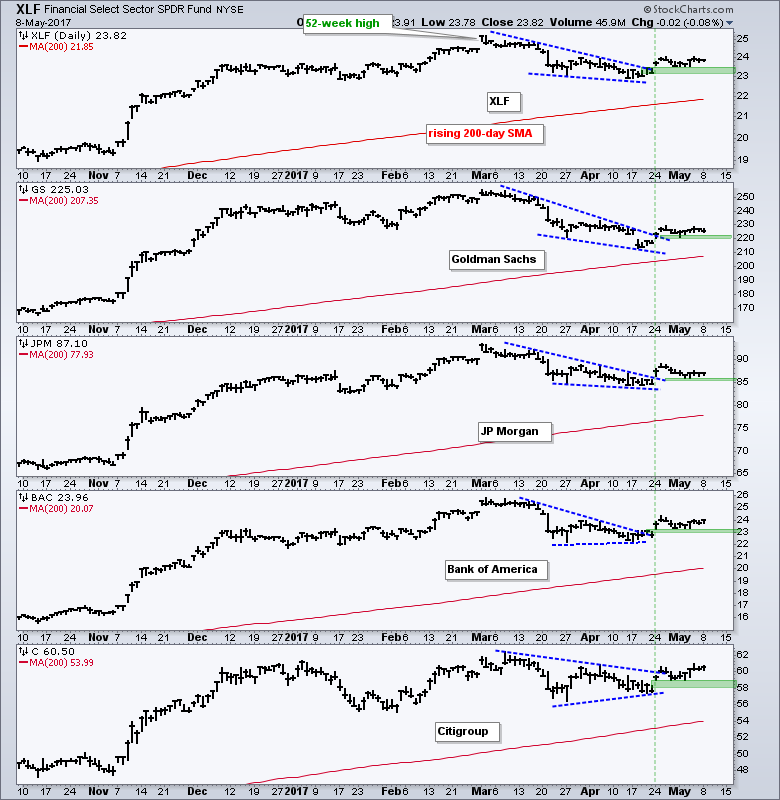
The Finance SPDR (XLF) hit a 52-week high in March and the fell back with a falling wedge. What does this say? It suggests that the long-term trend is up and the wedge is a correction within that uptrend (IMHO). The ETF broke the wedge line on April 24th and then moved into a stalling pattern the last two weeks. It is positive to see the breakout holding, but lack of follow through is not-so-positive. I would not call it negative because it is simply a stall after the breakout. Thus, I am bullish and looking for the evidence that would prove this stance otherwise. The chart below shows the Finance SPDR (XLF) with four big components. All four hit 52-week highs in early March and then corrected into late April. The green shading marks the breakout and/or gap zones, and this is the first area to watch for a breakout failure. Closes below these levels would be negative for XLF and the banking stocks.
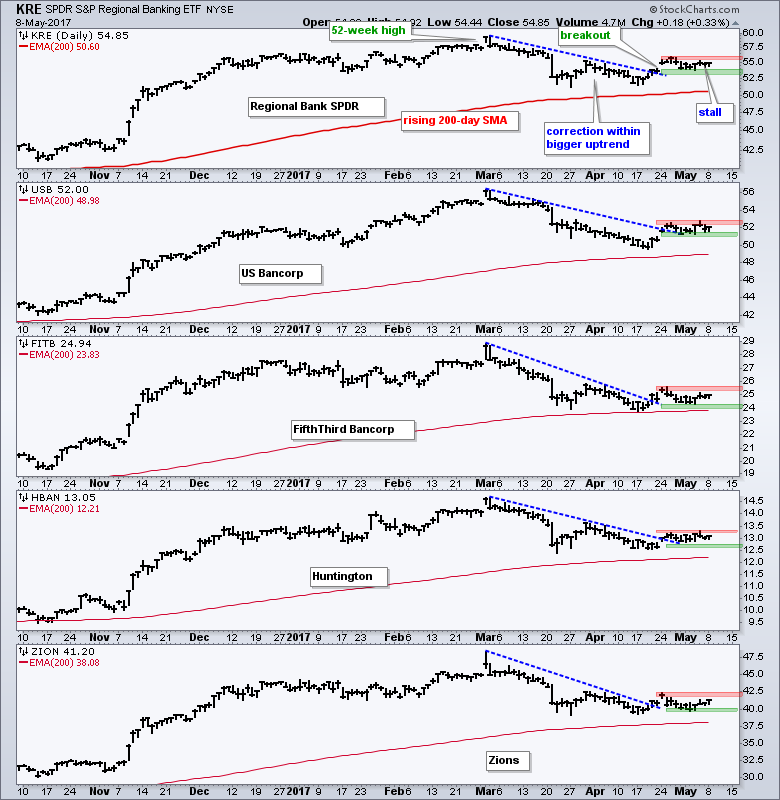
Watch USB, FITB, HBAN and ZION for Regionals
The next chart shows the Regional Bank SPDR (KRE) and four regional banks with similar setups. This time I marked support and resistance based on the consolidation over the last two weeks. Watch these levels for the next directional clue. Note that these names also recorded 52-week highs in early March and are above their rising 200-day moving averages. Even though they underperformed in March-April, the bigger trends are still up and the pullbacks look like corrections.
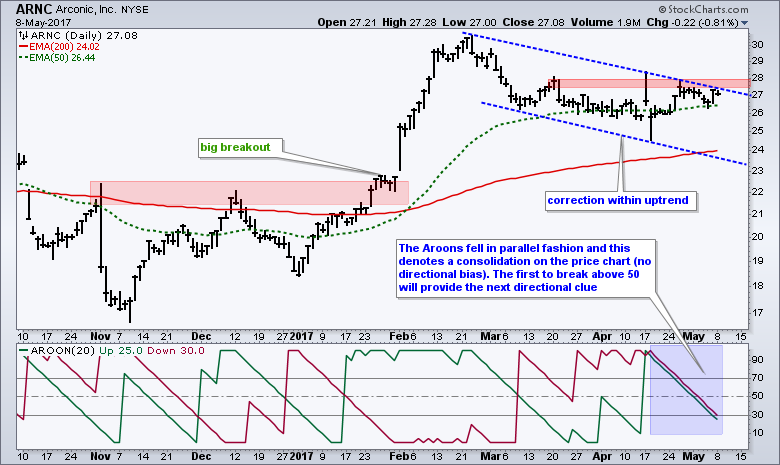
Aroons Signal Consolidaiton for Arconic
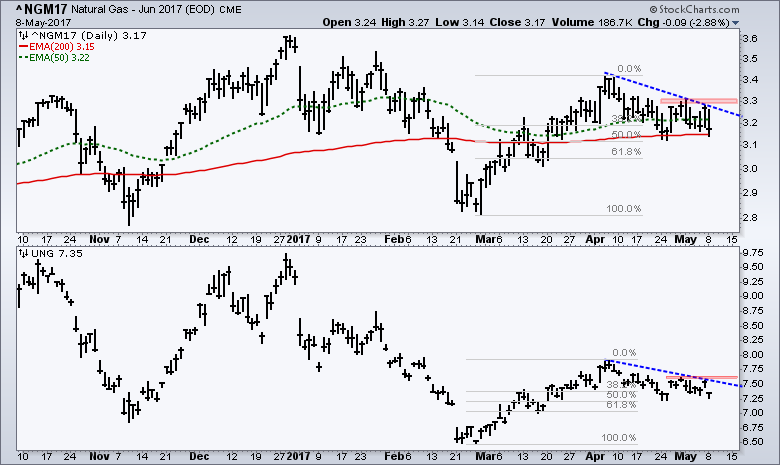
A Small Correction for Natty?
Oil hit a multi-month low this month, but June Natural Gas (^NGM17) remains well above its late February low and at a potential reversal zone. I am not a big fan of the energy space right now, but would note that the long-term trend is up because the 50-day EMA is above the 200-day EMA and price is just above the 200-day EMA. The pullback over the last five weeks retraced around 50% of the prior decline. Look for a close above 3.31 to reverse this five week slide. The bottom window shows the Natural Gas ETF (UNG) for reference. Note that UNG is only for short-term trading because it has a large tracking error over the long-term.
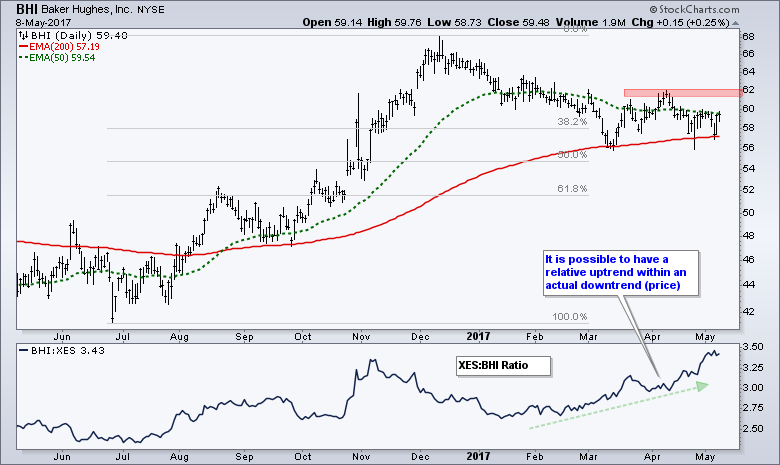
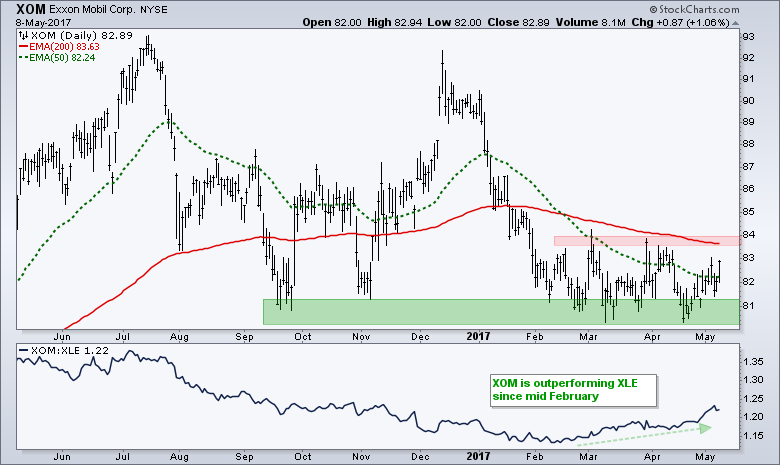
BHI and XOM Held Up Better than their Peers
Baker Hughes (3.84%) is the biggest component in the Oil & Gas Equip & Services SPDR (XES) and ExxonMobil (24.03%) is the biggest component of the Energy SPDR (XLE). These two stocks are interesting because they both held up much better than their peers over the last few months. The charts below shows price relatives in the lower windows (BHI:XES ratio and XOM:XLE ratio). These ratios turned up in mid February and this means both held up better than their group. Relative strength during a weak period means these two could lead when/if the energy sector rebounds.
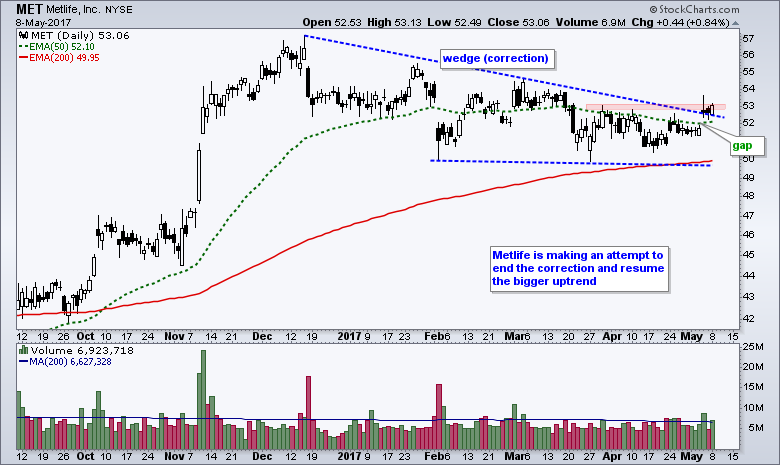
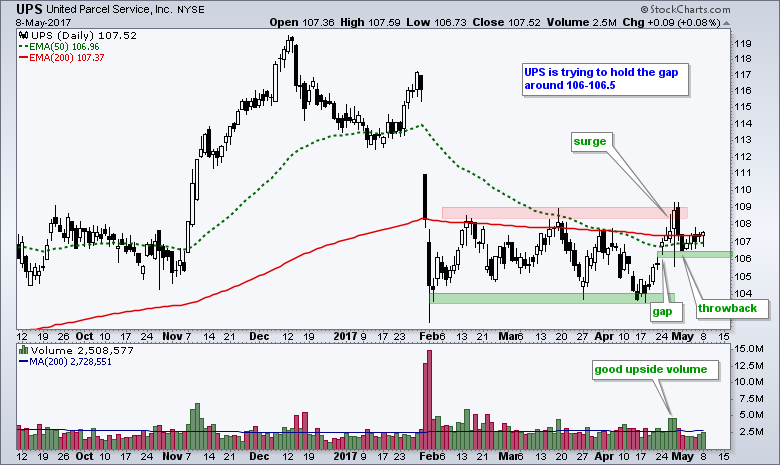
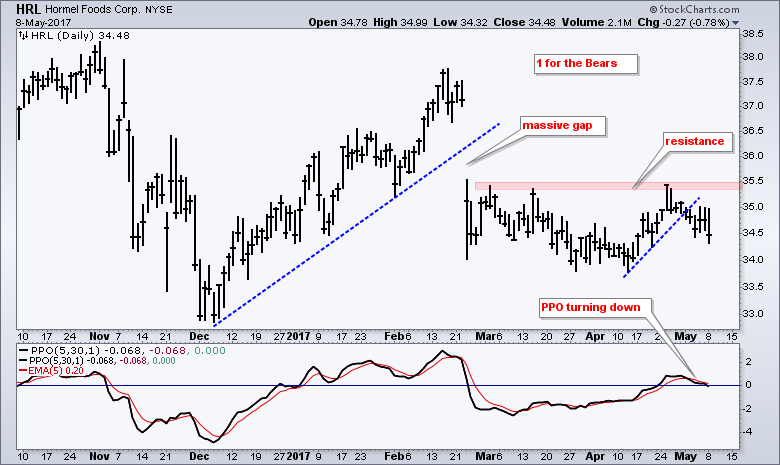
Charts to Watch: MET, UPS, HRL and AMGN
******************************************************
Spotting Pullbacks and Upturns within an Uptrend using RSI and MACD Histogram.
Difference between EMA and SMA - Using %Above 200-day EMA for Breadth Analysis.
Backtesting Different Moving Average Pairs with SPY, QQQ and IWM.
ETF Master ChartPack - 300+ ETFs organized in a Master ChartList and in individual groups.
Follow me on Twitter @arthurhill - Keep up with my 140 character commentaries.
****************************************
Thanks for tuning in and have a good day!
--Arthur Hill CMT
Plan your Trade and Trade your Plan
*****************************************


