.... Split Performance Hinders Biotech ETF
.... Amgen Lagging Biotechs and Market
.... HealthCare SPDR Holds Breakout
.... Pfizer Slows to a Crawl
.... Delivery and Trucking Weigh on Dow Transports
.... Use Sector Summary to Drill Down
.... Refiner Stocks Catch a Bid
.... Stocks to Watch: AES, EMR, FLIR, NTAP
Split Performance Hinders Biotech ETF
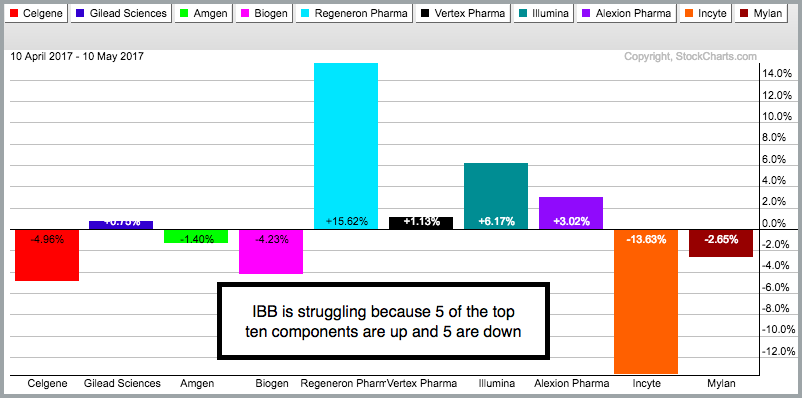
The Biotech iShares (IBB) has been struggling since August 2016 and this is largely because several of its big components are also struggling. Gilead (GILD) is down 14% since August, Biogen (BIIB) is down 15%, Amgen is down 6% and Alexion (ALXN) is down 9.5%. As a result IBB is trading right where is was back in August and up just .86% over the past month. The PerfChart below shows that 5 of the top 10 stocks are up and 5 are down. It is hard to make headway when the performance is mixed for the top ten stocks, which account for over 50% of the ETF.
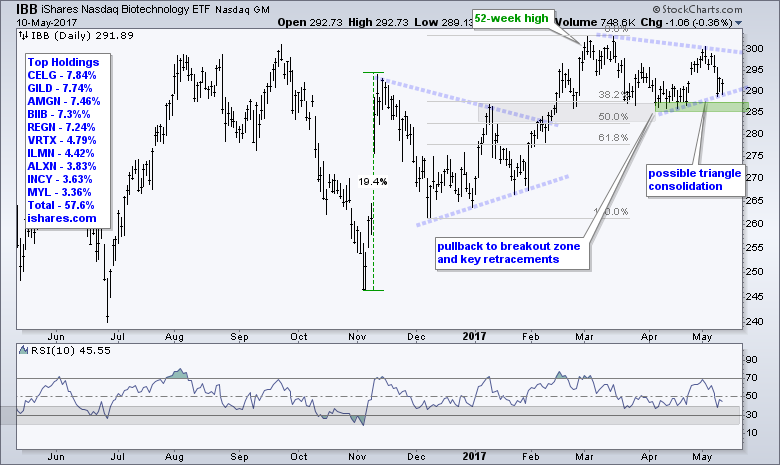
The chart below shows IBB hitting a 52-week high in early March and then consolidating with a possible triangle consolidation. IBB fell sharply on Friday-Monday and then firmed on Tuesday-Thursday. Thus, a higher low could form here. The April lows mark a support zone in the 285-287 area.
Amgen Lagging Biotechs and Market
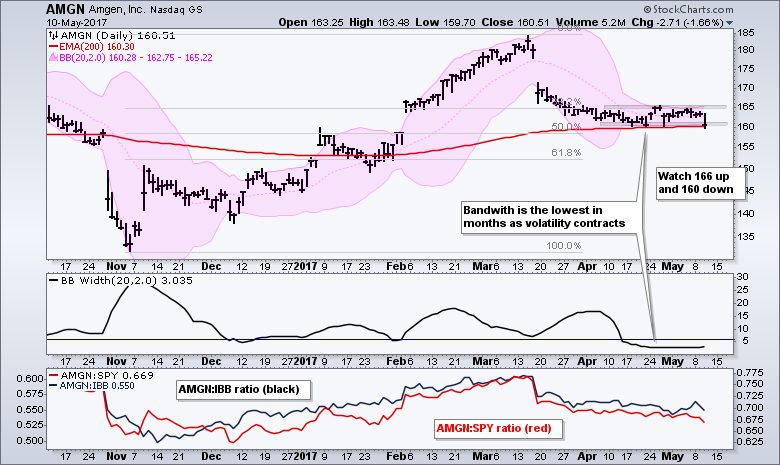
I highlighted AMGN on Tuesday because the stock was consolidating in the 38-50% retracement zone. The Bollinger Bands seriously contracted as BandWidth dipped to its lowest level in months. It looks like AMGN is making a break to the downside with Wednesday's sharp decline. The lower window shows AMGN underperforming SPY (red line) and AMGN underperforming IBB (black line).
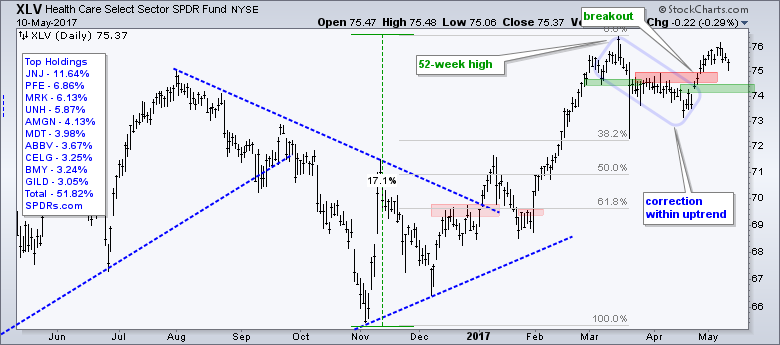
HealthCare SPDR Holds Breakout
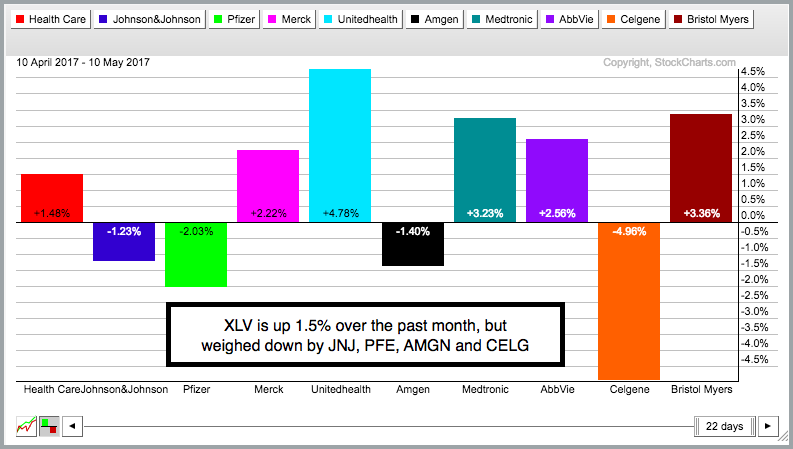
The HealthCare SPDR (XLV) is performing a little better than IBB over the past month, but performed is also weighed down by some top components. The PerfChart below shows 6 of the top 10 with gains and 4 with losses. XLV, meanwhile is up 1.5% since April 10th.
The price chart shows XLV with a surge in February, a 52-week high in March and a pullback into April. The 52-week high is enough to suggest a long-term uptrend and this means the pullback is a correction within that uptrend. XLV broke out with a surge in late April and this breakout is holding so far.
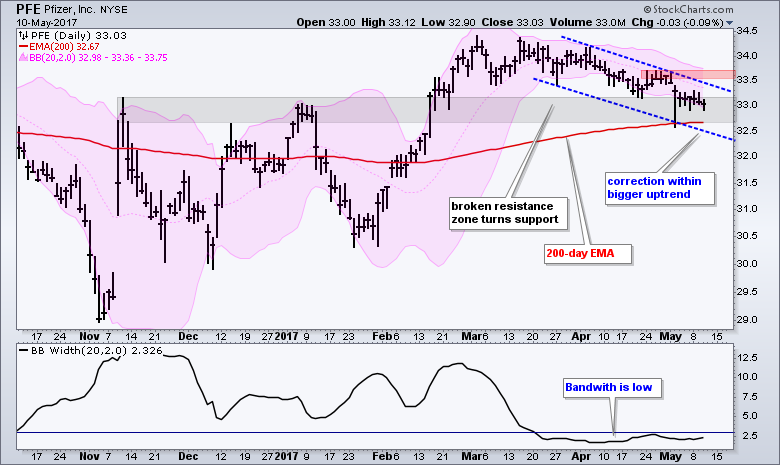
Pfizer Slows to a Crawl
Within the healthcare sector, I am watching Pfizer (PFE) quite closely because it is correcting within a bigger uptrend. The stock broke out with a big move in February and fell back to the breakout zone in May. Volatility contracted as the stock closed between 33 and 34 for the last 25 days. Talk about little movement. Notice that the Bollinger Bands narrowed and BandWidth has been below 3 since mid March. I am watching 33.7 for a breakout that would signal an end to the correction.
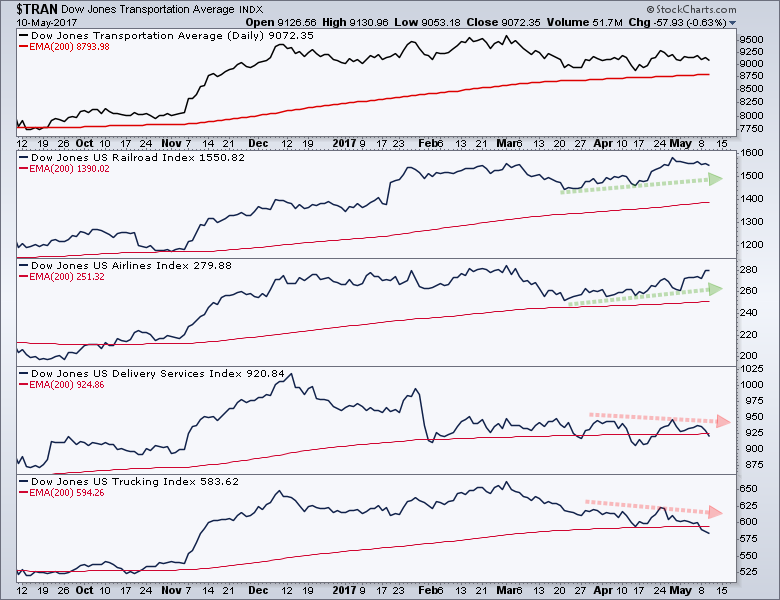
Delivery and Trucking Weigh on Dow Transports
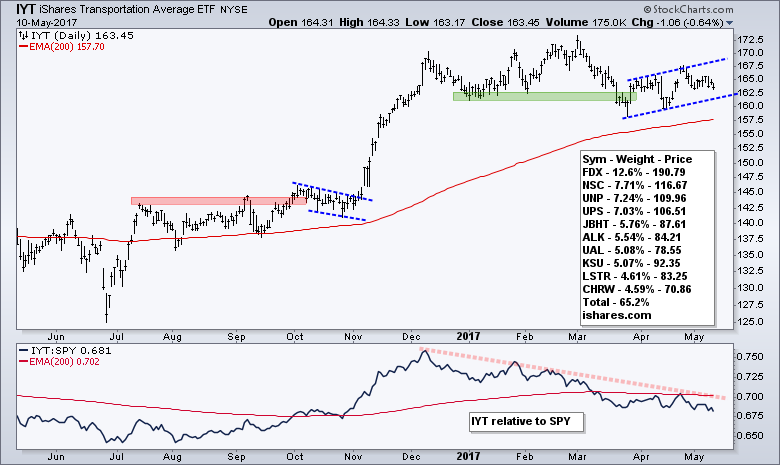
I am not a big fan of the Dow Transports and the Dow Industrials because they are price weighted averages that give the most weight to the stocks with the highest price. In addition, there are only 30 stocks in the Dow Industrials and just 20 stocks in the Dow Transports. They are narrow averages that are driven by a few high-priced stocks. The chart below shows the Dow Transports in the top window with the four main industry groups: railroads, airlines, delivery services and trucking. Railroads and airlines are performing well, but delivery services and trucking are not. In particular, sharp declines in FedEx (FDX) and UPS (UPS) hit the DJ US Delivery Services Index ($DJUSAF) on Wednesday. These two high-priced stocks account for almost 20% of the Dow Transports. The next chart shows the Transport iShares (IYT) for reference.
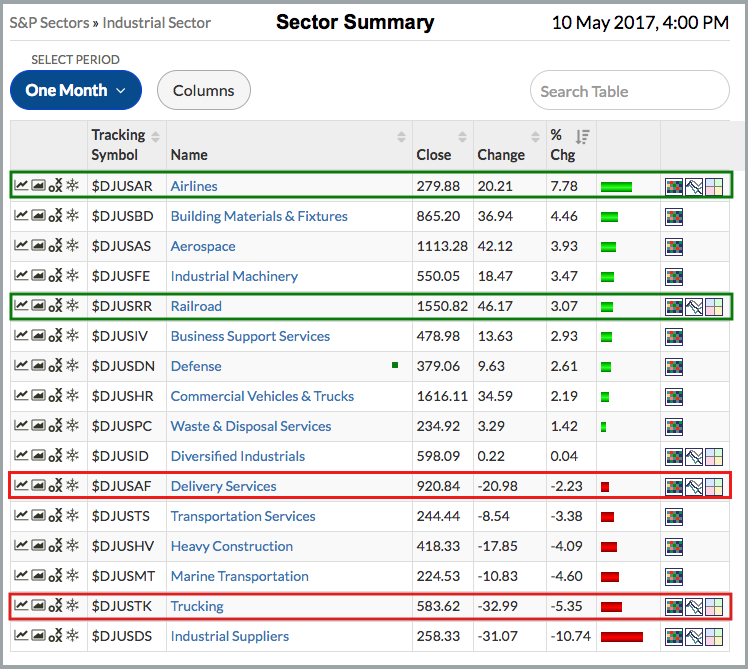
Use Sector Summary to Drill Down
StockCharts users can drill down into sectors and industry groups using the Sector Summary. The image below shows the industrials sector and the industry groups in this sector. You can hide/show columns by selecting the columns button. You can also change the performance period using the timeframe button in the upper left (default is intraday). The image below shows 1-month performance for the industry groups. We can see airlines and railroads leading, while delivery services and trucking are lagging.
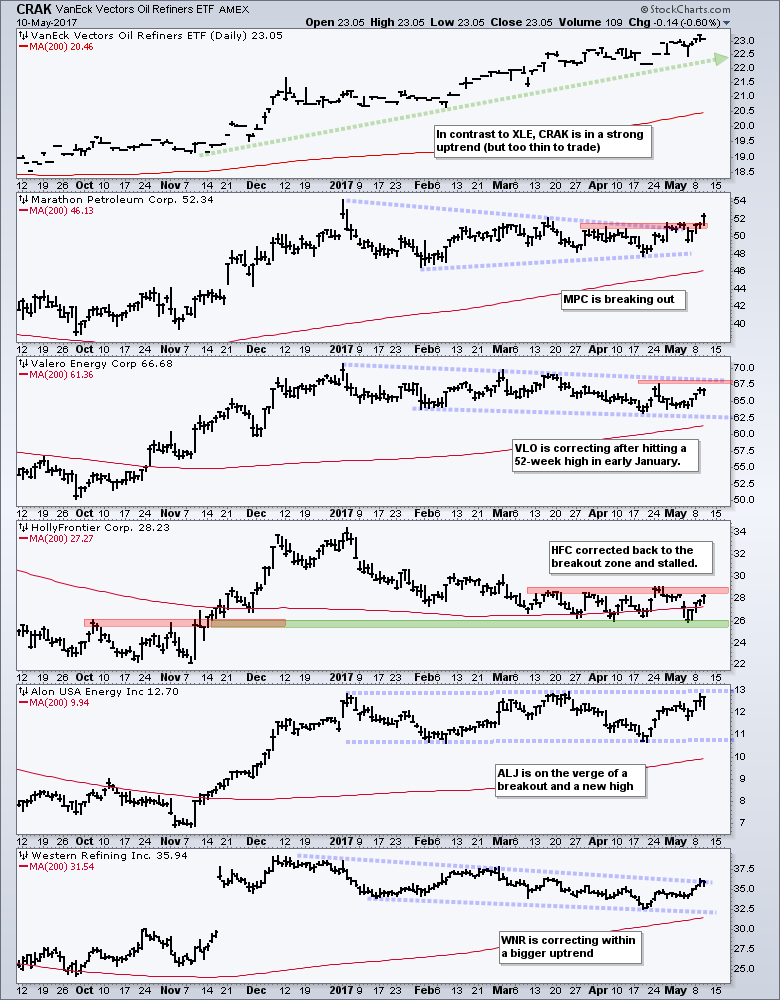
Refiner Stocks Catch a Bid
In contrast to the Energy SPDR (XLE) and Oil & Gas E&P SPDR (XOP), the Refiners ETF (CRAK) remains in a strong uptrend and hit a new 52-week high this week. CRAK is too thin for trading purposes, but we can use it for a broad industry group assessment. Also note that it is an international ETF with over 50% of its holdings coming from outside the US. Check out the Van Eck website for the latest holdings.
The chart below shows CRAK with five US refining stocks. Marathon Petroleum (MPC) and Alon USA Energy (ALJ) are the strongest of the group. Valero (VLO) and Western Refining (WNR) are in downtrends with falling channels, which could be corrections after the surge from November to December. Holly Frontier (HFC) found support near its breakout zone and firmed the last two months. Look for a breakout at 29 to turn bullish there.
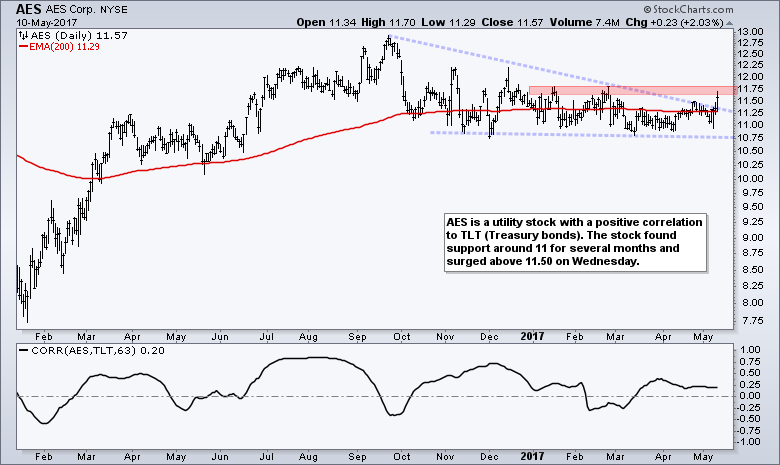
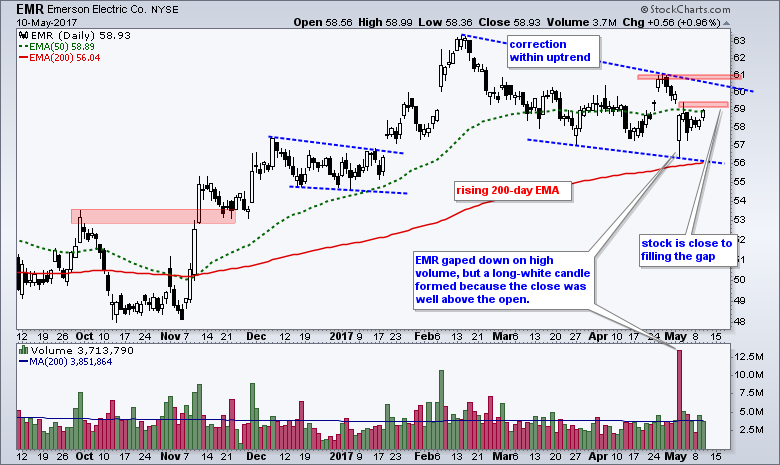
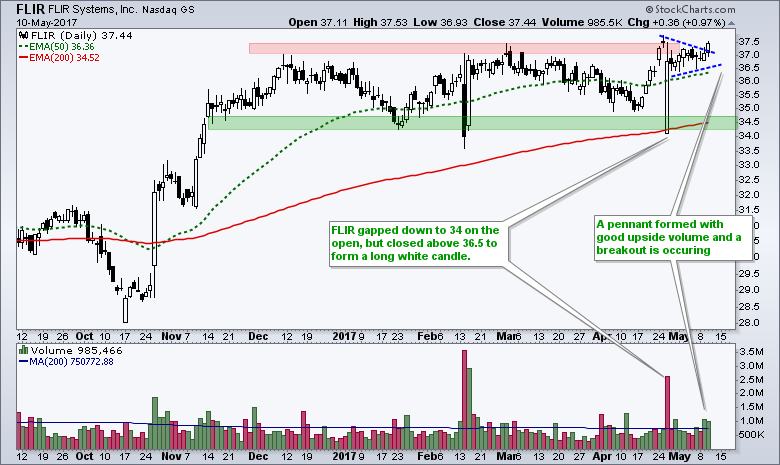
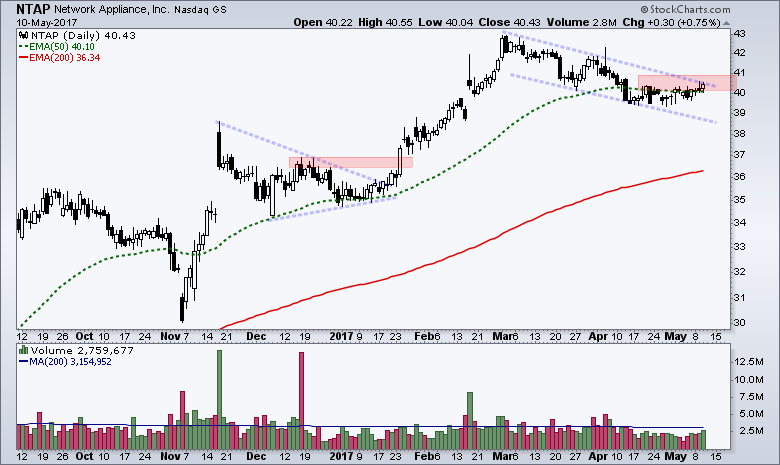
Stocks to Watch: AES, EMR, FLIR, NTAP
******************************************************
Spotting Pullbacks and Upturns within an Uptrend using RSI and MACD Histogram.
Difference between EMA and SMA - Using %Above 200-day EMA for Breadth Analysis.
Backtesting Different Moving Average Pairs with SPY, QQQ and IWM.
ETF Master ChartPack - 300+ ETFs organized in a Master ChartList and in individual groups.
Follow me on Twitter @arthurhill - Keep up with my 140 character commentaries.
****************************************
Thanks for tuning in and have a good day!
--Arthur Hill CMT
Plan your Trade and Trade your Plan
*****************************************


