Small-Cap High-Low Line is Still Rising
The bulk of the evidence remains bullish for stocks, but small-caps and mid-caps continue to drag their feet. The chart below shows the cumulative High-Low Line for S&P SmallCap High-Low Percent ($SMLHLP) with the 10-day EMA (pink). Notice that the High-Low Line is still rising and above its 10-day EMA. This is bullish and still shows that new highs are outpacing new lows within the S&P Small-Cap 600. A move below the 10-day EMA would signal a downturn in the High-Low Line and weakness in High-Low Percent.
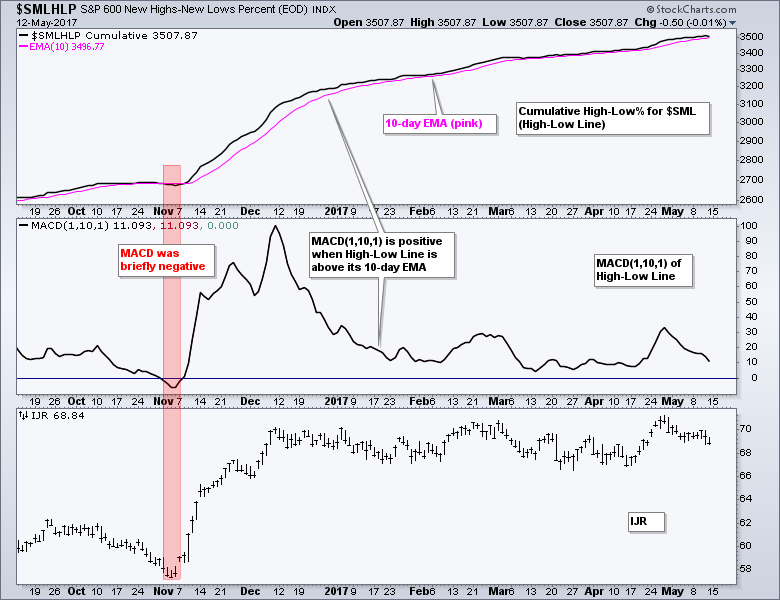
Chartists can also measure the distance between the High-Low Line and the 10-day EMA using MACD(1,10,1). MACD is positive when the High-Low Line (1-day EMA) is above the 10-day EMA. A MACD move below zero would signal a downturn in the High-Low Line. Chartists can also plot High-Low Lines for S&P 1500 High-Low Percent ($SUPHLP), S&P 500 High-Low% ($SPXHLP), S&P 400 High-Low% ($MIDHLP) and Nasdaq 100 High-Low% ($NDXHLP). Click on the chart below to open it as a SharpChart and change the main symbol.
 ----- Written Commentary ----- Art's Charts ChartList (updated 13-May) -----
Despite a big stall in the S&P SmallCap iShares (IJR) and S&P MidCap SPDR (MDY), large-caps continue to hold up and SPY is holding its latest breakout. In particular, I am watching the gaps created on April 24th and 25th because these triggered breakouts in SPY, MDY, IJR and several other ETFs. A close below the April 21st close would fill these gaps and negate the breakouts. I am also watching bonds for clues because the 20+ YR T-Bond ETF (TLT) fell over the last three weeks and then popped on Friday. This key bond benchmark is at a potential reversal zone and an upside breakout could have negative ramifications for stocks and the finance sector, and positive ramifications for the utilities sector and gold.
******************************************************
ETF Master ChartPack - 300+ ETFs organized in a Master ChartList and in individual groups.
Follow me on Twitter @arthurhill - Keep up with my 140 character commentaries.
****************************************
Thanks for tuning in and have a good day!
--Arthur Hill CMT
Plan your Trade and Trade your Plan
*****************************************


