.... Will Bonds or Small-caps Turn Up First? (IJR, MDY, TLT, IEF)
.... Citigroup is Leading the Big Banks (XLF, JPM, BAC, MS, GS)
.... A Big ETF Provider and Two Brokers (BLK, SCHW, ETFC)
.... Three Railroads with Long-term Uptrends (UNP, NSC, KSU)
.... Three Big Utilities Go for Breakouts (AES, D, DUK, SO) ....
Will Bonds or Small-caps Turn Up First?
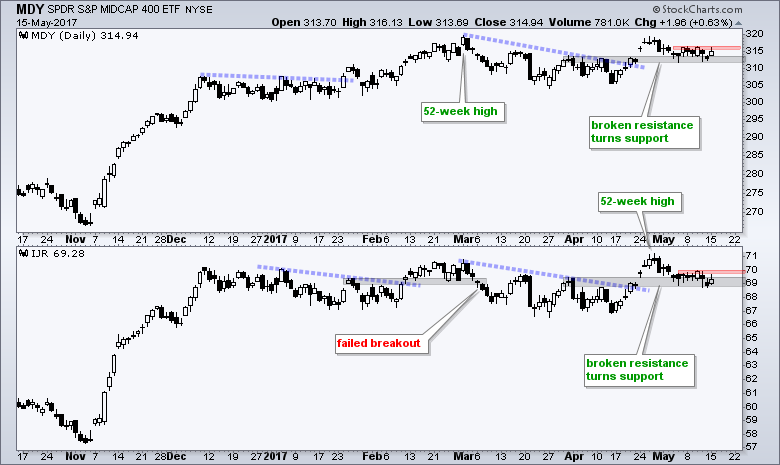
The S&P SmallCap iShares (IJR) and the S&P MidCap SPDR (MDY) continue to drag their feet and underperform the S&P 500 SPDR (SPY) and Nasdaq 100 ETF (QQQ). Their charts, however, are not bearish. Both hit 52-week highs on March 1st and IJR hit a 52-week high in late April. Most recently, both broke out with gaps and surges in late April. They then fell back to these breakouts zones and broken resistance is turning into support (gray areas). A close below 310 in MDY and 68.5 in IJR would break these support zones and negate the breakouts. As long as support holds, the breakouts are in play and I will be watching last week's highs for the next clue. A break above the red resistance zones would mark a successful test of the breakout zones and a resumption of the late April advance.
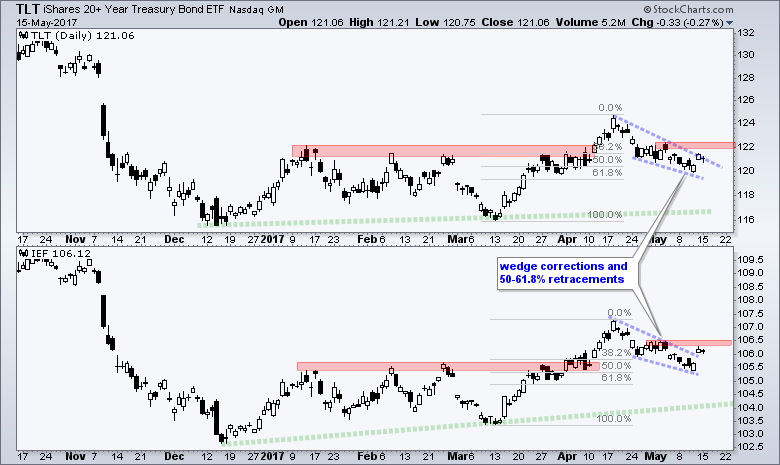
The next chart shows the 20+ YR T-Bond ETF (TLT) and the 7-10 YR T-Bond ETF (IEF). Notice that these Treasury bond ETF fell sharply when IJR and MDY surged (early November to mid December). TLT and IEF have been zigzagging their way higher since mid December and a falling wedge marking the most recent "zag". Both bounced on Friday to provide the first clue of a wedge breakout. They stalled Monday and I am now watching for follow through with a break above the early May high (red resistance zones). Such moves could be negative for stocks because it would show money moving into safe havens.
Taken together, I think we can watch the IJR/MDY pair for clues on the next stock market move and the TLT/IEF pair for clues on the bond market. Even though it is possible for all four to break out to the upside, I would normally expect these pairs to move in opposite directions. Upside breakouts in IJR and MDY, therefore, would be negative for TLT and IEF. Conversely, upside breakouts in TLT and IEF would be negative for IJR and MDY. Note that utilities and gold are positively correlated with Treasury bonds and would benefit from upside breakouts in TLT/IEF. Conversely, banks are negative correlated and could suffer from breakouts in TLT/IEF. See the Weekly Market Review & Outlook for details.
Citigroup is Leading the Big Banks
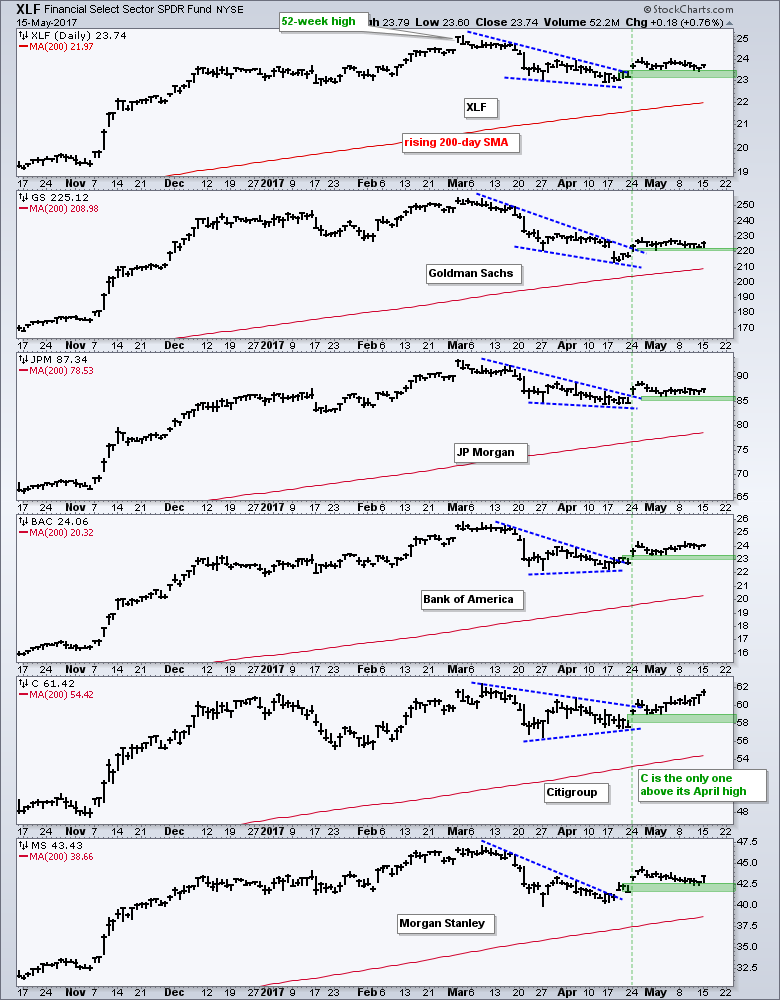
I continue to watch the Finance SPDR (XLF) and the big banks for clues on the market. First and foremost, all are above their rising 200-day SMAs (red). XLF has gone nowhere the last three weeks, but it is holding above the breakout zone. A close below 23 would negate the breakout and argue for a test of the 200-day. The green zones mark the breakout zones for the other banks and all are holding these zones for now. Citigroup is the strongest of the group because it is the only one that exceeded its April high.
I watched a good CNBC interview with Steve Eisman of The Big Short, which is a great book/movie. Melissa Lee was looking for the next big dislocation (short), but Eisman said there were none to be found right now. Eisman noted that he was seeing more long opportunities than short opportunities. The interview gets quite interesting around 5min mark. Eisman has a longer time horizon than most CNBC pundits and this helps me develop themes to consider over the next 6 to 12 months (banks, autos and retail REITs).
A Big ETF Provider and Two Brokers
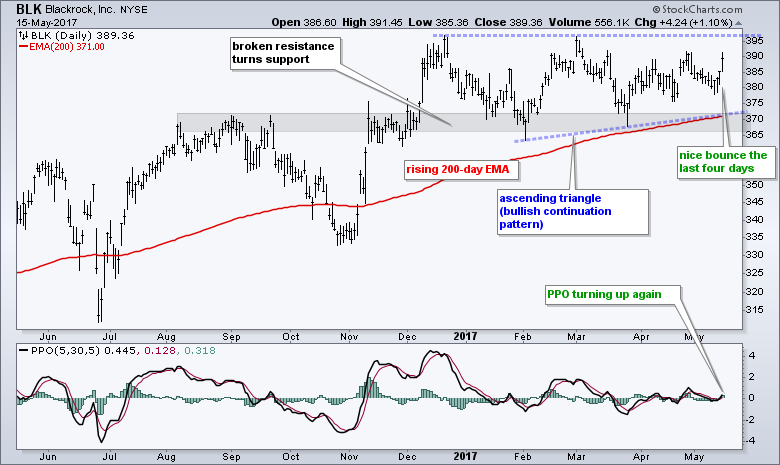
BlackRock (BLK) is consolidating above the breakout zone with a large ascending triangle at work. The stock turned up the last four days and the stocks looks poised for a resistance challenge.
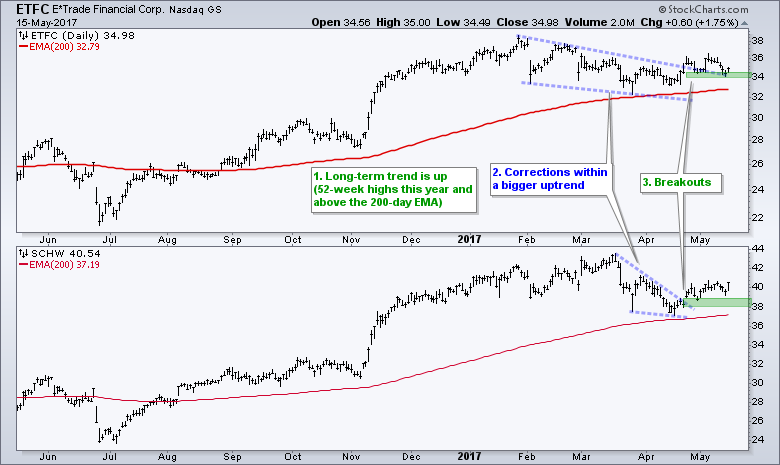
E*Trade (ETFC) and Schwab (SCHW) corrected into April and then broke out with surges in late April. ETFC is struggling to hold this breakout, but it is bullish as long as 35 holds. SCHW is stronger with support marked in the 38-39 area.
Three Railroads with Long-term Uptrends
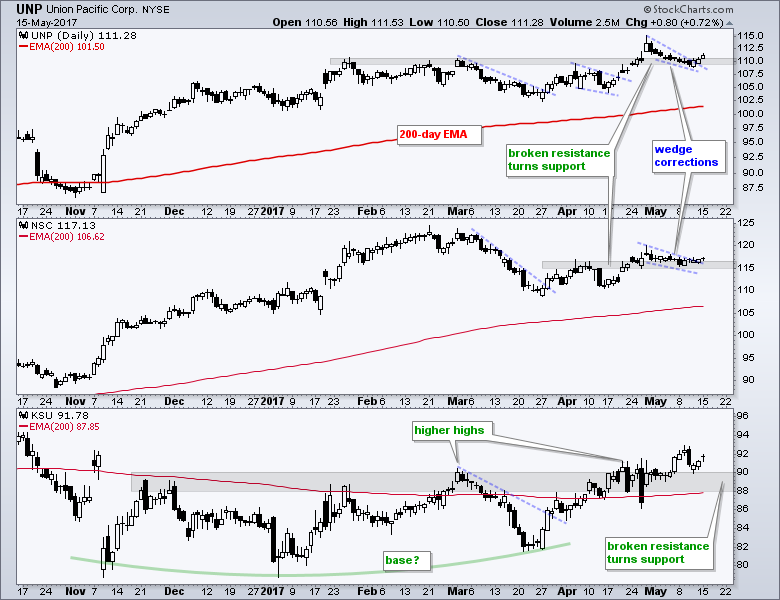
The next chart shows three railroad stocks that account for around 20% of the Transport iShares (IYT). Union Pacific (UNP) broke resistance in the 110 area and then fell back with a falling wedge in May. Broken resistance marks first support and signs of an upturn are emerging as UNP moved above the wedge line. Norfolk Southern (NSC) is not as strong as UNP, but it did exceed the mid April high and fell back with a wedge correction. Kansas City Southern (KSU) formed a large base from November to March and broke resistance in May. The breakout zone around 88-90 turns first support.
Three Big Utilities Go for Breakouts
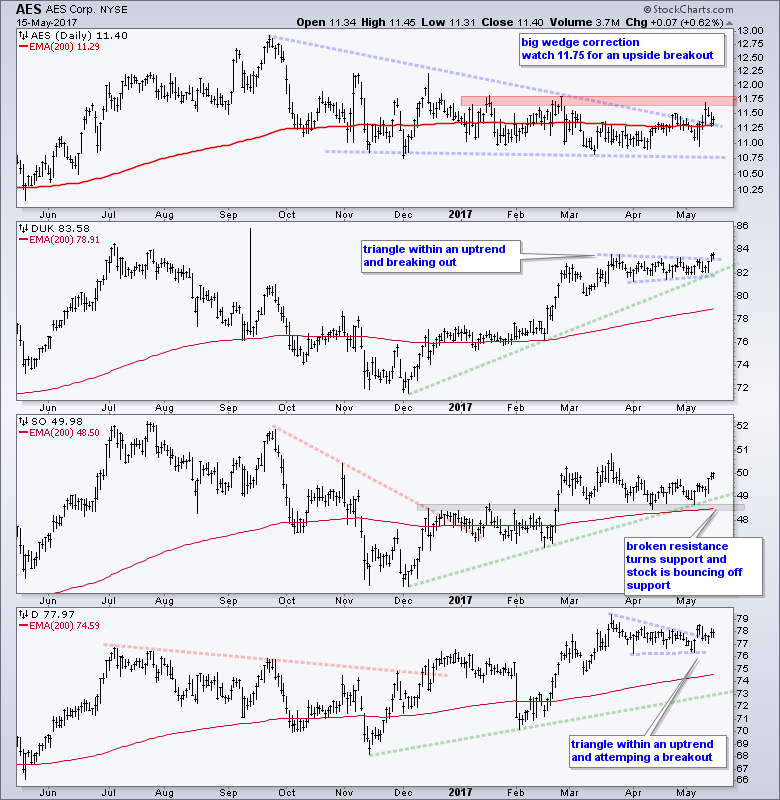
The next chart shows four utilities stocks in various stages of consolidation breakouts. Duke Energy (DUK), Southern Co (SO) and Dominion Energy (D) account for 23.43% of XLU and AES Corp (AES) accounts for just 1.16%. AES (top window) is the smallest and the laggard in the group. The stock remains in a large consolidation/correction and I am watching 11.75 for a breakout. DUK is breaking out of its triangle, SO is bouncing off resistance-turned-support and D is trying to hold its triangle breakout. All four stocks are positively correlated to TLT and IEF so traders should watch Treasury bonds closely.
******************************************************
ETF Master ChartPack - 300+ ETFs organized in a Master ChartList and in individual groups.
Follow me on Twitter @arthurhill - Keep up with my 140 character commentaries.
****************************************
Thanks for tuning in and have a good day!
--Arthur Hill CMT
Plan your Trade and Trade your Plan
*****************************************


