 |
.... The Stealthy Looking Correction .... AD Volume Lines Reflect Corrective Period .... High-Low Lines Have Yet to Turn Down .... Percent Above 200-day EMA Deteriorates Further .... SPY Gaps Down like its September 2016 .... Setting a Correction Zone for QQQ .... IJR: Breakout Failed, but Short-term Oversold .... Finance and Industrials Gap Lower .... Low Correlations are Moving Targets .... Biotech ETFs Consolidate within Uptrends .... Copper Surges off Support Zone (JJC, COPX) .... Steel Stocks Power XME Higher (XME, SLX) .... A Long-term Uptrend for Treasury Bonds (TLT, $TNX) .... Gold Forges another Higher Low .... Dollar Extends 2017 Downtrend .... Oil Bounces toward Middle of Trading Range .... |
The Stealthy and Picky Correction
Everyone is looking for a correction, but it appears that we have been in some sort of a correction since early March - sans QQQ, of course. The chart below shows closing prices for the EW S&P 500 ETF (RSP) and the big four (QQQ, SPY, MDY, IJR). RSP provides an interesting twist on the market because it is an equal-weight version of the S&P 500. As such, it represents performance for the "average" stock in the S&P 500. RSP hit a 52-week high last week and remains in an uptrend. Even with Wednesday's sharp decline, the ETF is still less than 3% from a 52-week high. In fact, RSP, SPY and QQQ are less than 2% from 52-week highs, while MDY and IJR are less than 5% from 52-week highs.
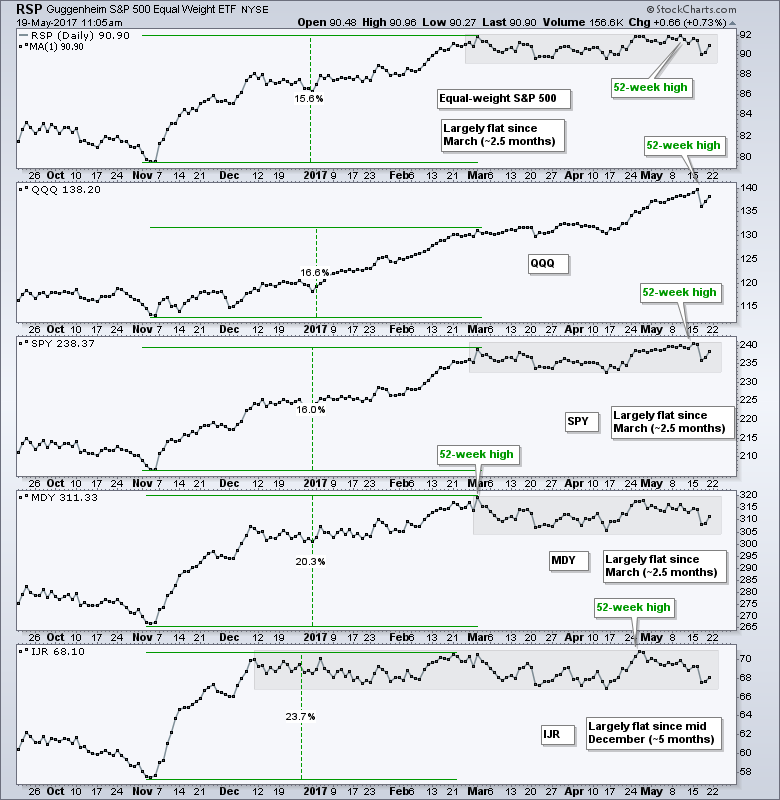
Despite uptrends and proximity to new highs, we can see that price action has clearly flattened since March for RSP, SPY and MDY. Even though IJR hit a new high in late April, price action has been flat since mid December. I would not call this a topping formation, but this flat trading means some stocks within the index are undergoing correction. Some stocks are not correction and this is keeping the index range bound. A break below the March-April lows would be negative and argue for more correction, not the start of a major bear market. As far as large-caps are concerned, keep in mind that SPY is still up around 15% from its November lows and a 6-8% correction would be perfectly normal.
AD Volume Lines Reflect Corrective Period
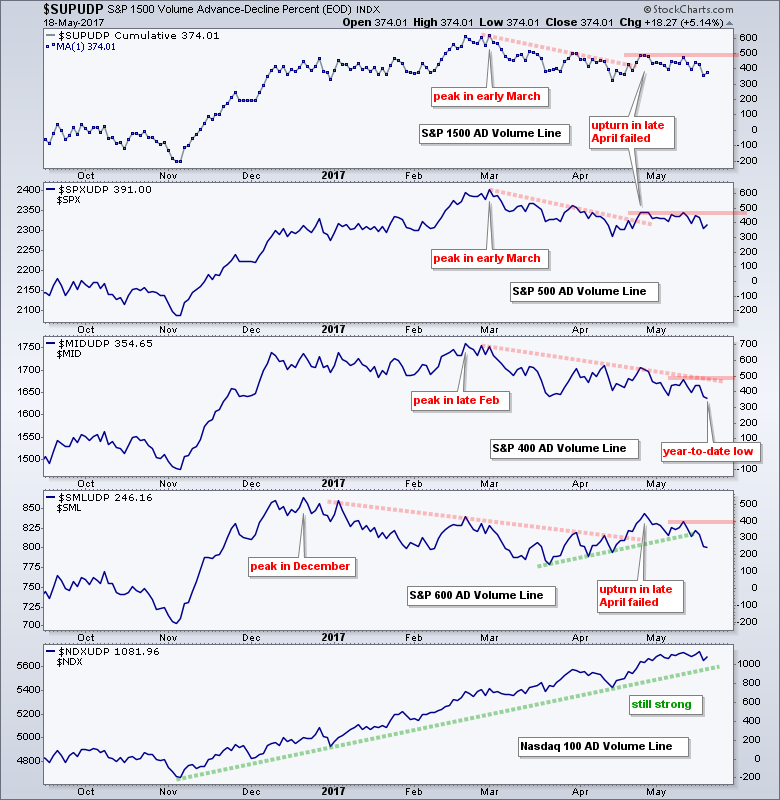
Chartists can see evidence of selling pressure in the AD Volume Lines. The AD Volume Line is a cumulative measure of Net Advancing Volume, which is advancing volume less declining volume. It is basically a running total a net buying pressure (buying pressure less selling pressure). The AD Volume Lines for the S&P 1500 and S&P 500 peaked in early March, while the S&P Mid-Cap 400 AD Volume Line peaked in late February and the S&P Small-Cap 600 AD Volume Line peaked in December. Buying pressure picked up in late April, but this upturn faded quickly with the Mid-cap AD Volume Line hitting a year-to-date low this week and the Small-cap AD Volume Line turning down the last three weeks.
High-Low Lines Have yet to Turn Down
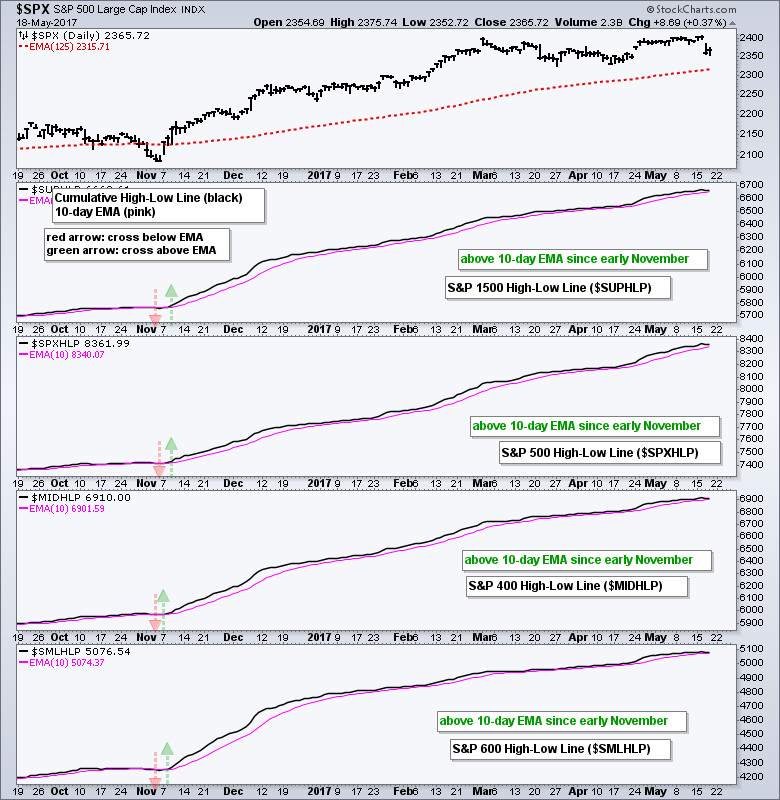
New lows expanded this week with most coming from retailers and retail REITs. These two are being hit by a seismic shift in shopping habits (online vs. in-store). Note that retail REITs account for 14% of the REIT iShares (IYR) and a whopping 19.8% of the Vanguard REIT ETF (VNQ). Weakness in retailers pushed Consumer Discretionary High-Low% ($XLYHLP) to its lowest level since June. The chart below shows the High-Low Lines for S&P 1500, S&P 500, S&P MidCap 400 and S&P Small-Cap 600. All four have been above their 10-day EMAs since early November and this means new highs are outpacing new lows. Watch for downturns and breaks below the 10-day EMA to signal an increase in new lows. Such signals would also point to a broadening correction.
Percent Above 200-day EMA Deteriorates Further
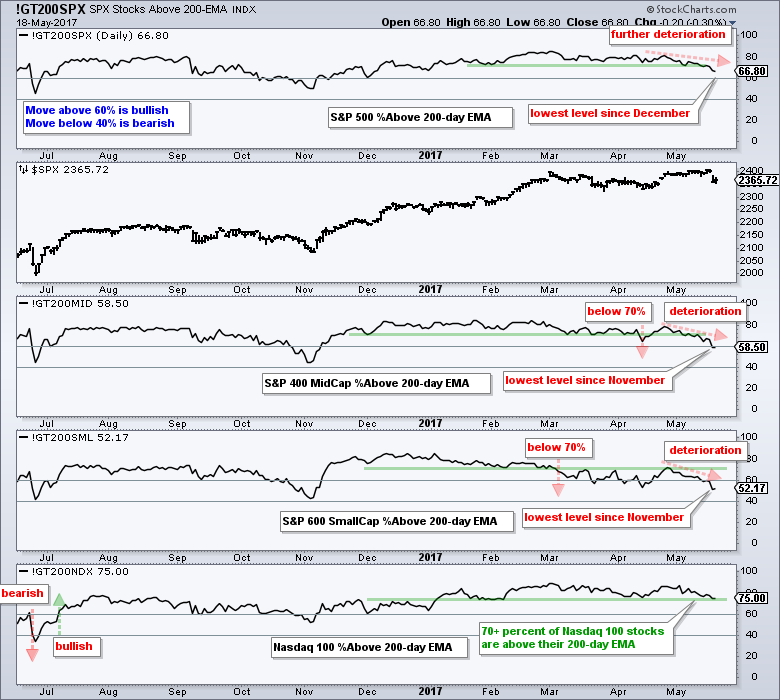
The S&P 500 joined the S&P Mid-Cap 400 and S&P Small-Cap 600 as the percentage of stocks above the 200-day EMA moved below 70% and to its lowest level since December. As of Thursday's close, 66.80% of stocks in the S&P 500 are above their 200-day EMAs. Put another way, 33.2% are below their 200-day EMAs, and this weighs on the index. Elsewhere, Mid-Cap %Above 200-day EMA (!GT200MID) and Small-Cap %Above 200-day EMA (!GT200SML) fell to their lowest levels since November. Around 48% of small-caps are currently below their 200-day EMA and this makes it extremely difficult to for the S&P SmallCap iShares (IJR) to move higher.
SPY Gaps Down like its September 2016
The S&P 500 SPDR (SPY) and S&P 500 are used to set my base-case for the stock market. It is the most widely followed benchmark, support and resistance levels seem to mean something, and the 50-200-day moving average cross works fairly well. The rest of the major index ETFs will follow the S&P 500 so a correction here will lead to corrections elsewhere, even in QQQ. Turning to the chart, I see a similarity with September 2016 when SPY hit a new high, gapped down and fell sharply. Even though the ETF bounced right after the gap-plunge, this sudden and sharp decline foreshadowed a correction that extended into early November.
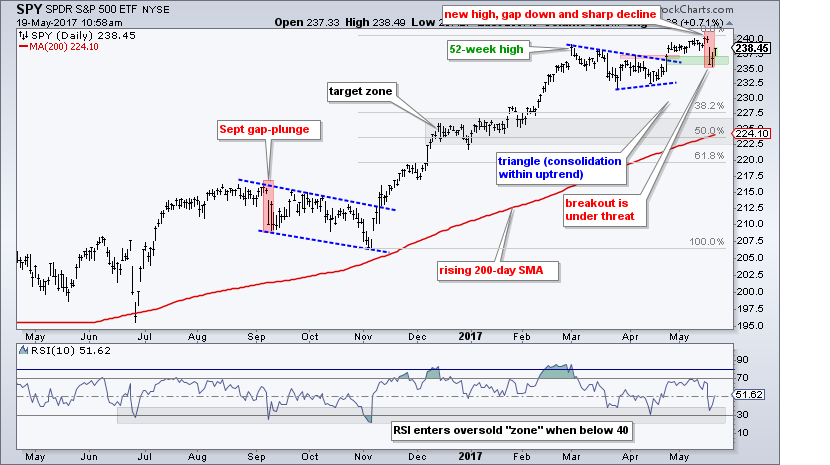
SPY hit a new high on Tuesday, gapped down on Wednesday and fell over 1.5%. The decline is challenging the triangle breakout and gap from April 24th. As noted last week, a close below 234.5 in SPY and 2347 in $SPX would fill this gap and negate the triangle breakout. SPY is the 800-pound gorilla in the market and a full market correction will not commence unless SPY joins in with a close below 234.5. Thus, a correction is on hold until this happens. Should we get a close below 234.5, the first correction target would be in the 222-227 area. The December-January consolidation, rising 200-day SMA and 50% retracement mark this target, which is still a guesstimate. Also note that an outside reversal week is likely and the 50-day SMA is near 236.50. Chartists can also keep this seasonality article in mind as June approaches.
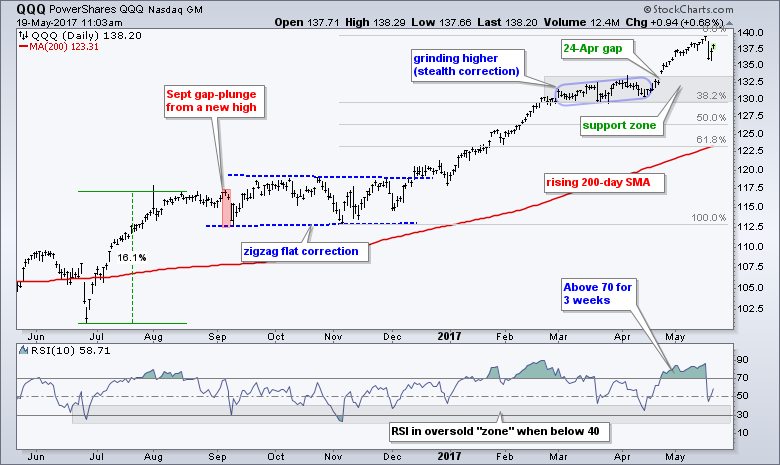
QQQ Support Zone
QQQ also gapped down on Wednesday and closed sharply lower. The March consolidation and 38.2% retracement mark a target zone for QQQ, should a broad market correction unfold.
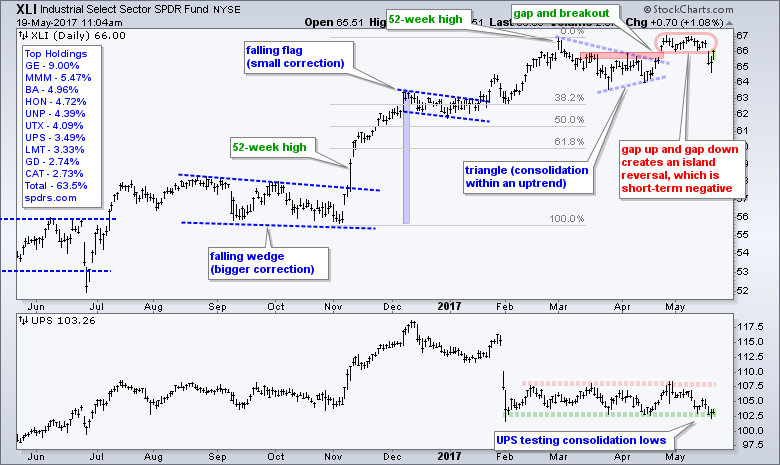
IJR: Breakout Failed, but Short-term Oversold
The S&P SmallCap iShares (IJR) failed to hold its breakout and moved below the breakout zone with a gap down on Wednesday. This has been a most frustrating range with two breakouts and two failures. Frankly speaking, it is very difficult to make money trading breakouts, especially for swing traders with a 2 to 12 week time horizon. Breakouts require strong trends to be successful and the only strong trends are in large-cap tech stocks. Mean-reversion trading is the flipside of breakout trading and a mean-reversion setup is present in IJR right now. Notice that RSI(5) moved below 30 and a move back above 30 would trigger a bullish signal. See this System Trader article for details.
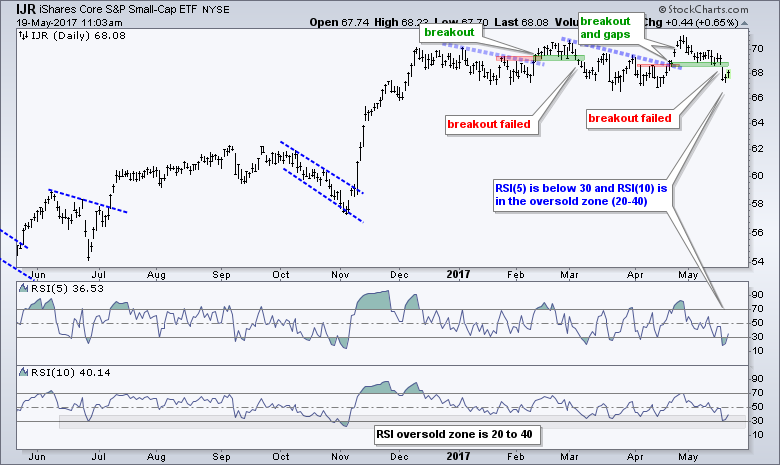
The indicator windows show RSI(5) and RSI(10) for comparison. These RSI lines have basically the same shape, but notice that RSI(5) exceeds 70 and 30 more often because it is more sensitive. A move below 30 in RSI(5) is equivalent to a move below 40 in RSI(10). This is why I have a gray zone marking the 20-40 range in RSI(10) on the chart. A move below 40 puts me on short-term alert for a possible mean-reversion trade.
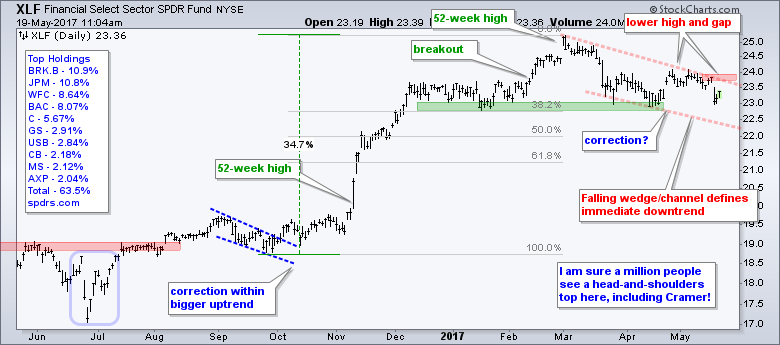
Finance and Industrials Gap Lower
The Finance SPDR (XLF) did not follow through on the late April bounce and ultimately formed a lower high with Wednesday's gap down. I am now defining this downtrend with a falling channel or wedge. This week's high and the upper trend line mark resistance at 24. The trend is down until XLF closes above this level and this downtrend in XLF adds to the argument for a broad market correction.
The Industrials SPDR (XLI) also gapped down on Wednesday and formed an island reversal. Notice how the ETF gapped above 66 in late April and then gapped back below 66 on Wednesday. The triangle breakout failed and a short-term bearish pattern is present now. This favors a correction within the bigger uptrend and this also adds to the argument for a broad market correction.
Low Correlations are Moving Targets
Should a broad market correction unfold, which is not guaranteed by any means, it means that most sectors, industry groups and stocks will come under pressure. Chartists looking to buck a potential correction might consider stocks and groups with lower correlations to the broader market. This, however, is easier said than done. Most stocks and groups are highly correlated to the broader market and correlations are fluid (they change). The chart below shows SPY and the 13-week Correlation Coefficient with a 13-week EMA for eight industry group ETFs. Currently, the Gold Miners ETF (GDX), Metals & Mining SPDR (XME) and Oil & Gas Equip & Services SPDR (XES) are negatively correlated. This is largely because they fell from mid February to late April, a period when SPY rose.
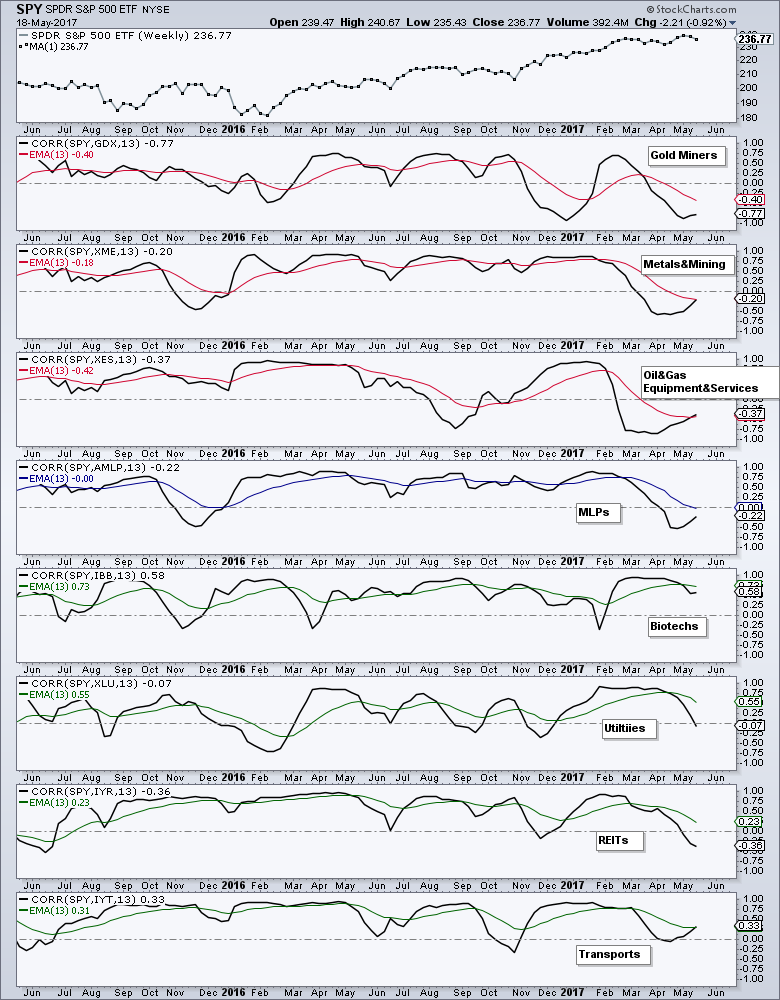
The REIT iShares (IYR), Alerian MLP ETF (AMLP) and Utilities SPDR (XLU) seem like logical alternatives, but these two are positively correlated to the broader stock market. Even the Biotech iShares (IBB) shows a strong positive correlation to the stock market, as does the Transport iShares (IYT). One is usually better off looking outside the stock market for uncorrelated opportunities.
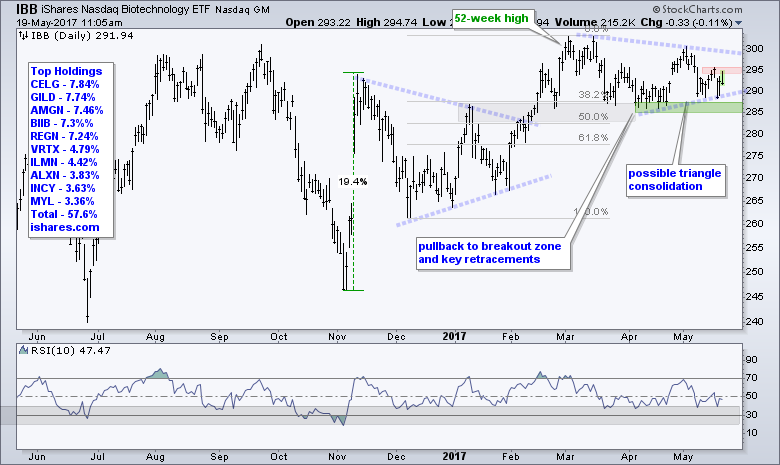
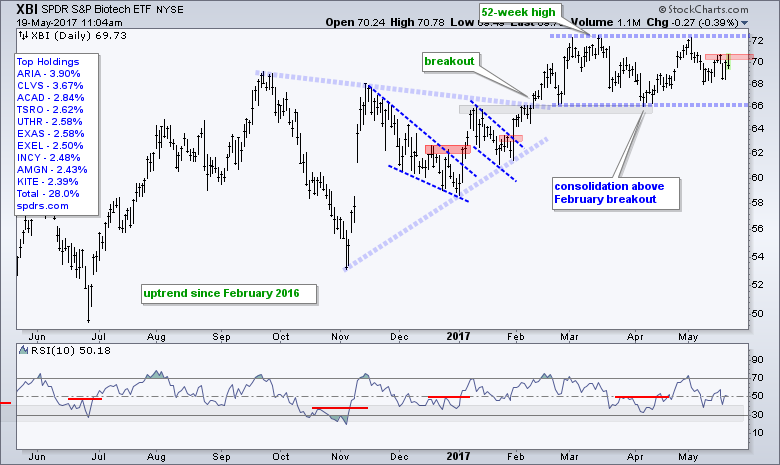
Biotech ETFs Consolidate within Uptrends
Having warned on correlations, I will still note that the Biotech iShares (IBB) and the Biotech SPDR (XBI) are holding up and consolidating within uptrends. IBB hit a new high in March and then formed a triangle the last two months. The ETF is trying to firm in the 290 area and a breakout a 296 would provide the first sign of strength. XBI is in the middle of a trading range since March and this week's high mark first resistance.
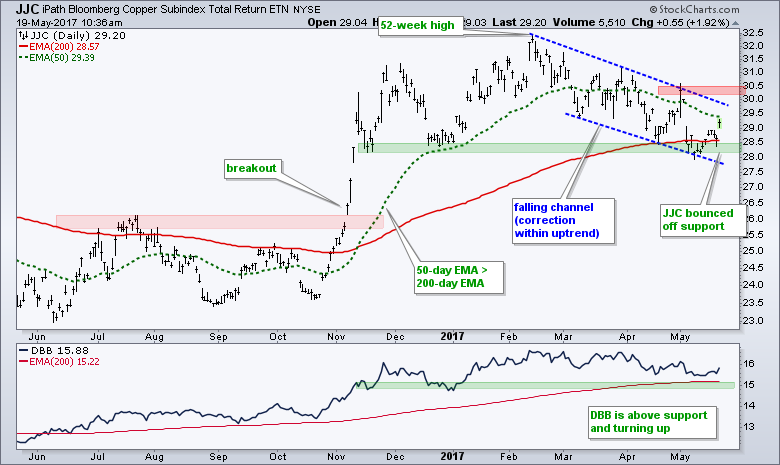
Copper Surges off Support Zone
The Base Metals ETF (DBB) and Copper ETN (JJC) surged on Friday and this puts the Copper Miners ETF (COPX) in play. I have been watching copper since it moved back to its support zone and the 200-day EMA (three weeks ago). A falling channel formed and the ETF surged off the support zone the last two weeks. This is the first sign of strength since the failed surge in late April. This late April high marks resistance and a breakout here is needed to fully reverse the correction.
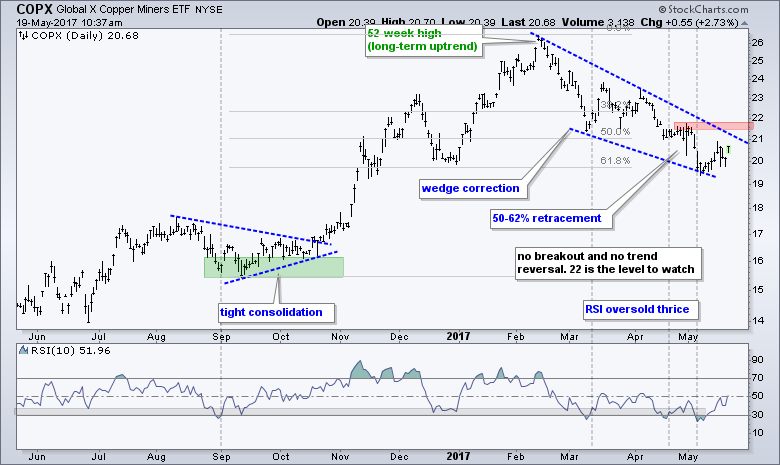
COPX bounced off the 61.8% retracement and a follow through breakout at 22 is needed to fully reverse the falling wedge correction. I consider the channel in JJC and wedge in COPX as corrections because they hit 52-week highs in February and the long-term trends are up.
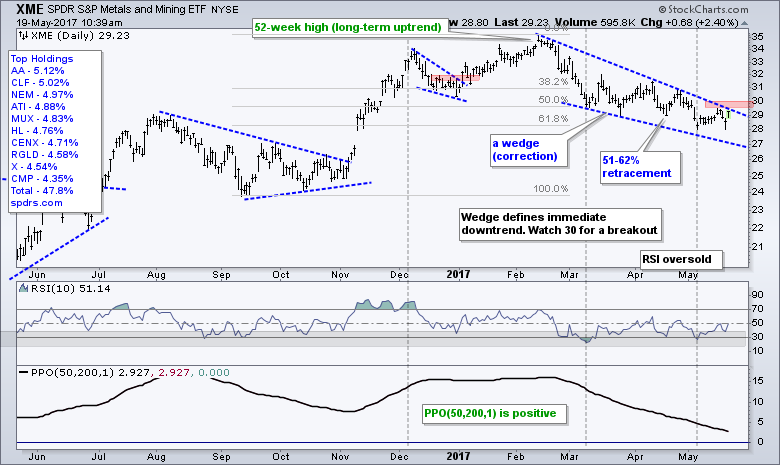
Steel Stocks Power XME Higher
I am seeing similar setups in the Metals & Mining SPDR (XME) and the Steel ETF (SLX). Notice that XME held its early May low this week and shows a bit of relative strength the last twelve days. Also notice that the ETF has recovered almost all of Wednesday's losses with a 2+ percent surge on Friday. A follow through breakout at 30 would reverse the wedge correction. Steel stocks are a big part of XME so watch the Steel ETF (SLX) for a breakout at 38.

A long-term Uptrend for TLT?
Today I will show a weekly chart for the 20+ YR T-Bond ETF (TLT) because a long-term uptrend is visible on the three year timeframe. TLT fell sharply from July to December and then managed to firm above the 2015 low. A higher low formed as the ETF broke out with a surge above 122.5 in April and again this week. I view this breakout as bullish and would re-evaluate on a close below 120.
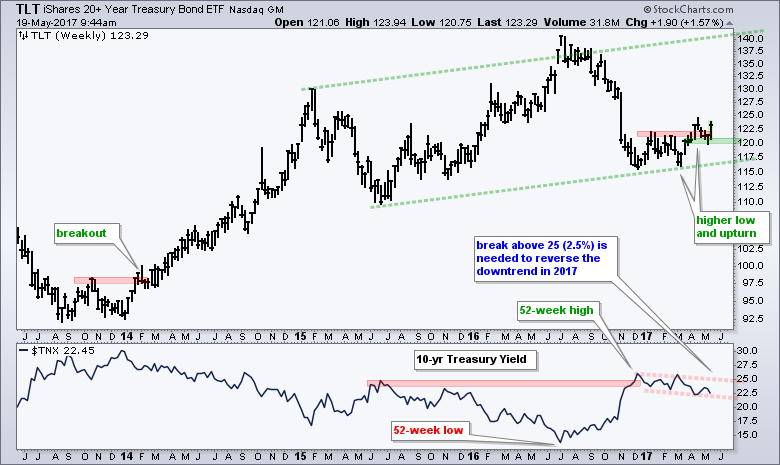
The indicator window shows the 10-yr T-Yield ($TNX), which acts as an inverse plot for the spot price of the 10-year T-Note. The 10-yr Yield surged from July to December and then fell back in 2017. The five month trend is down and a break above 25 (2.5%) is needed to reverse this slide. Lower yields and higher bond prices reflect a flight to relative safety and this is negative for risk assets, such as stocks.
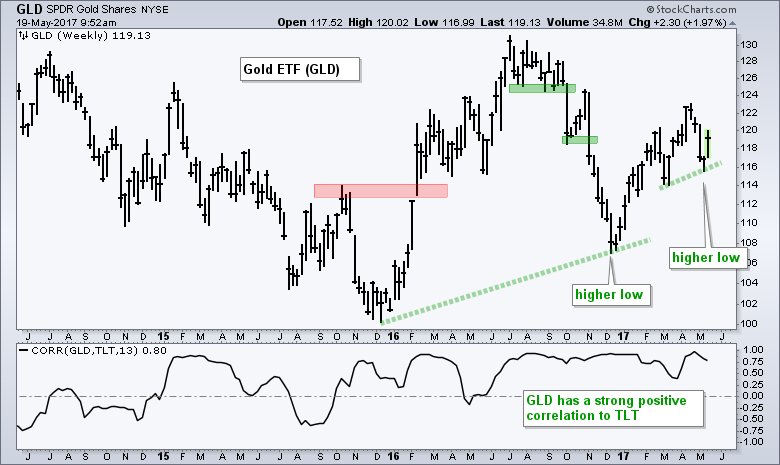
Gold Forges another Higher Low
The Gold SPDR (GLD) surged this week and formed a higher low from March to May. Note that gold benefited from a surge in TLT and plunge in the Dollar this week. On the price chart, the trend in 2017 is up and GLD reversed its four-week downswing with a surge this week (see last week's chart marking the 4-week Raff Regression Channel). Chartists can mark support at 116. I would be bullish on gold as long as TLT holds 120.
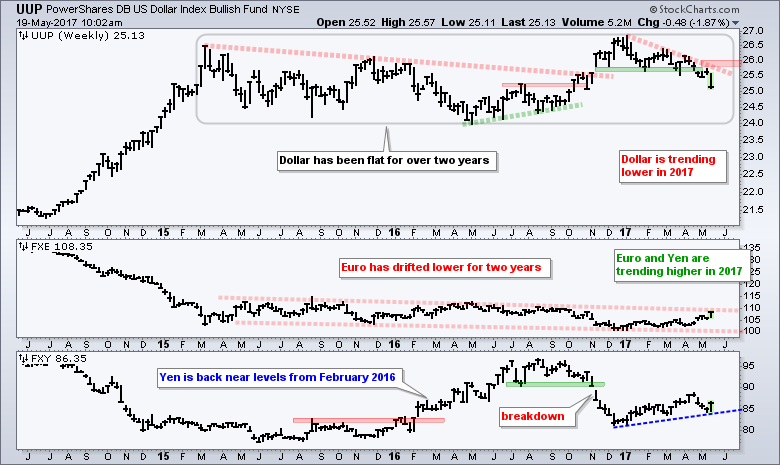
Dollar Extends 2017 Downtrend
The greenback was smacked for a big loss this week and fell to its lowest level since October 2016. Overall, the US Dollar ETF (UUP) has been locked in a trading range since March 2015 and is currently just below the mid point of this range. The swing, which is the 2017 trend, is down with resistance marked at 26. The Euro ETF (FXE) moved from around 100 in December to the 108 area this week (+8%) and the Yen ETF (FXY) is up around 7% from its December low.
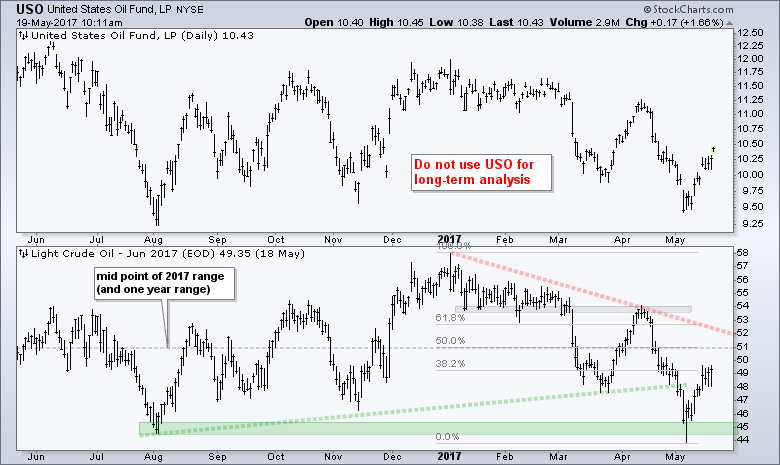
Oil Bounces toward Middle of Trading Range
Oil moved back above $50 on Friday and is nearing the midpoint of its 2017 range, which is $51. There is no long-term trend on this chart, at least none that I can identify with confidence. Oil crossed the $51 level some 20 times over the past year and is nearing this level once again. It is just one big trading range and I will leave it at that!
******************************************************
ETF Master ChartPack - 300+ ETFs organized in a Master ChartList and in individual groups.
Follow me on Twitter @arthurhill - Keep up with my 140 character commentaries.
****************************************
Thanks for tuning in and have a good day!
--Arthur Hill CMT
Plan your Trade and Trade your Plan
*****************************************


