 |
... Weight of the Evidence for Stocks .... New Lows are Ticking Up in Large-caps and Mid-caps .... %Above 200-day Holds Strong for SPX and NDX .... Stocks and Bonds Rise Together .... Flags Take Shape in IEF and TLT .... S&P 500 SPDR Holds Breakout .... IJR Tests its Breakout .... QQQ Hits Another New High .... Industrials and Finance in the Spotlight .... Metals & Mining, Steel and Copper Miners .... Oil Breaks to Eight Month Low .... Gold Breaks Wedge Support .... Dollar Remains within Falling Wedge |
Weight of the Evidence
I take a weight of the evidence approach to broad market analysis. This means I do not rely on one indicator to shape my broad market stance. Instead, I use several indicators to weight the evidence. These include the 50-day EMA and 200-day EMA for the S&P 500 SPDR, the S&P 1500 10-day EMA of AD Percent, S&P 1500 High-Low Percent, the Percentage of Stocks above the 200-day EMA, the trends for the nine sector SPDRs and the stock-bond relationship. The weight of this evidence has been bullish since March 2016 and remains bullish right now. At this point, I am simply monitoring the indicators for signals that will prove this bullish stance otherwise. As a trend follower for the most part, I will wait for the market to signal and try to refrain from jumping the gun.
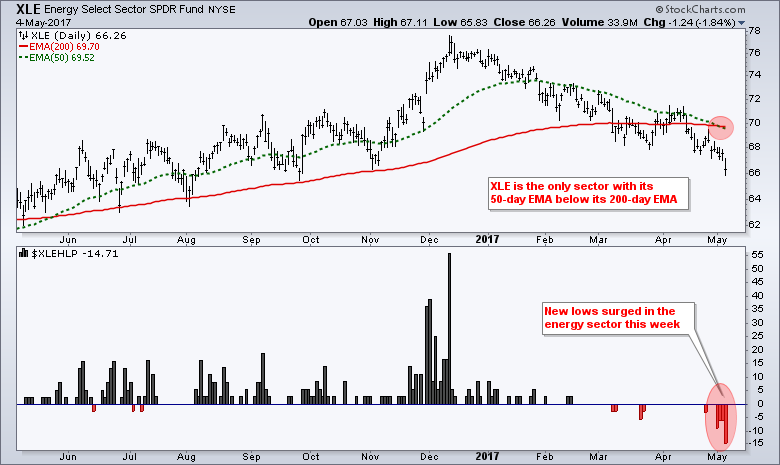
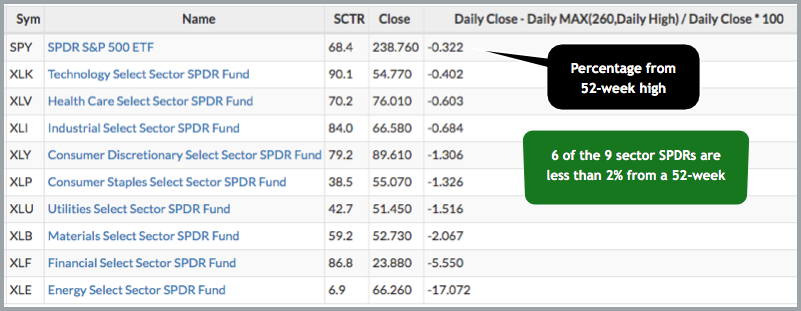
Even though the bulk of the evidence is clearly bullish right now, we are seeing some strong selling pressure in certain areas of the market - namely energy. In contrast to the technology and consumer discretionary sectors, I would not call energy a vitally important sector for broad market health. Energy is part of the broader market, but it accounts for just 6.30% of the S&P 500 and is hardly a key sector. The real trouble starts when/if the four offensive sectors start to weaken. These include technology, consumer discretionary, finance and industrials. All four of these sectors are in uptrends and they account for over 55% of the S&P 500. Throw in an uptrend in the healthcare sector and this means around 70% of the sector weightings are bullish. In fact, the table below shows that six of the nine sectors are less than 2% from a 52-week high.
New Lows are Ticking Up in Large-caps and Mid-caps
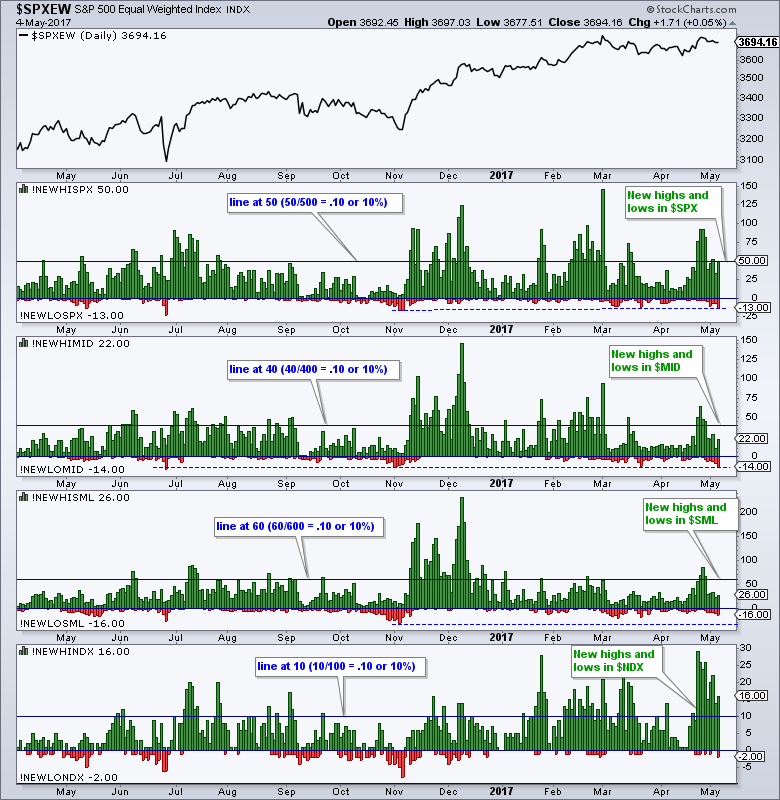
New lows expanded over the last few days with weakness in retail REITs, energy and miners. The chart below shows the high-low pairs for the S&P 500, S&P MidCap 400, S&P Small-Cap 600 and Nasdaq 100. S&P 500 new lows hit their highest level since November and S&P MidCap 400 new lows hit their highest level since June. S&P Small-Cap 600 new lows did not expand much and remain at relatively low levels. The expansion in new lows is a mild negative, but it has yet to reach a level that would affect the broader market. The blue lines are set at +10% and -10%. For example, the line at 50 marks the 10% level for the S&P 500 (50/500 = .10). You cannot see the -10% levels because we have not seen a serious expansion of new lows since early last year. I would not become concerned until we see new lows exceed 10% of the total issues traded.
%Above 200-day Holds Strong for S&P 500 and Nasdaq 100
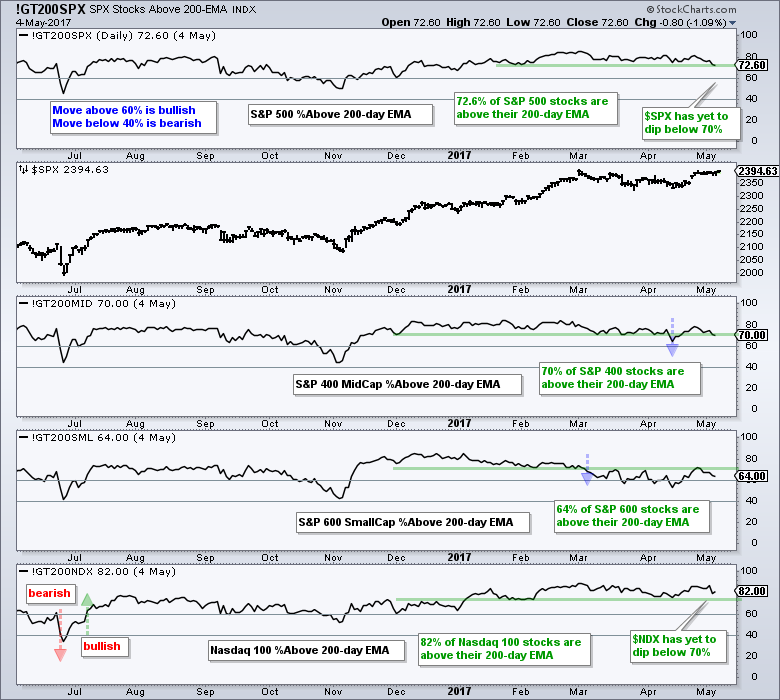
The next chart shows the percentage of stocks above the 200-day EMA for the same four indexes. This indicator turns bullish with a move above 60% and remains bullish until a move below 40%. I do not use 50% for signals because there are too many whipsaws. The S&P 500 and Nasdaq 100 have not been below 70% since January 4th (green line). I think this level can be used to identify a corrective period. A move below 70% would suggest enough underlying weakness within the indexes to warrant a pullback or consolidation. The S&P MidCap 400 moved below 70% in mid April and is currently at 70%. The S&P Small-Cap 600 moved below 70% in early March and has yet to cross back above this level. A move back above 70% would show increasing strength within the S&P Small-Cap 600 and this would be bullish.
How Long can Stocks and Bonds Rise Together?
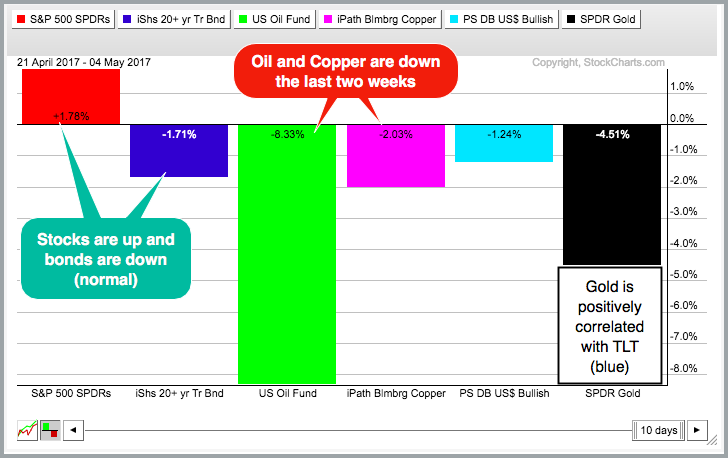
The bond market may hold the key to the next move in the stock market so I will focus on Treasuries first. Stocks and bonds rise for different reasons so they are good for measuring the risk appetite in the markets. Stocks represent risk assets and bonds represent safe-havens. Stocks rise in the face of improving economics, while bonds rise in the face of deteriorating economics. Bonds also loathe inflation and typically rise when inflationary pressures are minimal. Be careful with these assessments because they are narratives! In any case, stocks rose the last two weeks and bonds fell. This is bullish because it shows a clear preference for riskier assets.
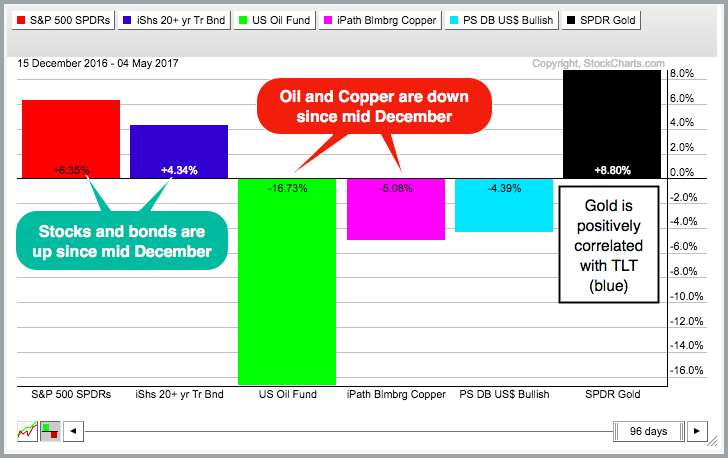
Despite two weeks of risk-on, the picture since mid December is less clear. The PerfChart below shows the S&P 500 SPDR and 20+ YR T-Bond ETF with handsome gains over the last 96 days. Something needs to give here because they cannot both be right. Either stocks correct or bonds reverse and move lower. Bonds may be rising because commodities are falling, and falling sharply. Oil is down over 15% and copper is down around 5% since mid December. This puts a damper on inflationary pressures and this is positive for bonds. Gold likes strength in bonds because it means lower Treasury yields. Note that gold and TLT are positively correlated.
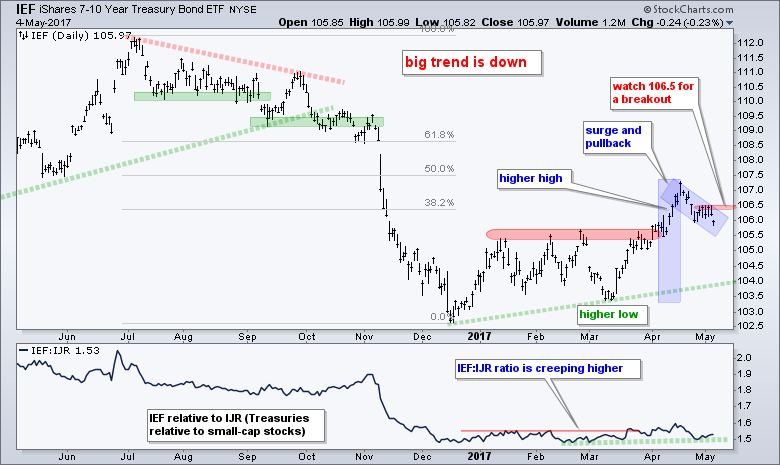
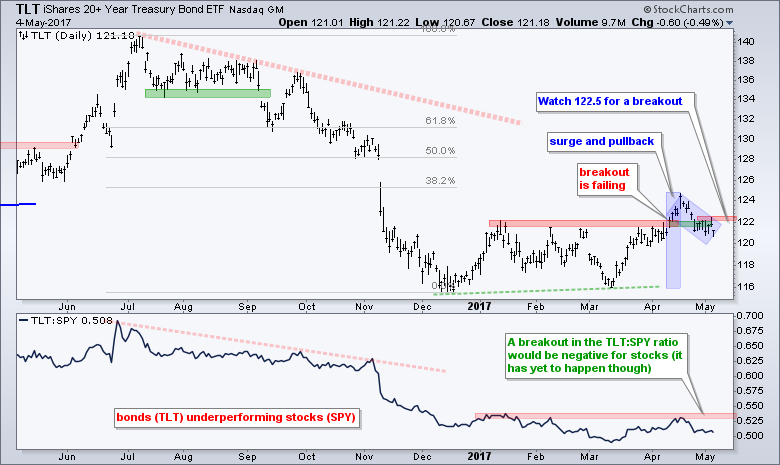
Flags Take Shape in IEF and TLT
The 7-10 YR T-Bond ETF (IEF) and the 20+ YR T-Bond ETF (TLT) surged from early March to mid April and then fell back over the last two weeks. This pullback facilitated a rally in stocks because money moving out of these safe havens had to go somewhere (into riskier assets). On the price chart, IEF and TLT formed falling flags of sorts with this week's highs marking short-term resistance. Upside breakouts would be bullish and signal a continuation of the March-April advance. Such a move would be negative for stocks and positive for gold. It hasn't happened yet, but this is what to watch in the coming days.
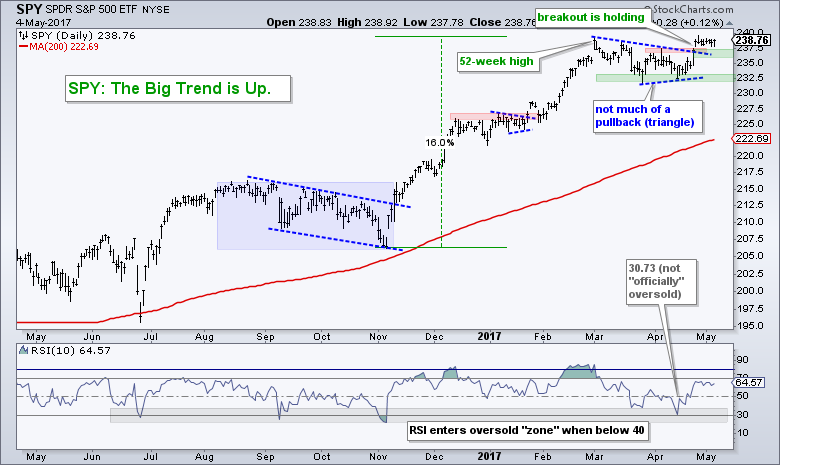
S&P 500 SPDR Holds Breakout
There is no real change for the S&P 500 SPDR (SPY). The ETF recently broke out of a triangle consolidation and this breakout is holding. Even though SPY has gone nowhere the last seven days, the breakout is bullish until proven otherwise. A close below 236 would call for a re-evaluation of the triangle breakout. The triangle lows mark the first key support level in the 232 area.
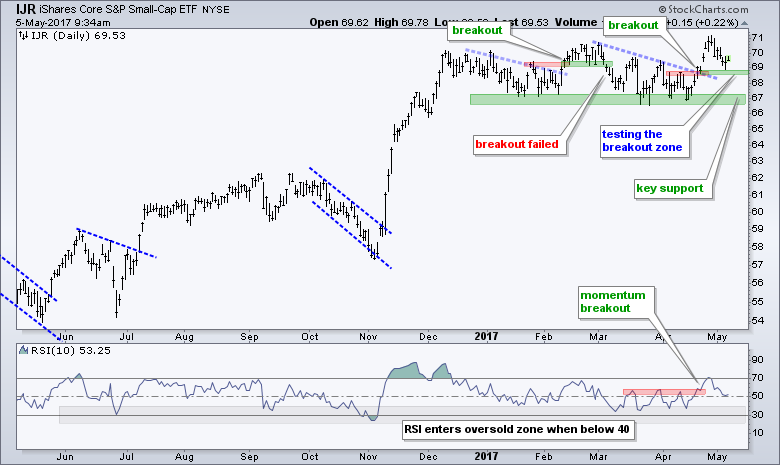
IJR Tests its Breakout
The S&P SmallCap iShares (IJR) broke out with a surge above 69 two weeks ago and even notched a 52-week high six days ago. The ETF fell back to the 69 area and is now testing the breakout zone. Notice that the mid February breakout failed when IJR moved back below 69. A close below 68.5 would call for a re-evaluation of the current breakout. The 2017 lows mark a support zone around 67 and a break here would argue for deeper decline.
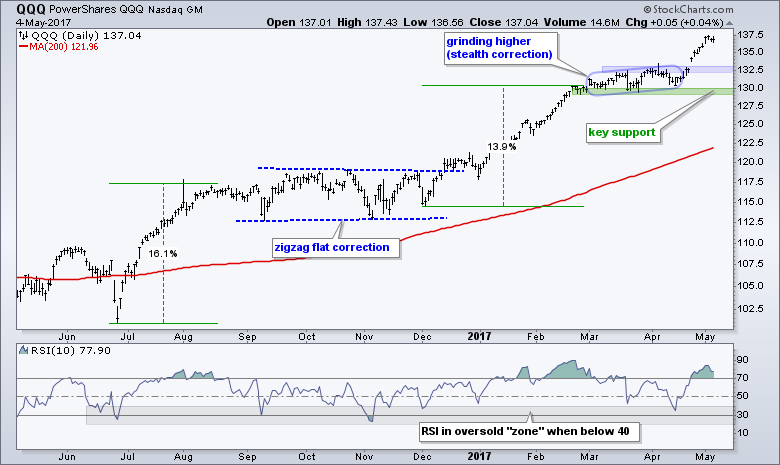
QQQ Hits Another New High
It is another week and another new high for the market leader (QQQ). It is tempting to call QQQ overbought, but we know that overbought conditions cannot be used to time pullbacks within a strong uptrend. At this stage, I would mark first support using broken resistance and key support using the March lows.
Industrials and Finance in the Spotlight
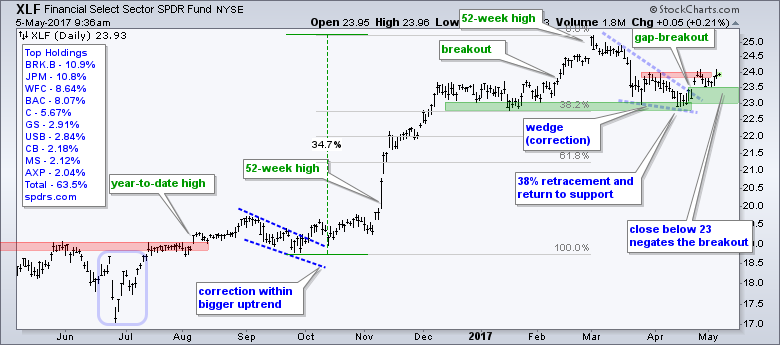
As noted above, eight of the nine sectors are in uptrends and above key support levels. In addition, eight of the nine are above their 200-day EMAs and their 50-day EMAs are above their 200-day EMAs. This will not prevent a correction, but it is evidence that the long-term trends are up. I am watching the Industrials SPDR (XLI) and the Finance SPDR (XLF) closely because they are the closest to a breakout failure. XLF bounced off support from the January low and broke a wedge line with a gap two weeks ago. This gap and breakout are largely holding, but we have yet to see much follow through. Even so, the breakout is bullish until proven otherwise. I think that a close below 23 would negate this breakout and be bearish for XLF.
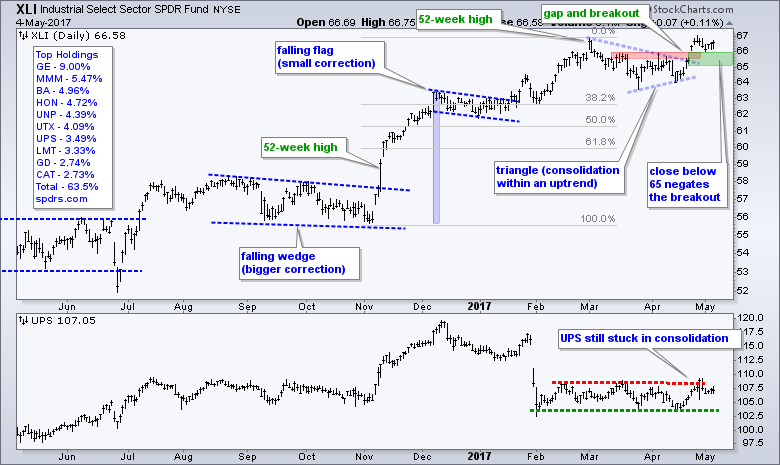
 The Industrials SPDR (XLI) broke out of a triangle consolidation two weeks ago with a gap and this breakout is holding. The breakout zone around 65-66 turns first support to watch for a failure. A close below 65 would argue for a re-evaluation. Note that such a break would not reverse the long-term uptrend.
Healthcare Takes the Lead
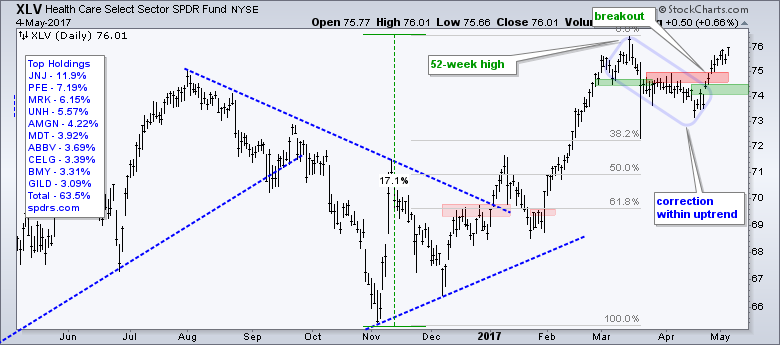
The healthcare sector continues to perform well. Note that healthcare and finance are the best performing sectors over the last nine trading days. The EW Healthcare ETF (RYH) hit a new high on Thursday and the HealthCare SPDR (XLV) is up over 3% from its late April low. The breakout in the 75 area is bullish and holding. I will set first support at 74 and re-evaluate on a close below this level.
Metals & Mining, Steel and Copper Miners
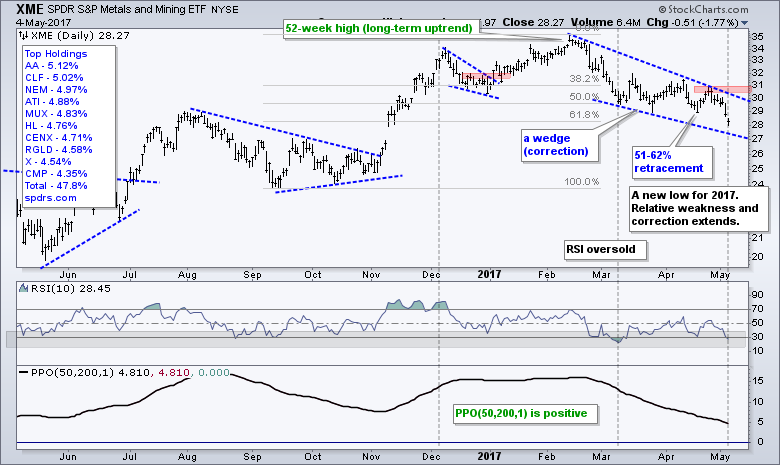
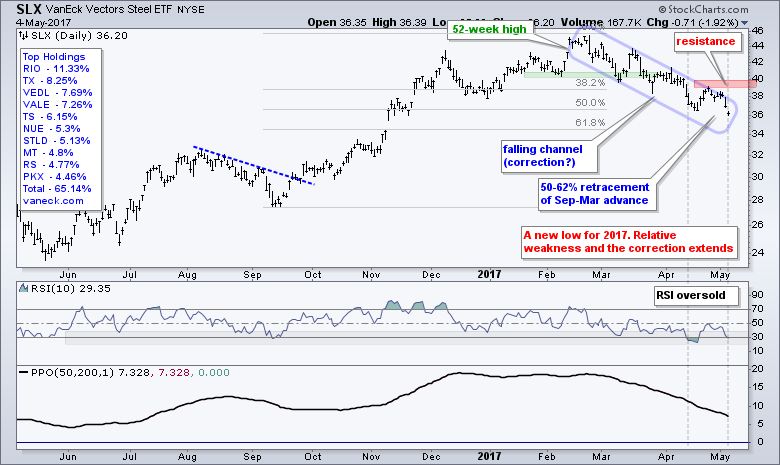
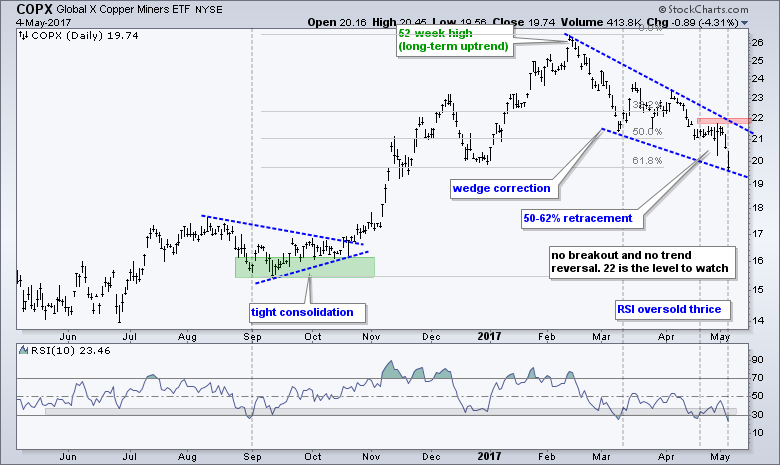
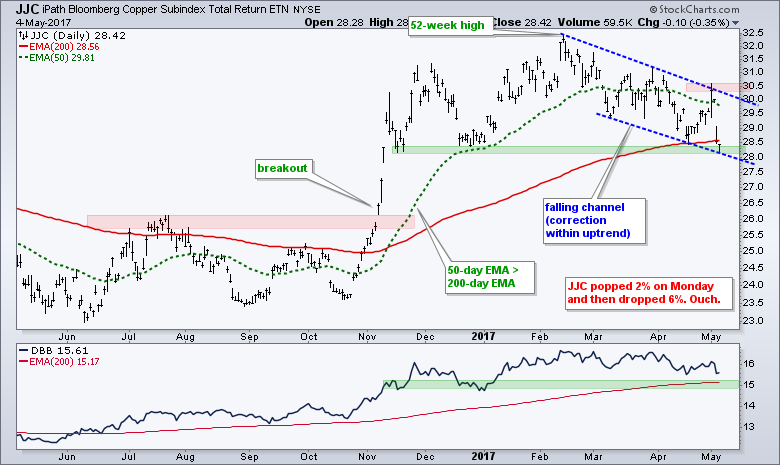
I highlighted the Metals & Mining SPDR (XME), the Steel ETF (SLX) and the Copper Miners ETF (COPX) on Tuesday because these three corrected within long-term uptrends. The long-term trends were deemed up because of 52-week highs in February and the 50-day EMAs were above their 200-day EMAs. The pullbacks were deemed corrective because they retraced 50-62% of the prior advance. These chart setups still remain, but all three fell sharply this week and extended their immediate downtrends (correction). Picking bottoms is tough, even when it could be a correction. At this stage, all three need to break above their red resistance zones to fully reverse the 2017 downtrends. Note that we saw similar setups in the Oil & Gas Equip & Services SPDR (XES) in late February and the correction never reversed. That is the risk. Perhaps we are seeing a move away from commodities in general and this is affecting these stocks negatively.
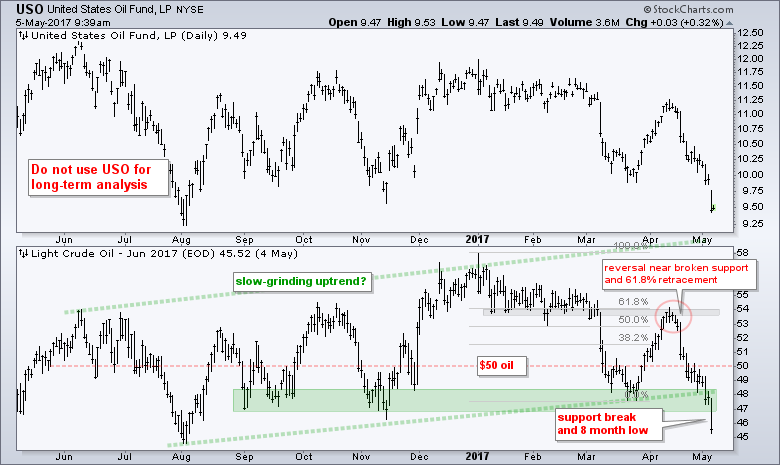
Oil Breaks to Eight Month Low
June Crude plunged over the last three days and broke below the lowest extending back to September. Crude held the 47-48 area in September, November and March, but did not in May. The break clearly reverses the slow grinding uptrend that was in place from June to April.
Gold Breaks Wedge Support
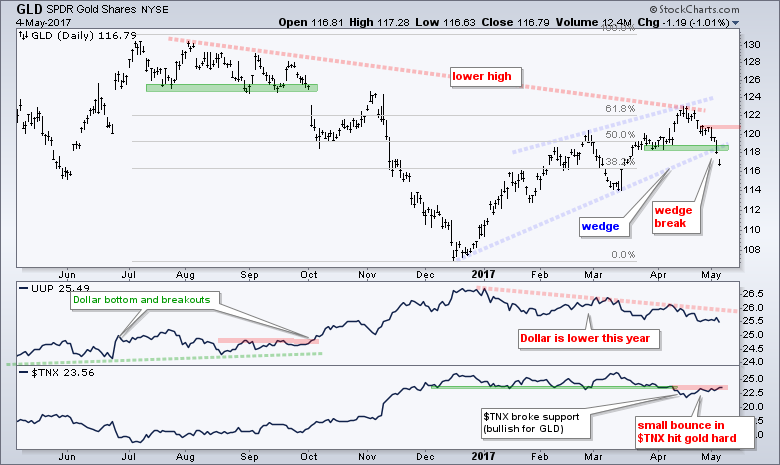
The Gold SPDR (GLD) also fell sharply over the last two weeks and broke wedge support. The 10-yr T-Yield ($TNX) bounced over the last two weeks and this was enough to take the wind out of gold. Notice that GLD formed a lower high with this wedge and the wedge break signals a continuation of the prior decline (July to December).
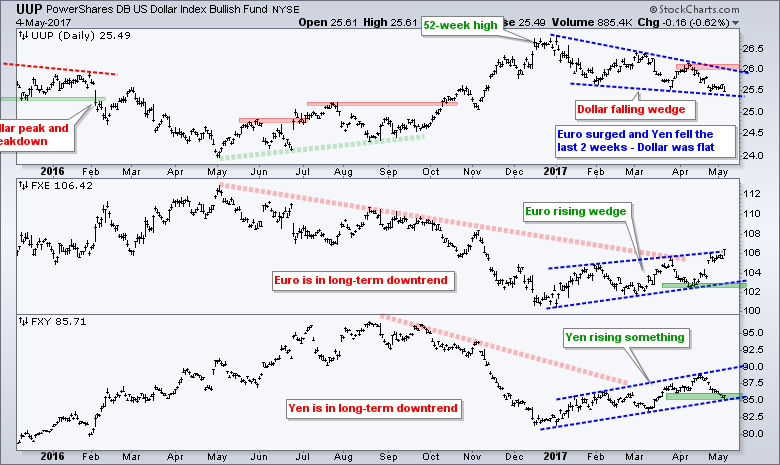
Dollar Remains within Falling Wedge
The US Dollar ETF (UUP) was flat over the last two weeks as the Euro surged and the Yen plunged. The Euro ETF (FXE) surged above 106 and extended its 2017 uptrend. The Yen ETF (FXY) fell to support and is on the verge of a break down that would signal a continuation of the bigger downtrend. The Dollar remains in a downtrend until it breaks 26.10 (early April high).
 ******************************************************
Spotting Pullbacks and Upturns within an Uptrend using RSI and MACD Histogram.
Difference between EMA and SMA - Using %Above 200-day EMA for Breadth Analysis.
Backtesting Different Moving Average Pairs with SPY, QQQ and IWM.
ETF Master ChartPack - 300+ ETFs organized in a Master ChartList and in individual groups.
Follow me on Twitter @arthurhill - Keep up with my 140 character commentaries.
****************************************
Thanks for tuning in and have a good day!
--Arthur Hill CMT
Plan your Trade and Trade your Plan
*****************************************


